2294
Incidental magnetization transfer in qMRI: effects of multi-slice imaging with mixed-TSE.1Boston University, Boston, MA, United States, 2Boston Medical Center, Boston, MA, United States
Synopsis
Purpose: To evaluate the effect of inherent and incidental magnetization transfer (MT) on T1 and T2 measurements when using the mixed turbo spin echo sequence (mixed-TSE). Methods: mixed-TSE was applied to a phantom of 1-5% agarose gel. The levels of the MT effects were induced and controlled by varying the number of slices per acquisition package. Results: T1 values were underestimated in multi-slice mixed-TSE. No obvious trend was observed for T2 measurements. Conclusion: mixed-TSE is powerful and efficient tool for qMRI, yet caution should be taken when interpreting the derived T1 values because of MT effects.
Introduction
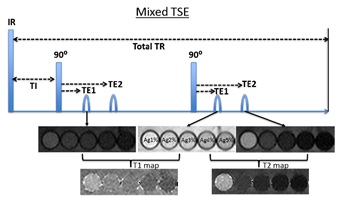
Mixed turbo spin echo (mixed-TSE) acquisition is time efficient, and can be utilized to generate quantitative T1 and T2 maps 1, 2, which permits direct inter-subject comparison. To maximize efficiency, multi-slice acquisition is often adopted in TSE based sequences. However, incidental magnetic transfer (MT) is a well-known phenomenon caused by multi-slice imaging 3. The off-resonance radio frequency (RF) deposition, originated from pulses targeting adjacent slices, saturates protons bounded to macromolecules, and subsequently transfers the saturation to mobile ones. The incidental magnetization transfer inevitably exists in all images acquired at four time-points (Figure 1), yet its net effect on T1 and T2 quantification is still unknown. The purpose of this work was to evaluate the MT effects of the mixed-TSE sequence in T1 and T2 measurements.Methods and Materials
As shown in Figure 1, Mixed-TSE consists of an initial inversion recovery pulse (IR), and after a delay (TI), is followed by two 90⁰ excitation pulses with the same repetition time (TR). The total TR would be TI+2TR. After each 90⁰ excitation pulses, images are acquired at both echo times, TE1 and TE2, using TSE. All scans were performed at a 3T system (Achieva, Philips Healthcare, Best, The Netherlands). Key parameters were: TI=1000ms, total TR=19000ms, each train length= 12, TE1=12.858ms, TE2=90, voxel dimensions = 0.5 x 0.5mm3, slice thickness=2mm NEX=1, and acquisition package=2. The incidental MT effects were introduced by varying slice number per acquisition package. The number of slices varied between 2 to 20, with an interval of 2. The resulting slice per package was from 1 to 10, with an interval of one. Two slices located at the central remained at the same location across all acquisition volumes with various slice number, and was used for later T1/T2 comparison. The matching T1, and T2 mapping algorithms were programmed in Matlab (version R2017a, Mathworks, MA). The phantom used in this study consisted of 1%, 2%, 3%, 4% and 5% agarose gel, solidified in 15ml Falcon tubes. Manual contours were drawn in ImageJ (NIH) to obtain the mean and the standard deviation for each sample with various slice/package.Results
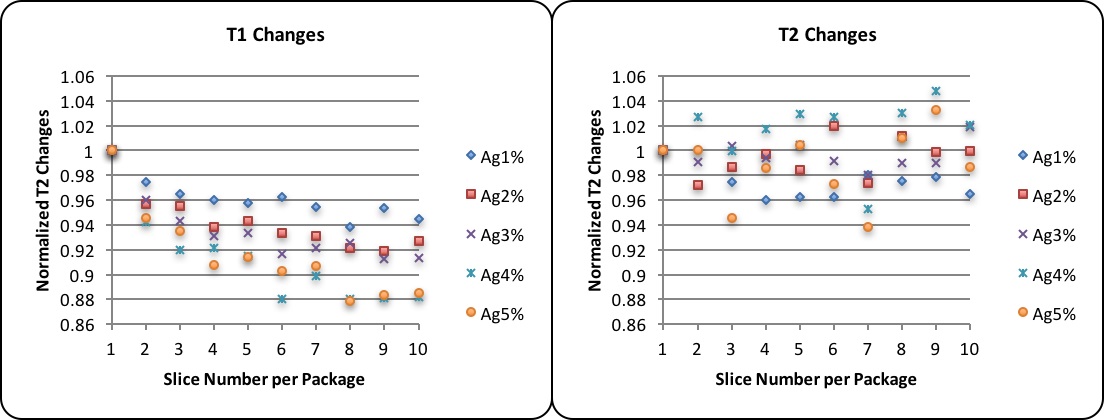
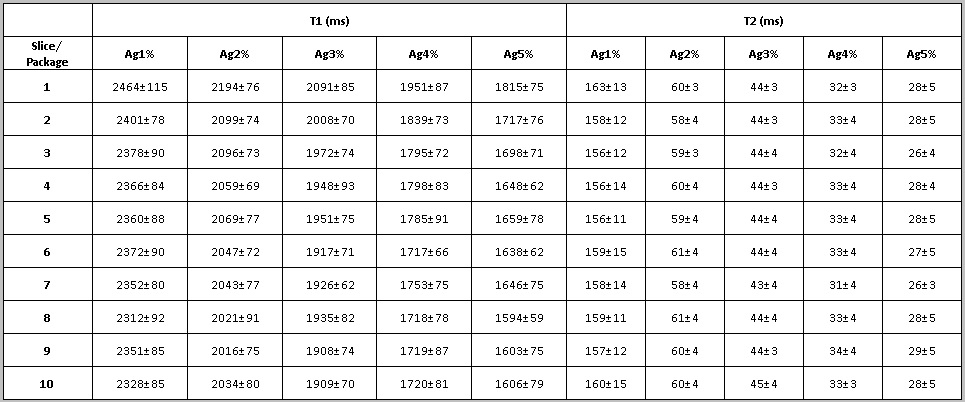
The measure T1 and T2 values are listed in Table 1. To facilitate comparison between different concentrations of agarose gels, all the T1 andT2 values were normalized to the corresponding mean values measured at 1 slice/package (Figure 2). With the increase of agarose concentration, the portion of protons bounded to macro-molecules increases, and we observed an expected decrease of T1, and shortening of T2 (Table 1). As more protons bounded to macro-molecules, an increased MT effects was expected, and a corresponding increased underestimation of T1 was observed (Figure 2): for 1% agarose, there is a maximum of 6.2% T1 decrease; 2% agarose, 8.1% T1 decrease; 3% agarose, 8.8% T1 decrease; 4% agarose, 11.9% T1 decrease; 5% agarose, 12.2% T1 decrease. Among the 5 agarose samples, in 3 the maximum decrease of T1 were observed when there was 7 slices/package, and the other 2 at 8 slices/package. There is no obvious trend of T2 changes was observed upon MT influence.Discussion
With the advent of faster MRI pulse sequences and image processing techniques, quantitative MRI is now possible in routine clinical practice. The derived metrics may enable several post-processing applications such as Synthetic MRI, Structural qMRI, and most importantly, it can enhance diagnostic accuracy by allowing direct intra-patient and inter-patient comparisons. However, multi-slice acquisition causes incidental MT, and results an underestimation of T1 values, but no obvious effects was observed on T2 measurements. The fact that the amount of T1 decrease peaked around 7~8 slices/package suggests that, in this agarose gel phantom, the range of off-resonance saturation covers a territory of ±2mmx7 or 8 (±14 to 16mm).Conclusion
The incidental MT effects in multi-slice mixed-TSE may lead to an underestimation of T1 values. The extent of this underestimation is directly related to the number of adjacent slices in the acquisition package that may exert off-resonance saturation. However, there is no obvious MT effect on T2 measures.Acknowledgements
No acknowledgement found.References
1. In den Kleef, JJE, Cuppen, JJM.,RLSQ: T1, T2, and ρ calculations, combining ratios and least squares. Magn. Reson. Med. 1987; 5: 513–524.
2. Suzuki S, Sakai O, Jara H., Combined volumetric T1, T2 and secular-T2 quantitative MRI of the brain: age-related global changes (preliminary results). Magn Reson Imaging. 2006 Sep;24(7):877-87
3. Dixon, W. T., Engels, H., Castillo, M., & Sardashti, M., Incidental magnetization transfer contrast in standard multislice imaging. Magnetic Resonance Imaging, 1990;8(4), 417–422.
Figures