2293
MR Measurements of Blood Oxygenation and Hematocrit during Gas Challenges1Radiology, Stanford University, Stanford, CA, United States
Synopsis
A new MR approach has been proposed to obtain simultaneous measurements of blood oxygen saturation (SO2) and hematocrit (Hct) by measuring and combining blood MR relaxation times. Although the first results were encouraging, the method has not been properly validated. In this study, we tested this approach in 10 volunteers subjected to gas challenges with the intent to modify SO2 while keeping Hct constant. The method was also tested in 10 Moyamoya patients and compared to photometric analysis. Results suggest that reliable MR estimates of both SO2 and Hct can be obtained in vivo.
Introduction:
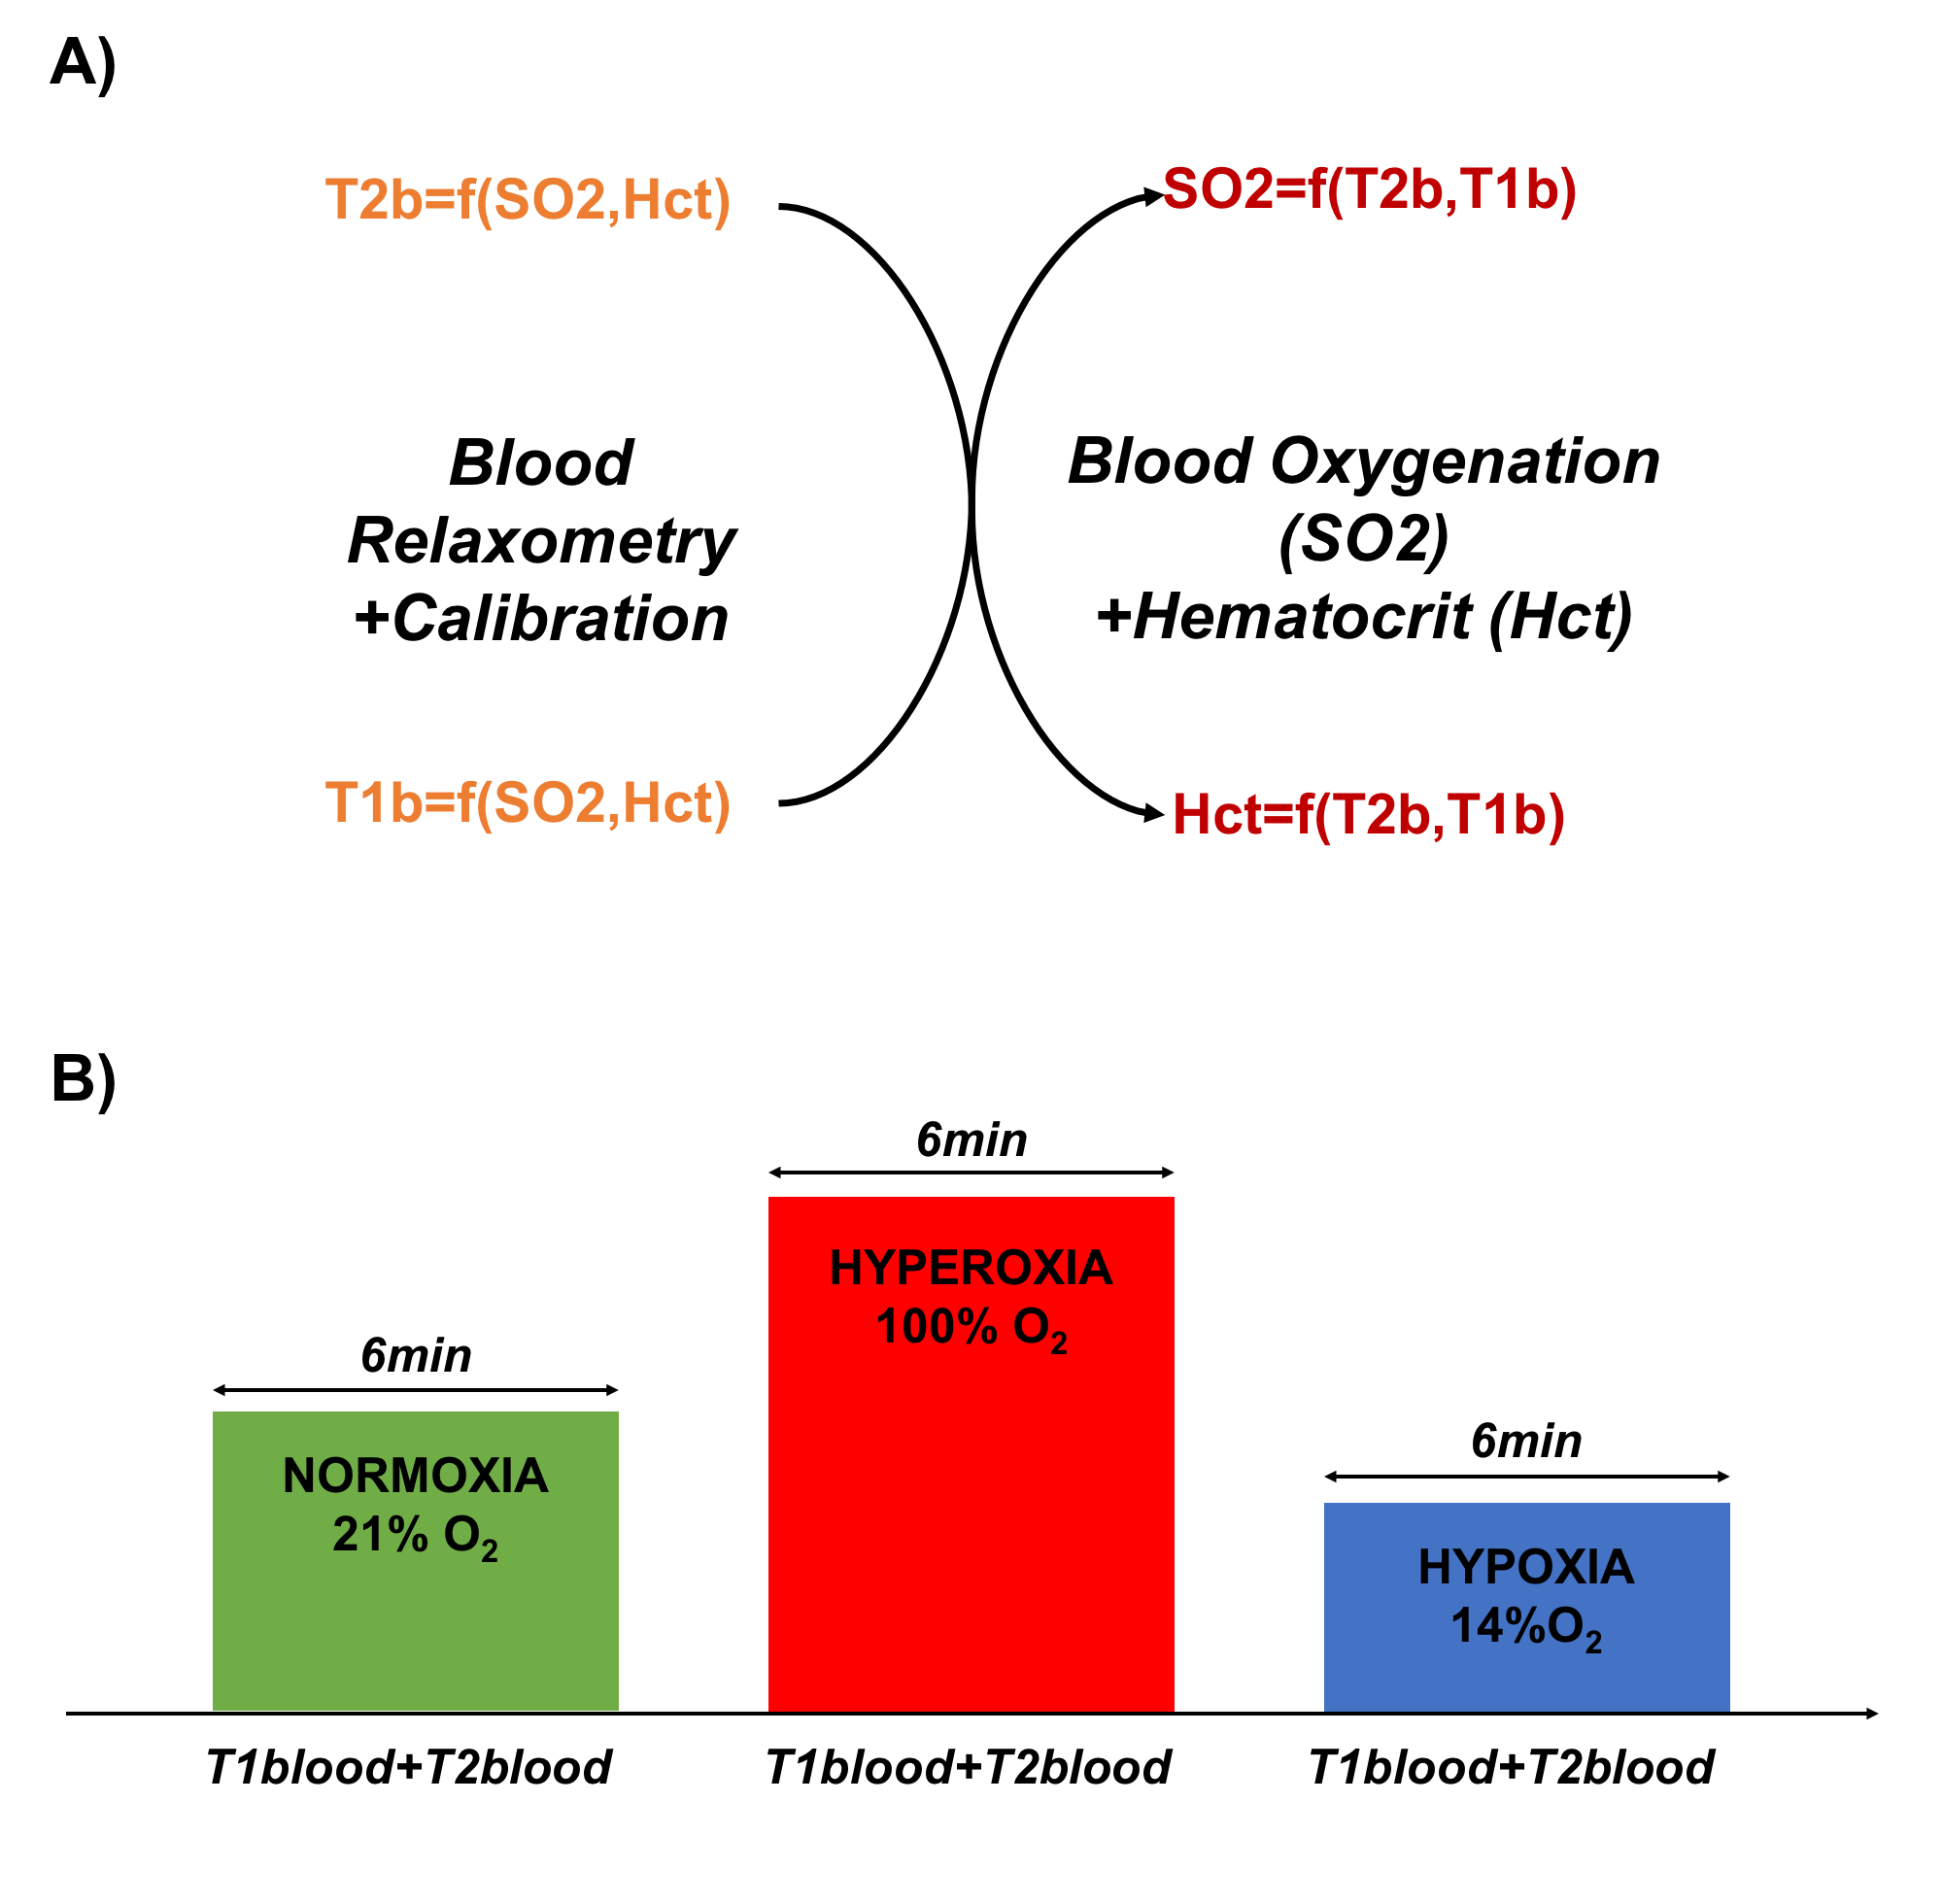
An MR approach has been recently proposed to obtain simultaneous measurements of blood oxygen saturation (SO2) and hematocrit (Hct) by combining two or more in vivo estimates of blood MR relaxation times1 (Fig.1a). Although the first results obtained in 5 healthy volunteers were encouraging (with average estimates in agreement with literature values), the method has not been properly validated. In this study, we tested the approach in 10 volunteers subjected to normoxic, hyperoxic and hypoxic gas challenges with the intent to modify SO2 while keeping Hct constant. The method was also tested in 10 Moyamoya patients and compared to photometric analysis.Materials and Methods:
The local IRB committee approved all studies. Experiments were performed at 3T (GE Healthcare Systems, Waukesha, WI) with an 8-channel GE receive-only head coil. The MR acquisition protocol included: (1) a blood T2 mapping sequence based on the TRUST approach2 (acq matrix=64x64, FOV=22x22cm2, NA=4, TR=10s, TEs=20-40-60-100ms, Acq time=264s). (2) a blood T1 mapping sequence proposed by Valera et.al3-4 using an adiabatic nonselective 180° global inversion pulse, followed by a thin single-slice selective Look-Locker echo-planar imaging (acq matrix=96x96, FOV=22x22cm2, NA=6, TR=10s, first inversion time TI=50ms, ∆TI=150ms, 60 TI values, Acq time=70s). Calibration curves1 were used to convert (T1, T2) measurements into (SO2, Hct) estimates. Two types of experiments were performed:
(1) Changes during Gas challenges: 10 volunteers were scanned while breathing different gas mixtures (Hyperoxia (100%O2), Normoxia (21%O2), hypoxia (14%O2)). Each epoch lasted 6 minutes and acquisitions started after 1 min to ensure stable gas environment and subject physiology. Hct and SO2 were measured during each epoch for all volunteers (see Fig.1b).
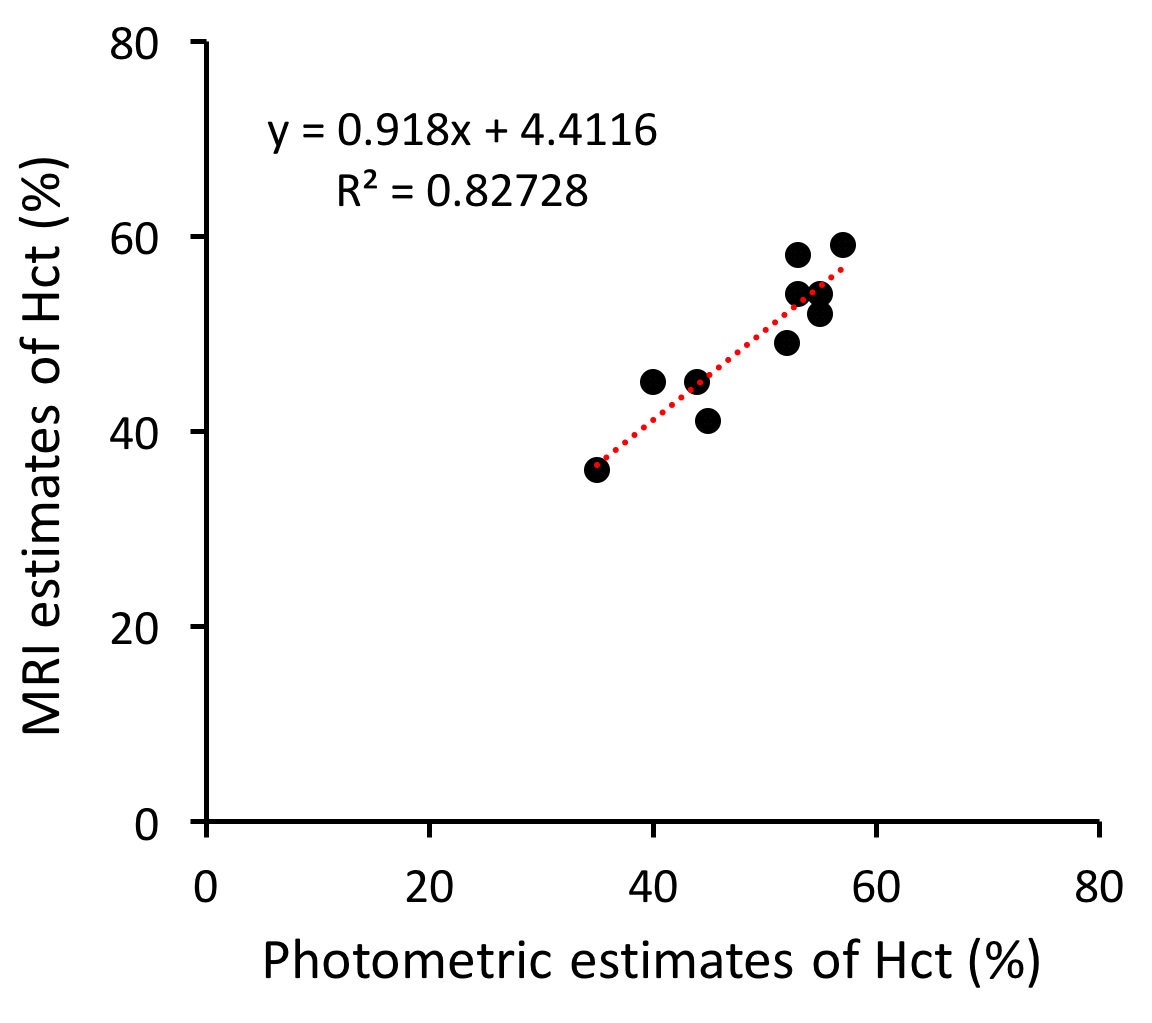
(2) Correlation with blood gas analysis: 10 Moyamoya patients were scanned while breathing normoxic gas. Before and after the MR acquisitions, small blood samples (<0.5mL) taken from the patient’s IV were analyzed with a hemoglobin Meter (HemoPoint®, Stanbio).
Results:
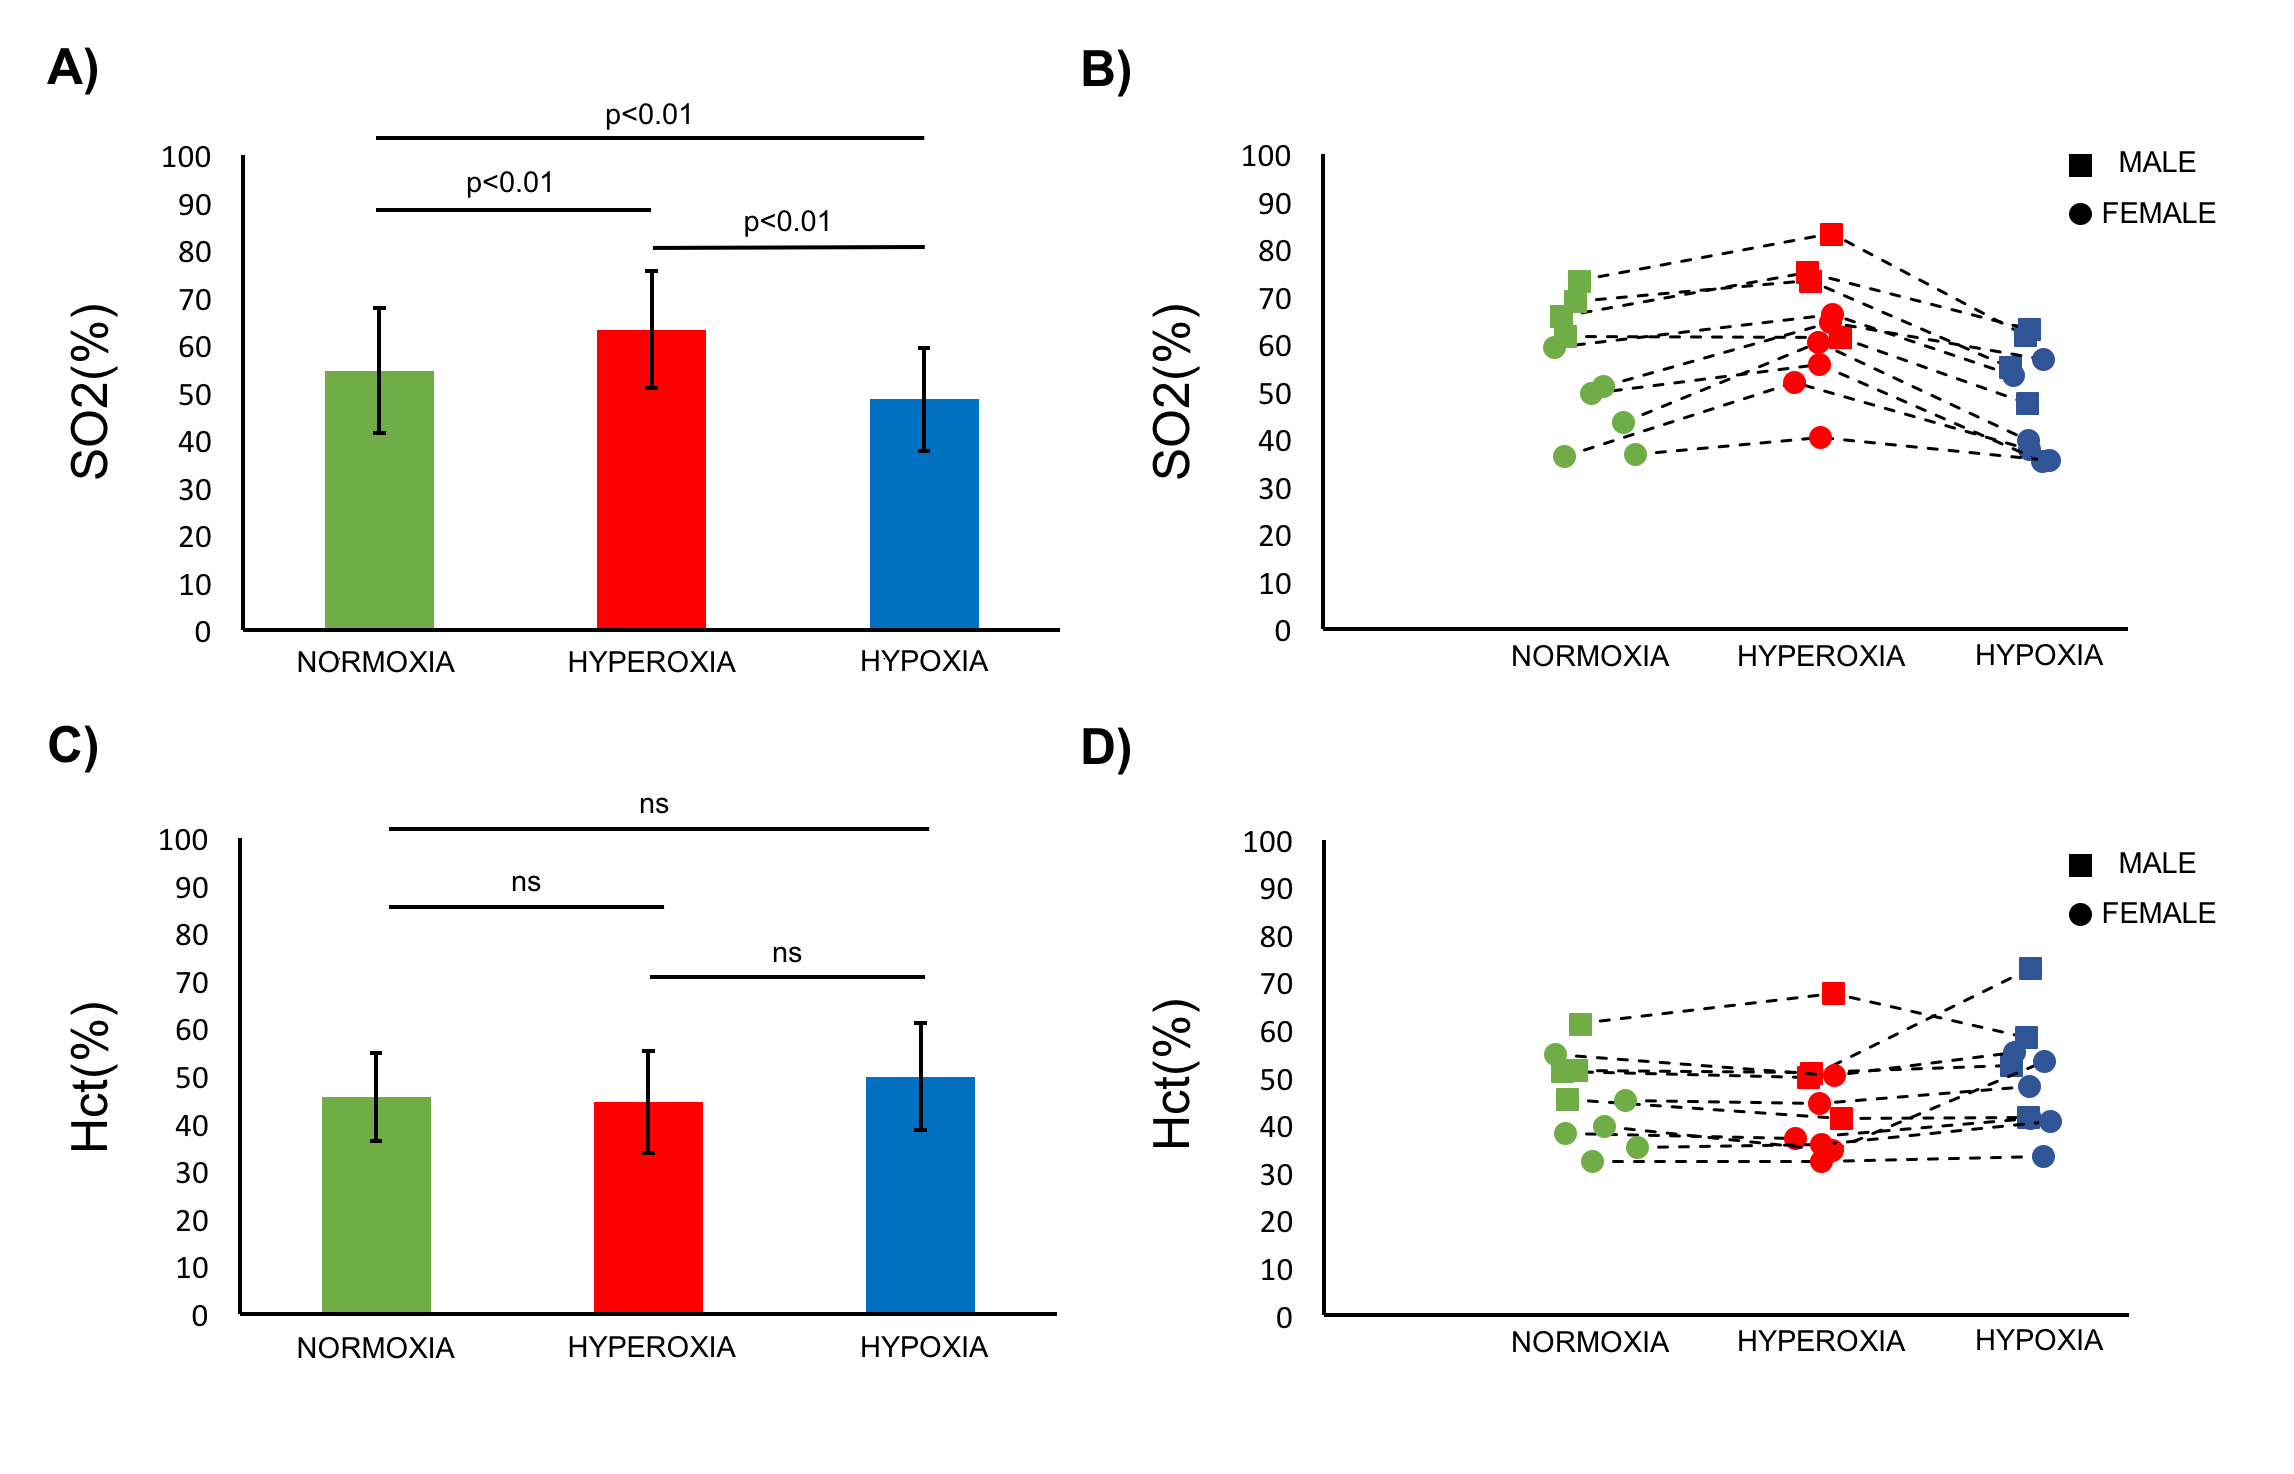
Averaged values, standard deviations as well as individual estimates are shown in Figure 2 for all gas challenges. In normoxic conditions, SO2 values measured in the superior sagittal sinus (SSS) (55±13%) are in line with previous reports5. Hct results (45±9%) are also in agreement with standard laboratories reports6. One can notice (Fig.2b-2d) that higher SO2 and Hct values were obtained in male volunteers6. Hyperoxic challenges resulted in a significant increase of SO2 values (63±12%, p<0.01) while hypoxic challenges resulted in a significant decrease (48±11%, p<0.01). On the contrary, Hct estimates stayed stable during the challenges. A good correlation (high correlation coefficient and correlation line close to unity) was found in Moyamoya patients between MR and photometric measurements of Hct (Fig.3).Conclusion:
This study suggests that reliable MR estimates of both SO2 and Hct can be obtained in vivo. Several technical improvements can be foreseen (fast whole brain acquisition, custom calibration models, combination of 3 or more parameter estimates, etc.) and further validation steps are still required (analysis of sensitivity and repeatability, effect of partial volume, etc.). Nonetheless, this approach seems promising for non-invasive detection of hypoxic tissues in several pathologies and could be used to calibrate other MR techniques such as Arterial Spin Labeling.Acknowledgements
Supported in part by (NIH 5R01NS066506, NIH 2RO1NS047607, NCRR 5P41RR09784, R21-NS087491).References
[1] Christen et.al, Proc. ISMRM, 2017 [2] Lu and Ge, MRM, 2008. [3] Varela et.al, NMR Biomed 2011 [4] Zhang et.al, MRM 2013 [5] Jain et.al, JCBFM 2010 [6] University of Iowa Diagnostic Laboratories (UIDL).Figures