2292
Relative perfusion mapping using BOLD imaging with induced hypoxia1Biomedical Engineering, University of Southern California, Los Angeles, CA, United States, 2Division of Radiology, Children's Hospital of Los Angeles, Los Angeles, CA, United States, 3Neuroscience Graduate Program, University of Southern California, Los Angeles, CA, United States, 4Division of Cardiology, Children's Hospital of Los Angeles, Los Angeles, CA, United States
Synopsis
DSC MRI is a popular perfusion technique that requires the use of an invasive exogenous contrast. This study proposes an alternative technique which uses BOLD imaging and 100% nitrogen inhalation to map relative perfusion values (rCBV, rCBF and rMTT) without the use of contrast. We evaluated its performance on a cohort of healthy controls and sickle cell disease patients with a large range of global cerebral blood flow.
Introduction
Dynamic Susceptibility Contrast (DSC) MRI is a popular clinical method to assess cerebral perfusion due to its high spatial resolution and ability to characterize tumor hemodynamics. However, it is used less frequently in non-oncological cases due to its dependence on an exogenous contrast.1 In this study, we investigated the use of BOLD imaging with 100% nitrogen inhalation as an alternative contrast bolus to gadolinium chelate. Evaluation of the BOLD signal loss during the brief period of induced hypoxia yields relative perfusion measurements of Cerebral Blood Volume (rCBV), Cerebral Blood Flow (rCBF) and Mean Transit Time (rMTT). Application of this method on healthy controls and sickle cell disease patients allows robust evaluation of its performance.Methods
16 healthy controls (CTL) and 11 sickle cell disease patients (SCD) underwent an MR study using a Philips 3T Achieva with an 8-element head coil accompanied by complete blood work. All patients provided informed consent under a protocol (CCI#11-0083) approved by the Committee on Clinical Investigation at Children’s Hospital Los Angeles.
3D T1-weighted images (TR=8.20ms, TE=3.77ms, resolution=1x1x1mm), BOLD time series (150 volumes, TR=2000ms, TE=50ms, FOV=220x220x26, resolution=2.3x2.3x5mm) and Phase Contrast (PC) images (TR=1286ms, TE=77ms, FOV=220x220, resolution=1.2x1.2x5mm, velocity encoding gradient=200mm/s) were collected on all subjects.
Patients wore a breathing mask connected to a source of pressurized room air while being imaged. At the 25th dynamic of the BOLD acquisition, the breathing circuit was switched to 100% nitrogen gas. After 5 inhalations, the nitrogen was replaced by room air gas mixture again until the end of the experiment.
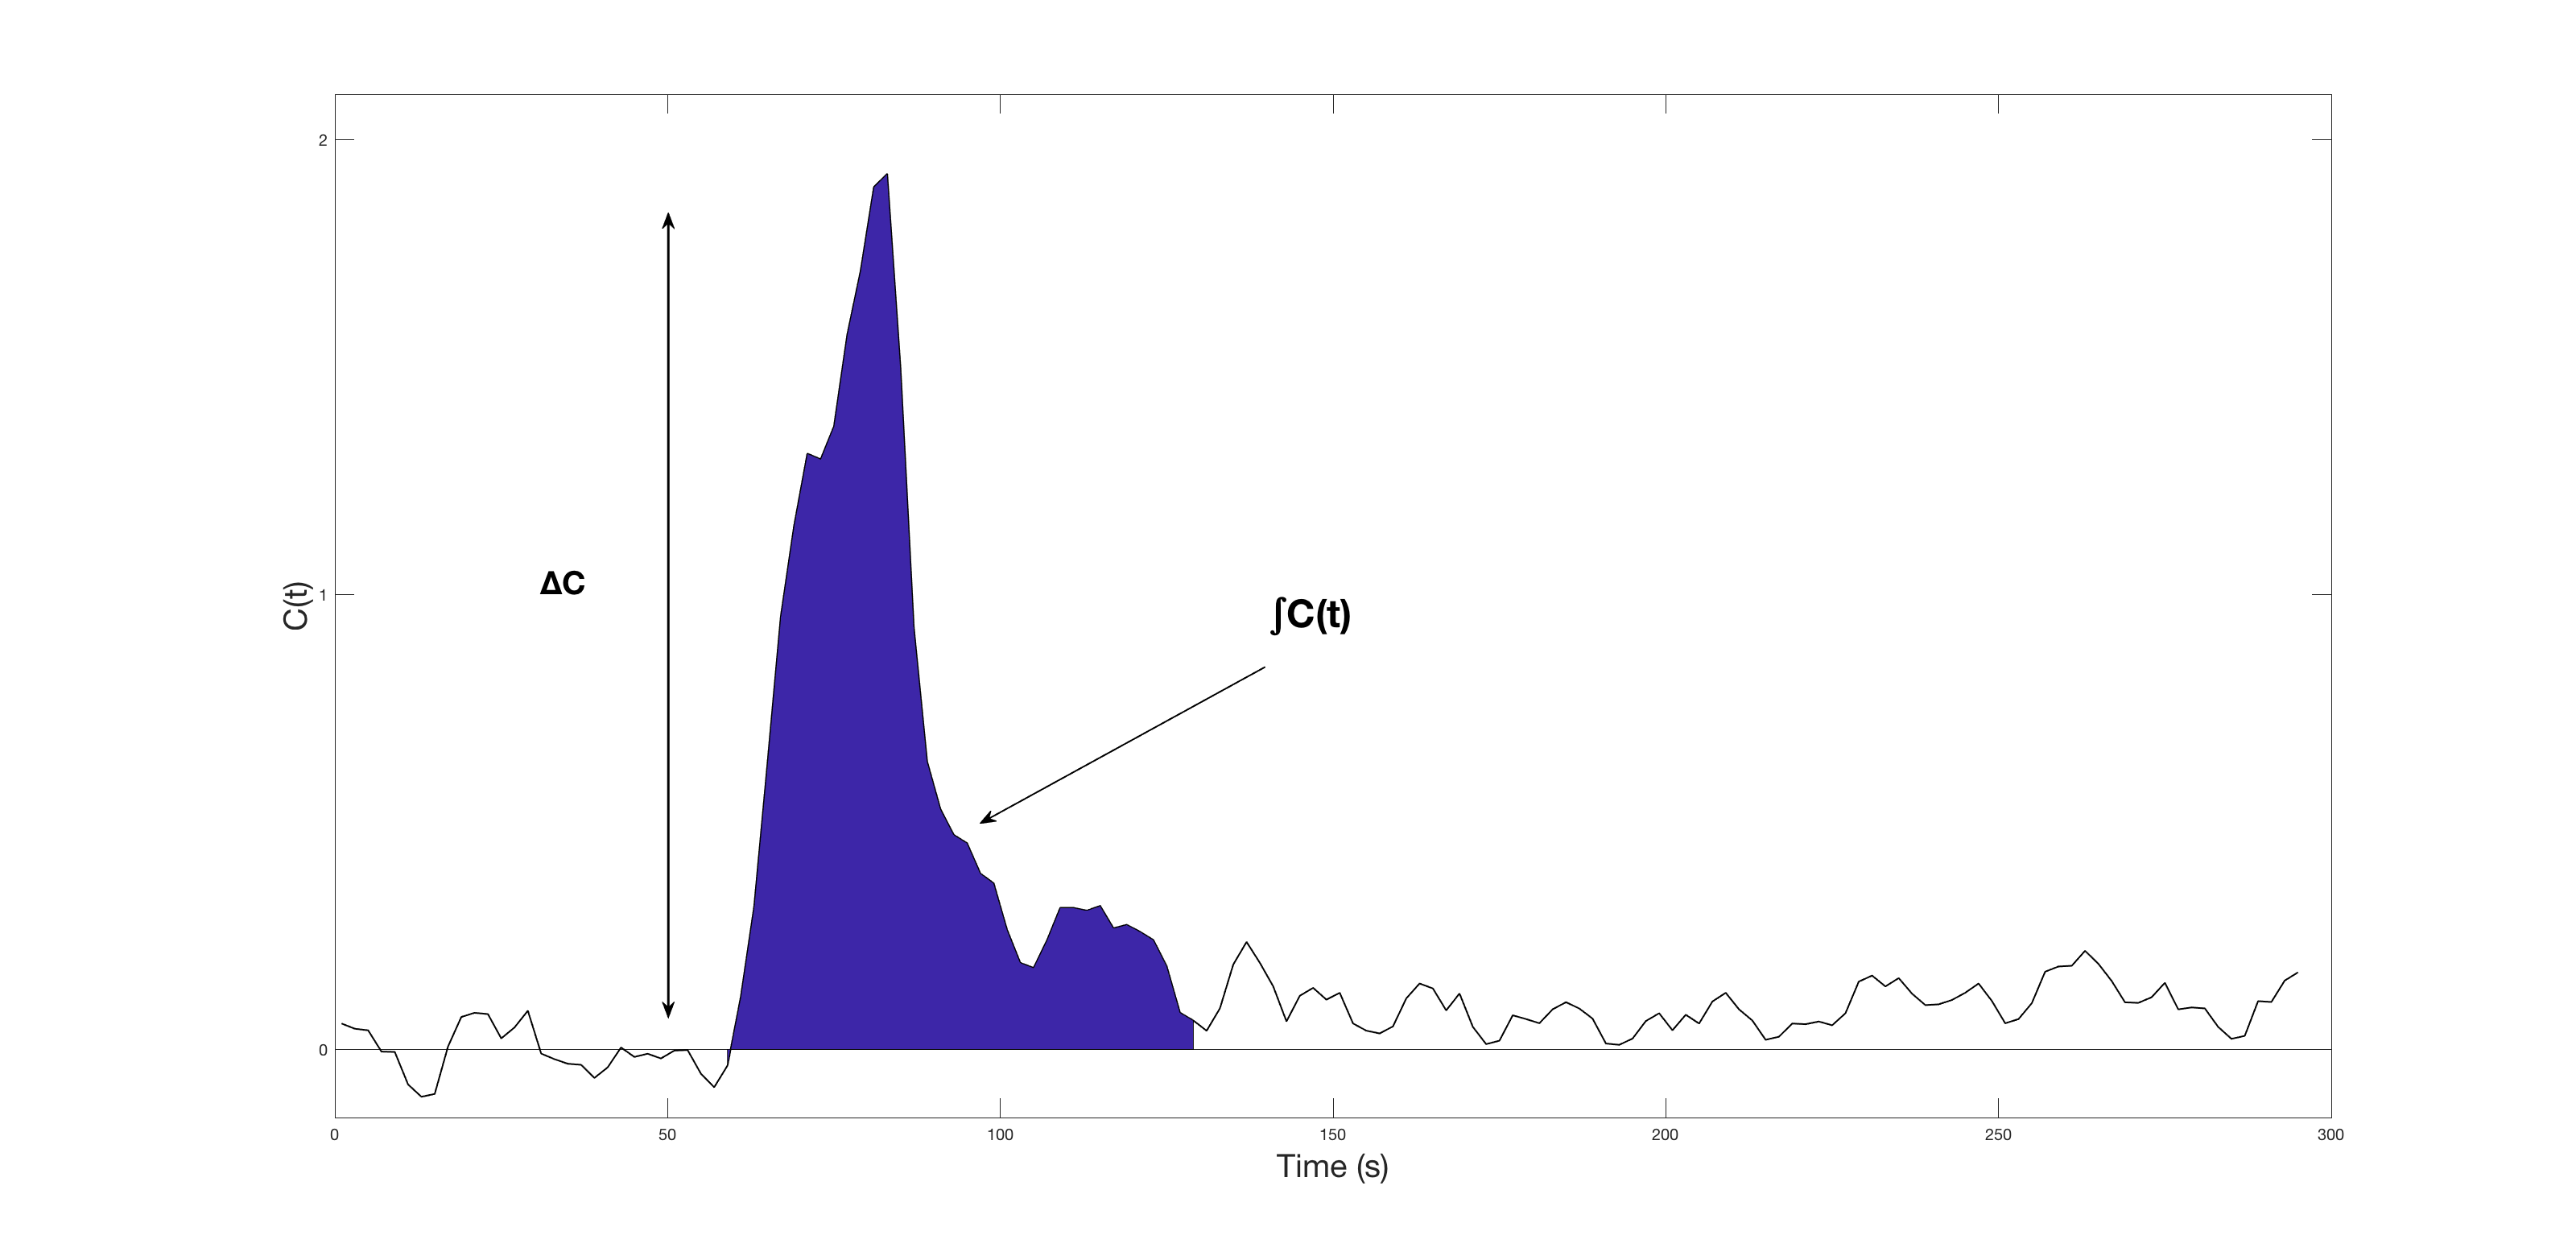
BOLD images were processed with FMRIB Software Library (FSL). The first 2 volumes were discarded to allow the signal to reach equilibrium then the remaining 148 volumes were rigidly registered with mcflirt to the central volume for motion correction. The central volume of the BOLD images was coregistered onto the T1 image, which was non-linearly registered onto the MNI template using flirt and fnirt. BOLD images were then transformed onto the MNI template then smoothed with an 8x8x8mm Gaussian kernel. The concentration time curve, as shown in Figure 1, is calculated with $$$C(t)=-\frac{1}{TE}ln(\frac{S(t)}{S_0})$$$, where S0 is the baseline BOLD signal. Relative CBV, MTT and CBF were calculated from adapted DSC equations: $$rCBV=\frac{κ}{ρ}\frac{\int_{}^{}C(t)}{\int_{}^{}SpO_2(t)}$$ $$rMTT=\frac{\int_{}^{}C(t)}{ΔC}$$ $$rCBF=\frac{rCBV}{rMTT}$$ where SpO2(t) is the pulse oximetry measurements, ρ is the brain density 1.04g/mL, κ is microvasculature hematocrit correction $$$κ=\frac{1-Hct}{1-0.69Hct}$$$,2 ΔC is the difference between baseline and peak hypoxia signal.
Results
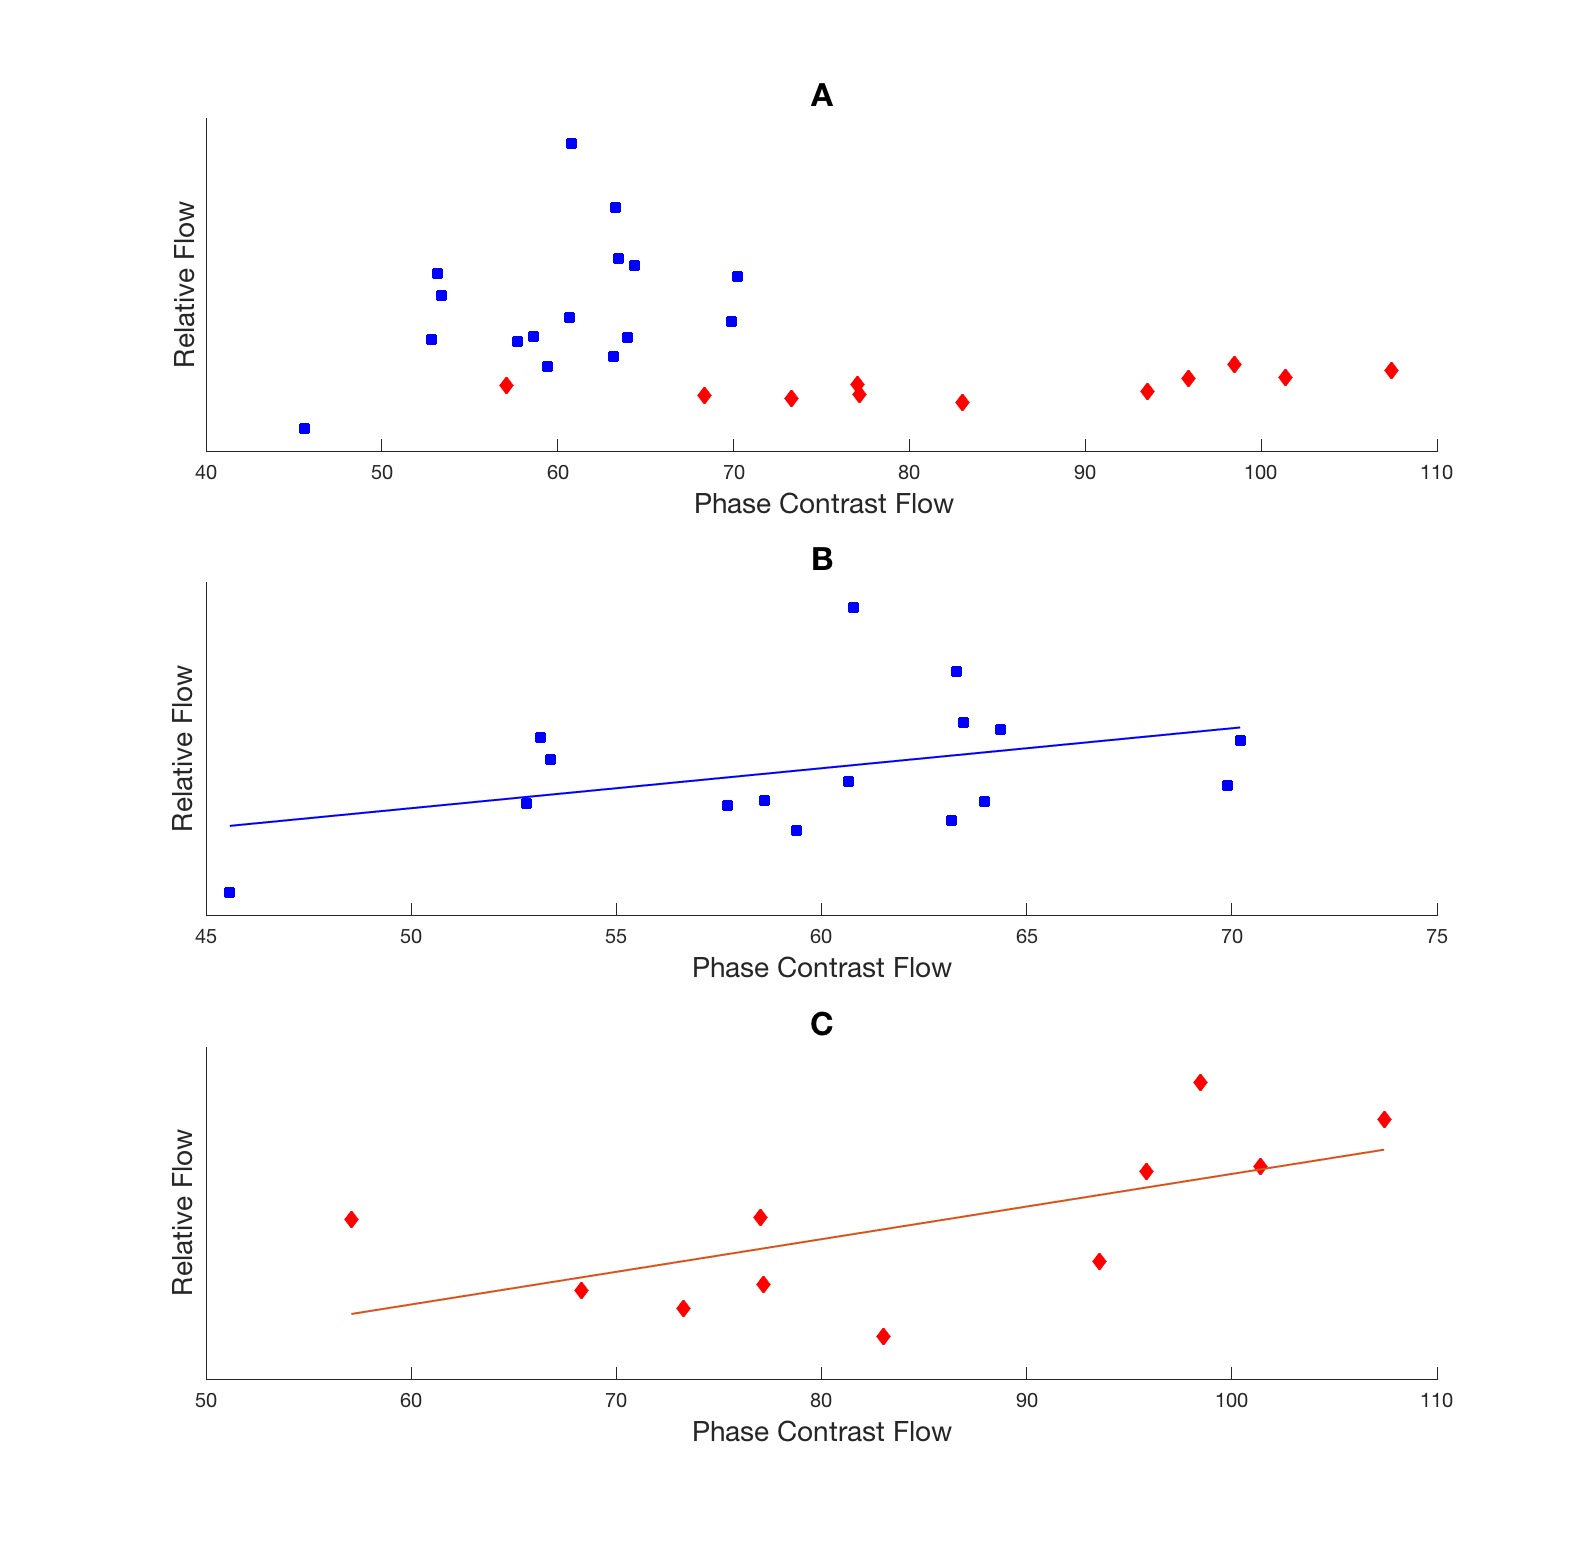
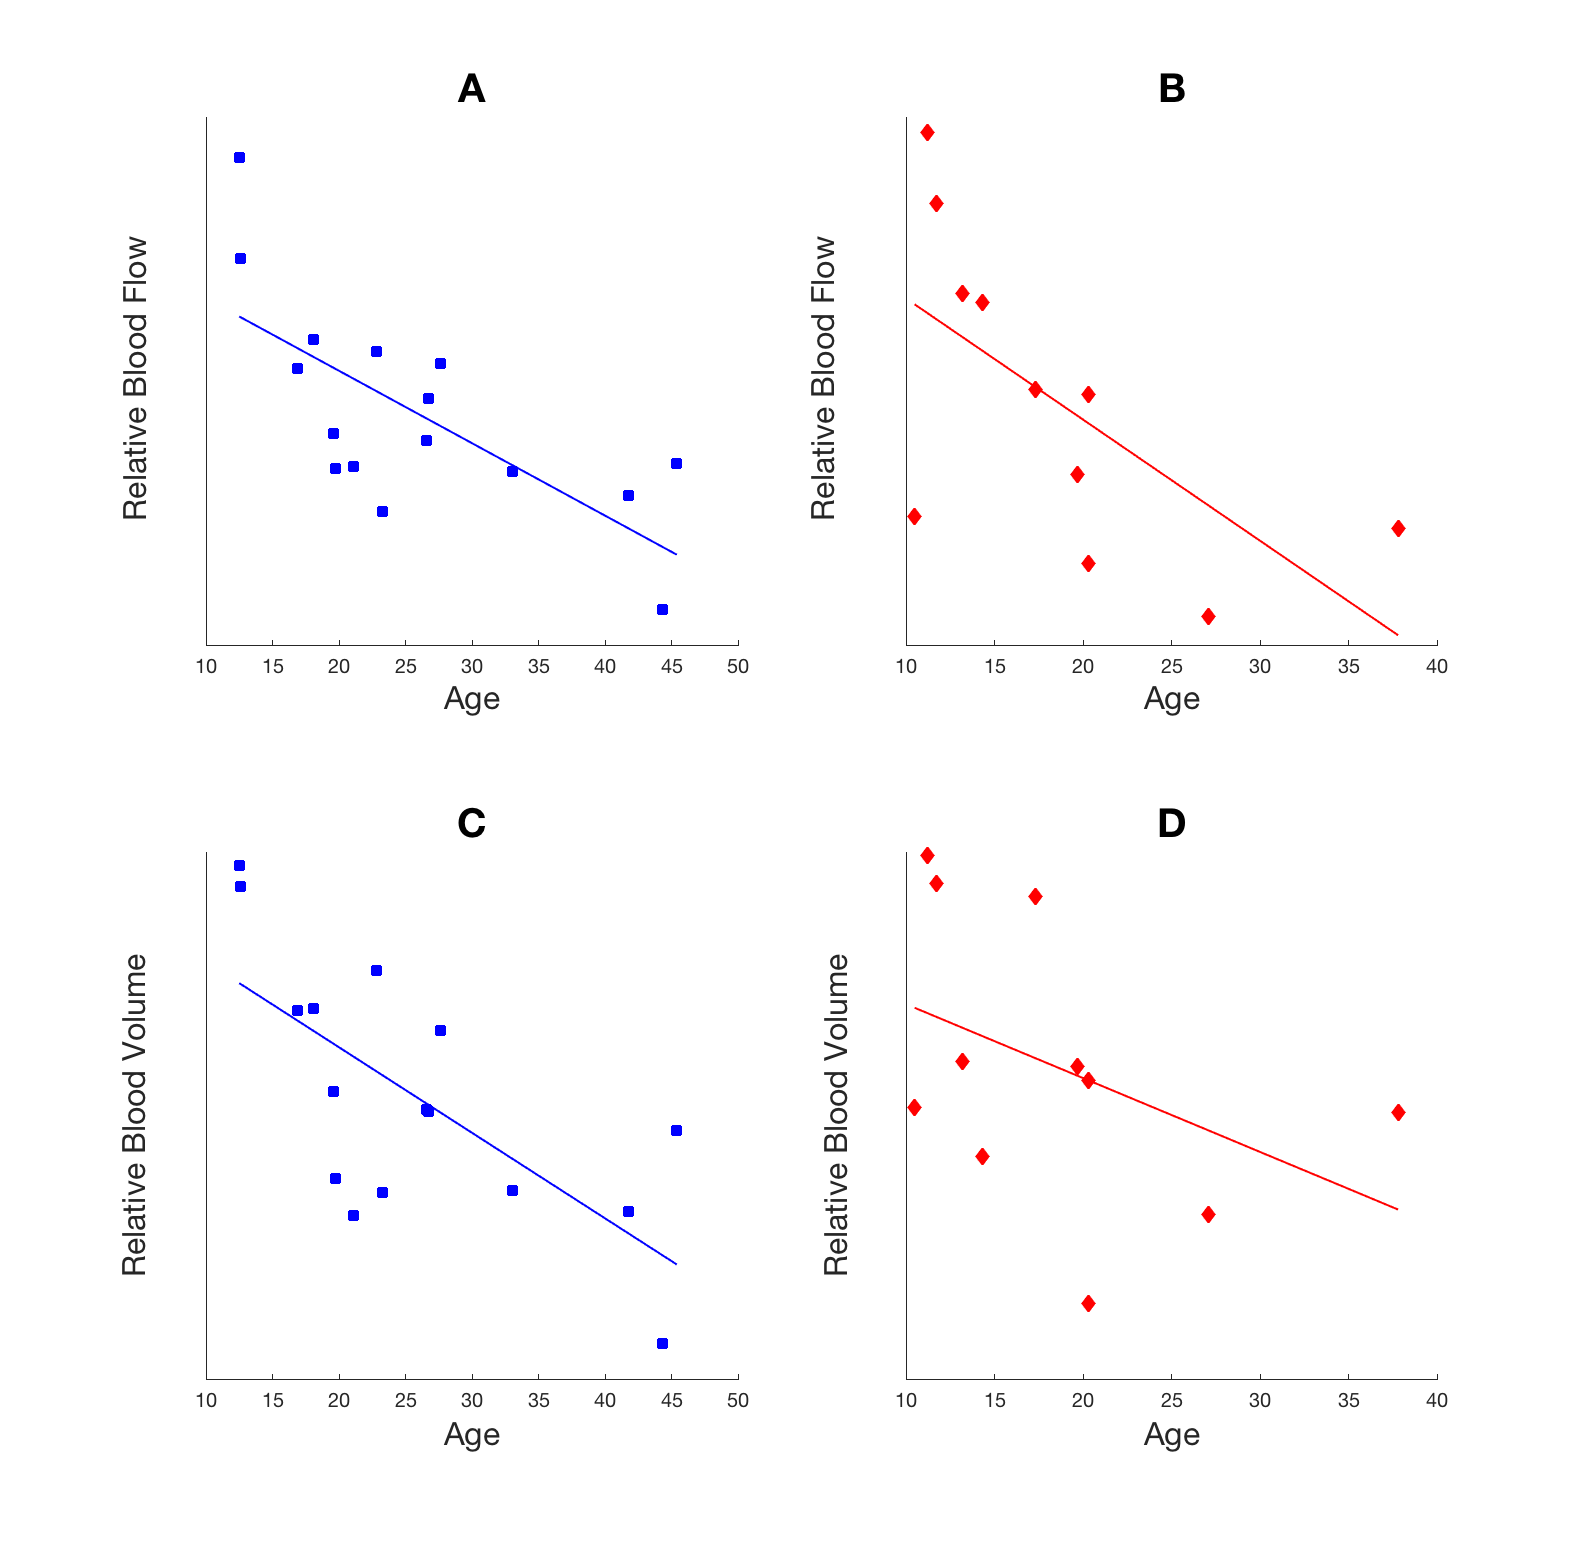
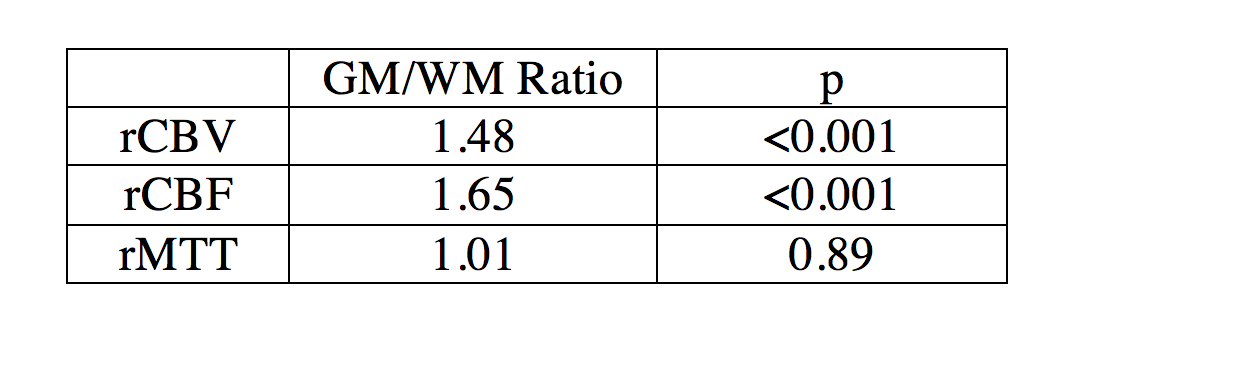
Pearson’s correlation was calculated for each group between PC flow and relative CBF (Figure 2). SCD patients showed positive linear correlation (r2=0.40 and p=0.038) while CTL subjects had positive but insignificant correlation (r2=0.15 and p=0.14). The age effect on relative CBF and CBV was tested (Figure 3) showing a decrease of both rCBF and CBV with age in both groups. The rCBV, rCBF and rMTT in grey matter was compared against values in white matter using a student’s t-test (Table 1). Grey matter had higher CBV (p<0.001) and CBF (p<0.001) than white matter but similar MTT (p=0.89).
Discussion
SCD and control subjects showed different linear models between PC and rCBF, possibly due to different physical values of proton densities and relaxivities in the BOLD signal equation. However, rCBF and rCBV measured by BOLD imaging decreased with age and grey matter had higher values than white matter as expected. Relative CBV, CBF GM/WM ratios are lower than literature values3,4 possibly due to subject motion and filtering of brain voxels that did not show desaturation, leading to lower SNR. Smoothing increases the SNR but worsens the partial volume effect, influencing tissue perfusion values.
Other studies have shown that extended periods of hypoxia lead to increased global blood flow5 but we assume that a very brief duration of desaturation does not cause a significant change. Additional flow experiments are needed to confirm whether fluctuating global CBF is a confounder in the BOLD signal.
Despite mirroring the DSC technique, the use of 100% nitrogen bolus as contrast instead of its nondiffusible gadolinium counterpart renders the adapted equations non-quantitative. Furthermore, the linear model is disease dependent, so estimation of perfusion values requires additional population model parameters. However, in clinical practice, this technique might prove useful since only relative measurements are needed in stroke localization. It could also be used in conjunction with CO2 inhalation to pair resting perfusion estimates with cerebrovascular reserve. The bolus could also be repeated to improve SNR. With further development, this technique may provide a safer and non-invasive alternative to high-resolution brain perfusion mapping using contrast agents.
Acknowledgements
This work was supported by the National Heart Lung and Blood Institute 1U01HL117718-01, the Minority Supplement to 1U01HL117718-0, the National Center for Research through the Clinical Translational Science Institute at Children's Hospital Los Angeles 5UL1 TR000130- 05, and Philips Healthcare through research support in kind.References
1. Shiroishi MS, Castellazzi G, Boxerman JL, D'Amore F, Essig M, Nguyen TB, Provenzale JM, Enterline DS, Anzalone N, Dörfler A, Rovira À, Wintermark M, Law M. Principles of T2*-weighted dynamic susceptibility contrast MRI technique in brain tumor imaging. J Magn Reson Imaging. 2015 Feb;41(2):296-313.
2. Tudorica A, Fang Li H, Hospod F, Delucia-Deranja E, Huang W, Patlak CS, Newman GC. Cerebral blood volume measurements by rapid contrast infusion and T2*-weighted echo planar MRI. Magn Reson Imaging. 2002 Jun:47(6);1145-57.
3. Wirestam R, Andersson L, Ostergaard L, Bolling M, Aunola JP, Lindgren A, Geijer B, Holtås S, Ståhlberg F. Assessment of regional cerebral blood flow by dynamic susceptibility contrast MRI using different convolution techniques. Magn Reson Imaging. 2000 May:43(5);691-700.
4. Rempp KA, Brix G, Wenz F, Becker CR, Gückel F, Lorenz WJ. Quantification of regional cerebral blood flow and volume with dynamic susceptibility contrast-enhanced MR imaging. Radiology. 1994 Dec:193(3);637-41.
5. Xu F, Liu P, Pascual JM, Xiao G, Lu H. Effect of hypoxia and hyperoxia on cerebral blood flow, blood oxygenation, and oxidative metabolism. J Cereb Blood Flow Metab. 2012 Oct:32(10);1909-18.
Figures