2289
Implementation and validation of delta relaxation enhanced MRI at 3T: A system for quadrupole enhanced relaxation imaging1Graz University of Technology, Graz, Austria, 2Università degli Studi di Milano, Milano, Italy, 3Università di Cagliari, Monserrato, Italy, 4University of Warmia and Mazury, Olsztyn, Poland
Synopsis
The frequency-selective nature of quadrupolar relaxation enhancement offers a high potential for designing smart molecular probes for the usage as novel MRI contrast agents by cycling the main magnetic field. Their validation and application requires a fast field-cycling MRI system. In this work, we present the first implementation and validation of such a system at the clinical field strength of 3T. The complete FFC-MRI setup was successfully validated by R1 dispersion imaging with dispersive iron oxide magnetic nanoparticles, thus providing a ready-to-use hardware setup for the future investigation of new compounds.
Introduction
Quadrupole Relaxation Enhancement (QRE)1 is a quantum mechanical effect, which has been suggested as mechanism for a new class of extrinsic MRI contrast agents2. The exploitation of QRE provides high potential for molecular imaging due to its sensitivity to the chemical environment and to the strength of an externally applied magnetic field. The latter property gives rise to the potential for switching on/off the contrast by B0 field-cycling. The validation and future application of QRE contrast agents requires the implementation of a dedicated MRI system capable of shifting the main magnetic field during an imaging sequence, namely fast field-cycling magnetic resonance imaging (FFC-MRI)3. This technique can be implemented on clinical MRI systems by means of a B0 insert coil and is also known as delta relaxation enhanced MR (dreMR) imaging and was previously implemented at clinical scanners with a nominal field strength of 1.5T4-6. Here, we present the first small animal FFC-MRI system at a clinical field strength of 3T and its validation by dreMR imaging of selected iron oxide magnetic nanoparticles.Methods
The FFC-MRI was implemented on a clinical 3T MRI scanner (Skyra, Siemens Healthineers, Germany) using a shielded B0 insert coil custom-built by Resonance Research Inc. (RRI, USA). The offset coil is driven by a gradient power amplifier (GPA) from International Electric Company (IECO, Finland) with a field efficiency of 0.668 mT/A. This allows for an offset field ∆B0 of up to ± 100mT with possible ramp times of 1ms.
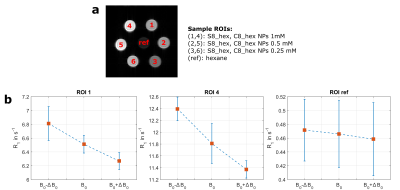
For system validation, previously published iron oxide magnetic nanoparticles (IOMNPs) dispersed in hexane and with different shapes (spherical and cubic) were selected as FFC-MRI contrast agent7 because of a suspected R1 dispersion at 3T. Samples containing three different concentrations (1mM, 0.5mM and 0.25 mM) for each shape and a non-dispersive reference sample (hexane only) were prepared (see figure 2a). Nuclear magnetic relaxation dispersion (NMRD) profiles were measured at room temperature (295K) to verify the R1 magnetic field dependence around the nominal B0 (2.89T) of our MRI system. The measurements were performed using a Spinmaster FFC 1T relaxometer (Stelar, Italy) and an external HTC-110 3T superconducting magnet equipped with a standalone PC-NMR console (Stelar, Italy) for 1H Larmor frequency range 10kHz-30MHz and 40Mhz-128MHz, respectively.
FFC-MRI images were acquired at three different field strengths (2.79T, 2.89T, 2.99T) using a modified saturation recovery spin echo sequence including B0 eddy current compensation8. After saturation preparation the B0 field was cycled to B0 ±100 mT within a rise time of 1ms for various evolution times Tevol (60, 100, 150, 300, 500, 800, 1500ms) to allow for relaxation at different field strengths prior image acquisition at the nominal field (TR/TE = 10000/15ms, matrix = 64x64, field of view = 40x40mm2, slice thickness = 5mm, bandwidth = 130Hz/Px). For each field strength, R1 was determined using a three parameter non-linear saturation recovery model in a region of interest (ROI) for each sample. Additionally, images at 2.79T and 2.99T with an isotropic in-plane resolution of 0.2x0.2mm2 were acquired with an evolution time of 150ms. The images were normalized to account for different equilibrium magnetizations and effective field-shifts6. The dreMR image was than obtained by magnitude subtraction of the normalized images.
Results and Discussion
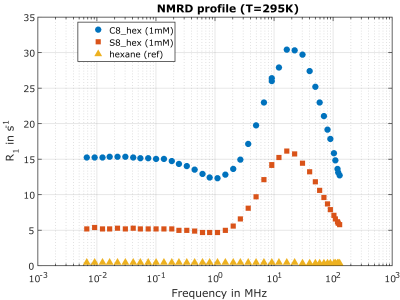
The iron oxide magnetic nanoparticles proved to be suitable for system validation at 3T as they have a pronounced peak in the NMRD profile around 20 MHz followed by a steep downward slope in the targeted frequency range, whereas the hexane reference shows weak magnetic field dependence (figure 1). The R1 values, measured with our FFC-MRI system at 2.79T, 2.89T and 2.99T, for the spherical (ROI 1, S8_hex, 1mM) and the cubic (ROI 4, C8_hex, 1mM) IOMNPs as well as the hexane reference sample are shown in figure 2. The cubic shaped IOMNPs show a higher relaxation dispersion (∆R1/∆B0) with respect to the spherical shaped IOMNPs. As expected, a weak dispersion for the reference sample can be observed. These values are in good agreement with the NMRD profiles measured with the FFC relaxometer. The dreMR image (figure 3) exhibits significant signal from the dispersive samples containing the iron oxide magnetic nanoparticles, whereas the hexane reference shows no significant signal above the noise level.Conclusion
Our implementation of a small animal FFC-MRI system allows for the investigation of dispersive properties of contrast agents. In particular, we have successfully demonstrated proof-of-concept dreMR imaging based on the NMRD profile of iron oxide magnetic nanoparticles at a clinical field strength of 3T. This implementation and validation gives us a ready-to-use hardware setup for the investigation of prospective QRE compounds.Acknowledgements
This project receives financial support by the
European Commission in the frame of the H2020 Programme (FET-open) under grant
agreement 665172.
This article is partially based upon work from COST Action CA15209, supported
by COST (European
Cooperation in Science and Technology).
References
[1] Kruk D, Kubica A, Masierak W, et al., Quadrupole relaxation enhancement—application to molecular crystals, Solid State
Nuclear Magnetic Resonance, 40 (2011) 114-120, ISSN 0926-2040
[2] Gösweiner C, Kruk D, Westlund PO, et al., Extrinsic
MRI contrast agents based on nuclear quadrupole enhanced relaxation:
Principle, requirements and characterization of promising compounds, Proc. Intl. Soc. Mag. Reson. Med 25 (2017)
[3] Lurie DJ, Aime S, Baroni S, et al., Fast field-cycling magnetic resonance imaging,Comptes
Rendus Phys., Bd. 11, Nr. 2, S. 136–148, (2010)
[4] Alford
JK, Rutt BK, Scholl TJ, et al., Delta Relaxation Enhanced MR: Improving Activation-Specificity of Molecular Probes through R1 Dispersion Imaging, Magn. Reson. Med.
(2009); 61(4):796-802
[5]
Lee ESM, de Rochefort L, Ferrante G, Rutt BK, Next Generation Delta Relaxation Enhanced MRI with ±0.36T ΔB, Proc. Intl. Soc. Mag. Reson. Med 20 (2012)
[6]
Hoelscher UC, Lother S, Fidler F, Blaimer M, Jakob PM, Quantification and localization of contrast agents using delta relaxation enhanced magnetic resonance at 1.5 T, Magn. Reson. Mater. Phy. (2012); 25:223-231
[7]
Basini M, Orlando T, Arosio P, et al., Local spin dynamics of iron oxide magnetic nanoparticles dispersed in different solvents with variable size and shape: A 1H NMR study, J.
Chem. Phys. (2017); 147: 034703
[8] Hoelscher UC, Jakob PM, Eddy current compensation for delta relaxation enhancedMR by dynamic reference phase modulation, Magn. Reson. Mater. Phy. (2013); 26:249-259
Figures


