2288
Quantitative MRI made easy with qMRLab1NeuroPoly Lab, Polytechnique Montreal, Montreal, QC, Canada, 2Montreal Neurological Institute, McGill University, Montreal, QC, Canada, 3Centre Hospitalier de l’Université de Montréal, Montreal, QC, Canada, 4Functional Neuroimaging Unit, CRIUGM, Université de Montréal, Montreal, QC, Canada, 5Montreal Heart Institute, Montreal, QC, Canada
Synopsis
Quantitative MR (qMR) methods exist for most MRI sequences (e.g. diffusion, magnetization transfer, inversion recovery). All these methods have a similar methodology: a biophysical model (i.e. an analytical equation), that relates the MRI contrast to some microstructural and physical features, is used to fit experimental data. Although open-source software packages are available online for certain qMR techniques, there does not exist a single stand-alone platform that can implement and compare a wide range of quantitative MRI methods. With qMRLab, we propose an open-source, MATLAB-based, object-oriented software with separate modules for each technique. We envision qMRLab as a standard platform with a growing list of contributors, where the qMR community can replicate and cross-validate a wide range of qMR methods. qMRLab includes a user-friendly graphical user interface (GUI), batch scripts examples, and
Purpose
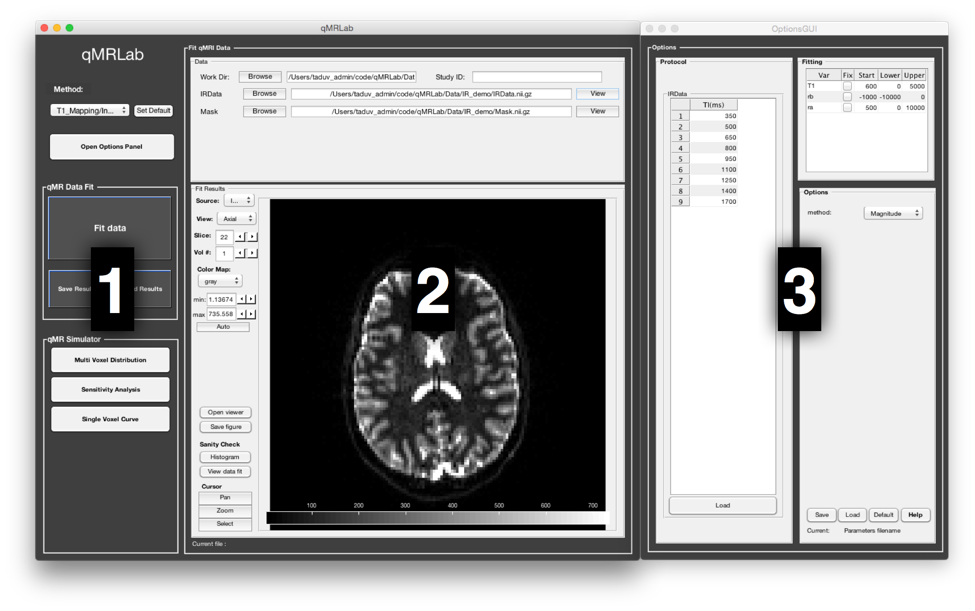
Quantitative MR (qMR) methods exist for most MRI sequences (e.g. diffusion, magnetization transfer, inversion recovery). All these methods have a similar methodology: a biophysical model (i.e. an analytical equation), that relates the MRI contrast to some microstructural and physical features, is used to fit experimental data. Although open-source software packages are available online for certain qMR techniques, there does not exist a single stand-alone platform that can implement and compare a wide range of quantitative MRI methods. With qMRLab, we propose an open-source, MATLAB-based, object-oriented software with separate modules for each technique. We envision qMRLab as a standard platform with a growing list of contributors, where the qMR community can replicate and cross-validate a wide range of qMR methods. qMRLab includes a user-friendly graphical user interface (GUI) (Fig. 1), batch scripts examples, and qMR datasets. The software can be used to fit and check the quality of qMR data, to optimize protocols, compare fitting models, and simulate the effects of various model assumptions.Methods
qMRLab architecture. Each qMR method is modularized as a Matlab class that contains: the protocol parameters, the fitting options, and model options. The class also contains the following methods: 1) ‘equation’, to analytically generate qMR data; 2) ‘fit’, to fit the experimental data using an analytical equation (Fig. 2); 3) ‘plotModel’, to plot the fitting curves; 4) ‘plotProt’, to display the protocol (e.g. b-space in diffusion); and 5) ‘Sim_***’, to perform various simulations (see next section). The function ‘qMRusage’ provides usage examples for each method and can help guide users who would like to implement scripts or pipelines. A class object can easily be loaded within the GUI for reproducibility and for sharing across centers.
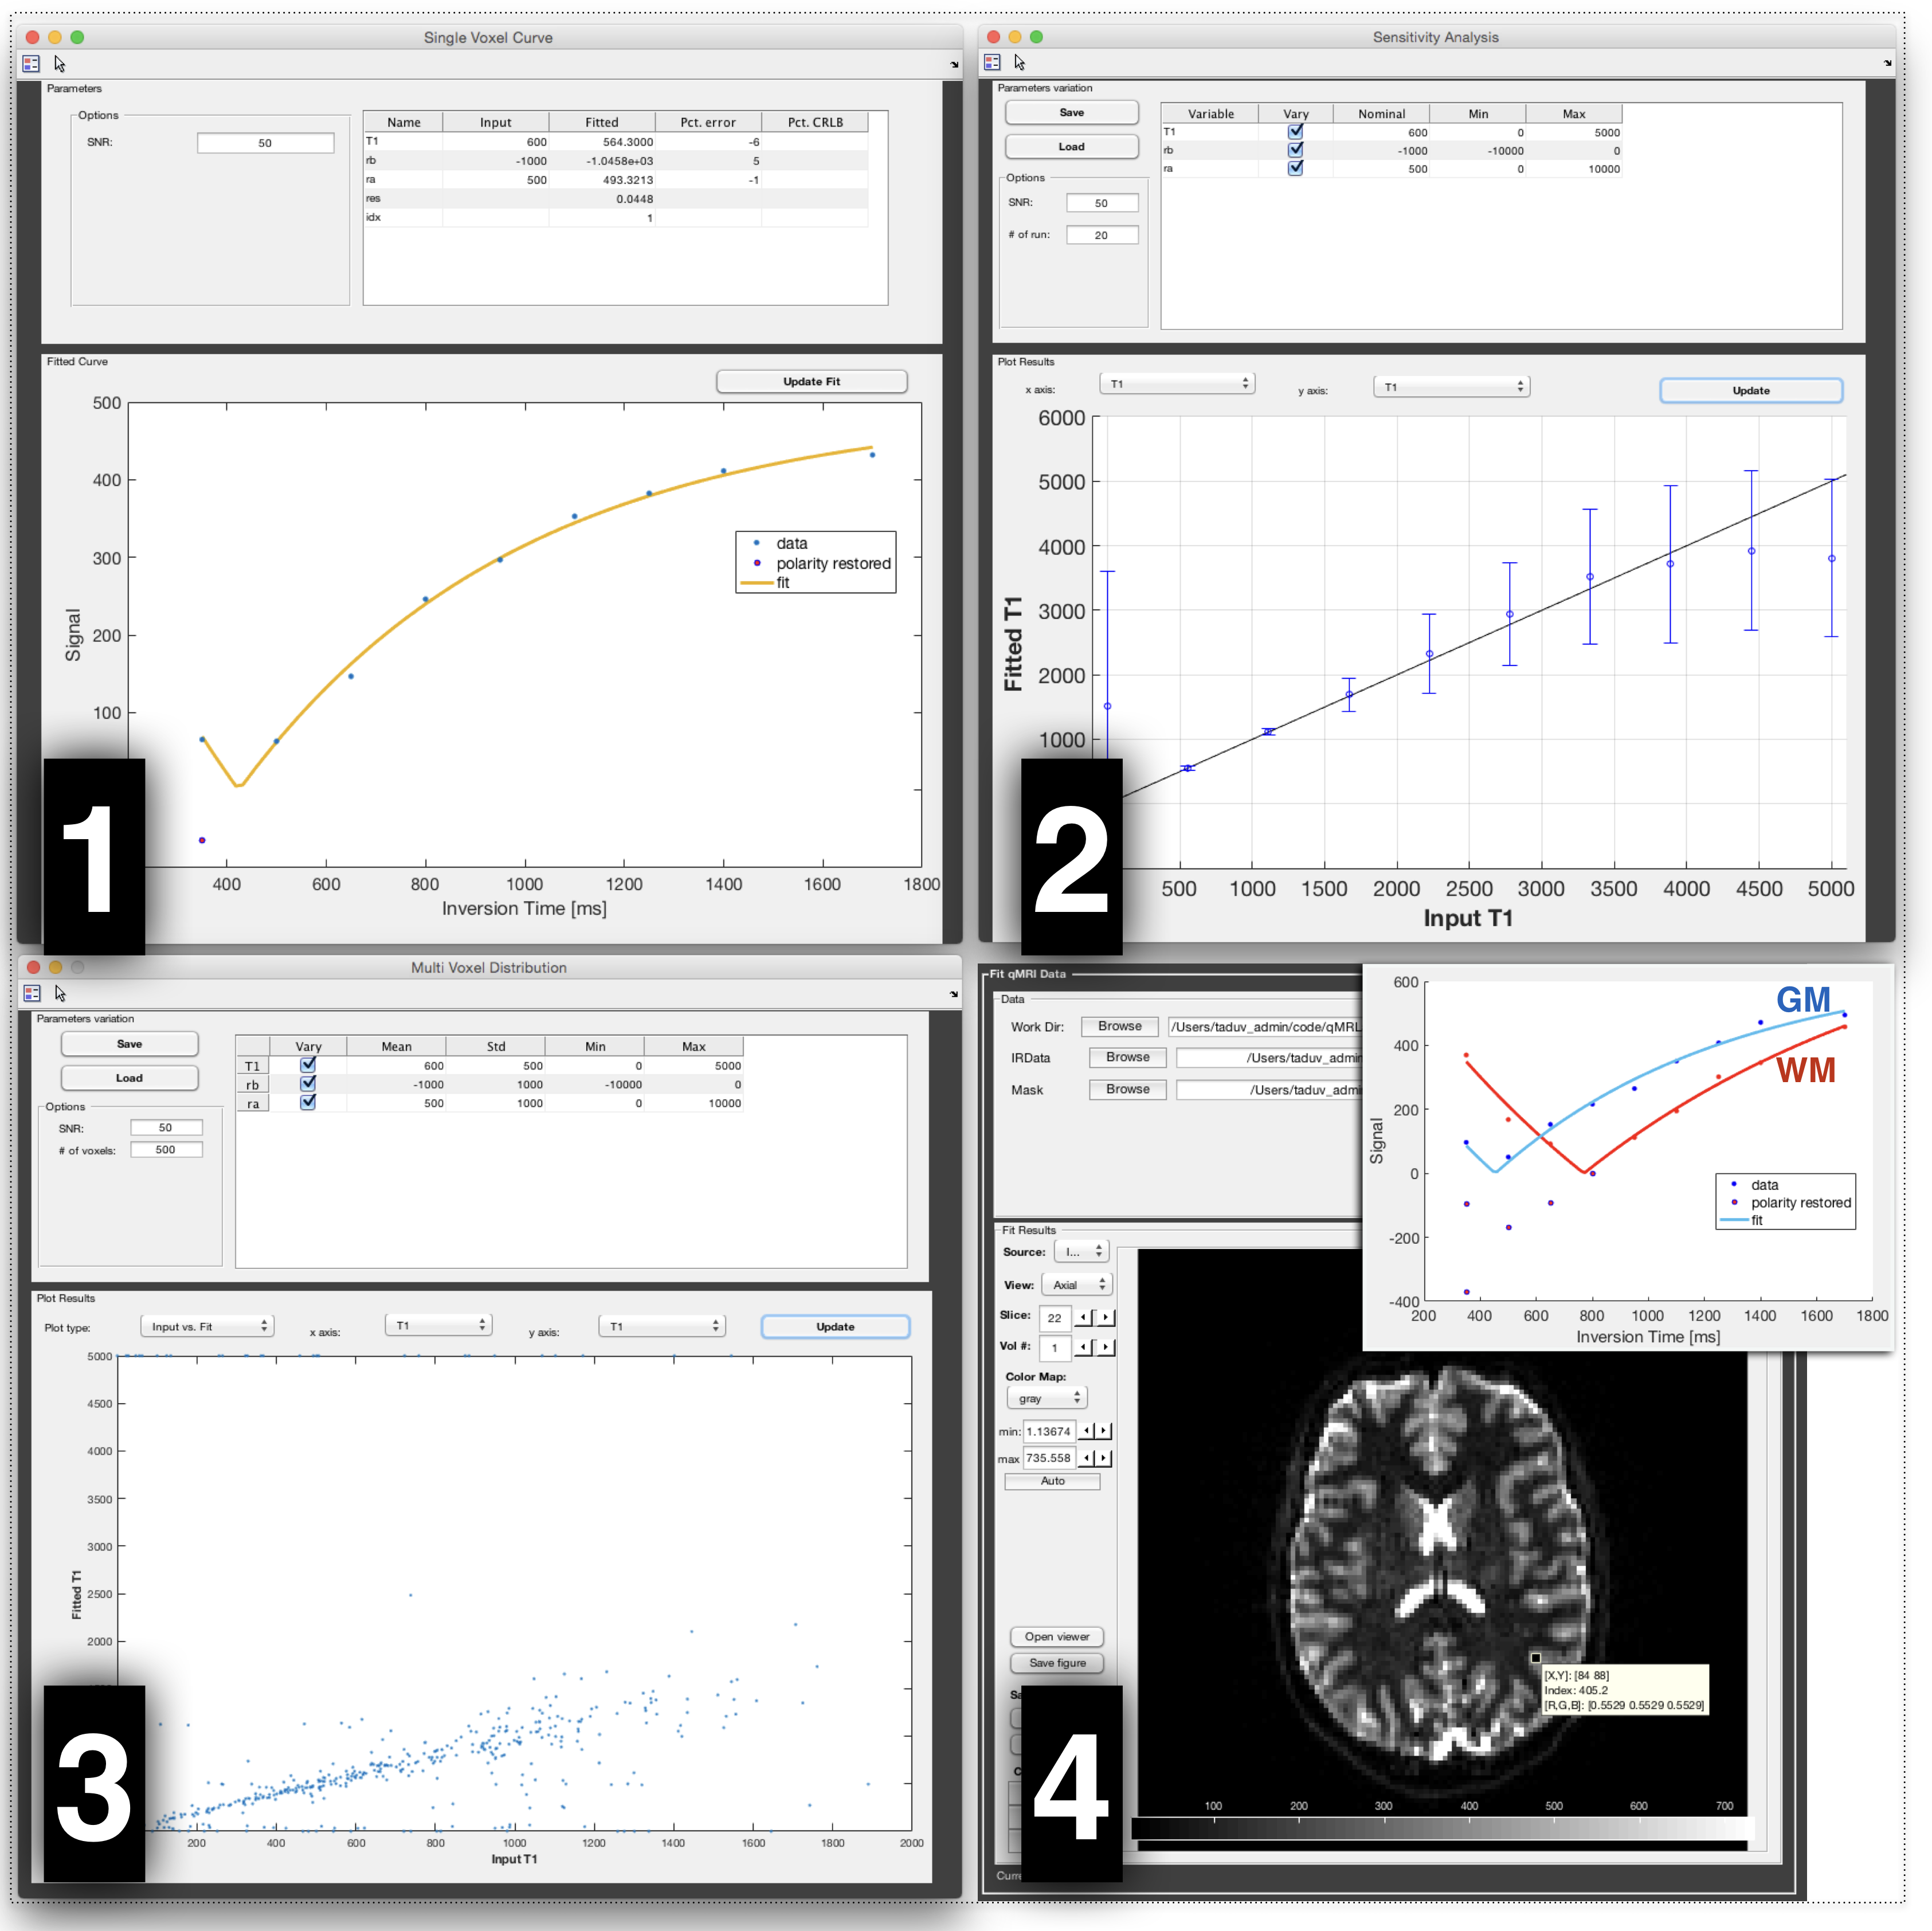
Simulations. Several simulation modules are included in qMRLab (folder ‘Addons’) (see figure 3): 1) “Single Voxel Curve”, to generate noisy (Rician noise) synthetic MR signals and fit the simulated data, 2) “Sensitivity Analysis”, to estimate the precision of fitted parameters for a particular SNR, and for different value of one parameter (all other parameters fixed), 3) “Multi-voxel Distribution”, to estimate the precision of fitted parameters for a wide range of parameter combinations, 4) “Protocol Optimization”, to produce an optimized protocol using the Cramér-Rao Lower Bound (CRLB) as an objective function, and SOMA all-to-one as an optimizer (Zelinka 2004; Alexander 2008). Note that modules 2 and 3 above depend on module 1. An example application of module 2 to test the effects of model assumptions can be found in (Duval et al. 2017, Fig. S2).
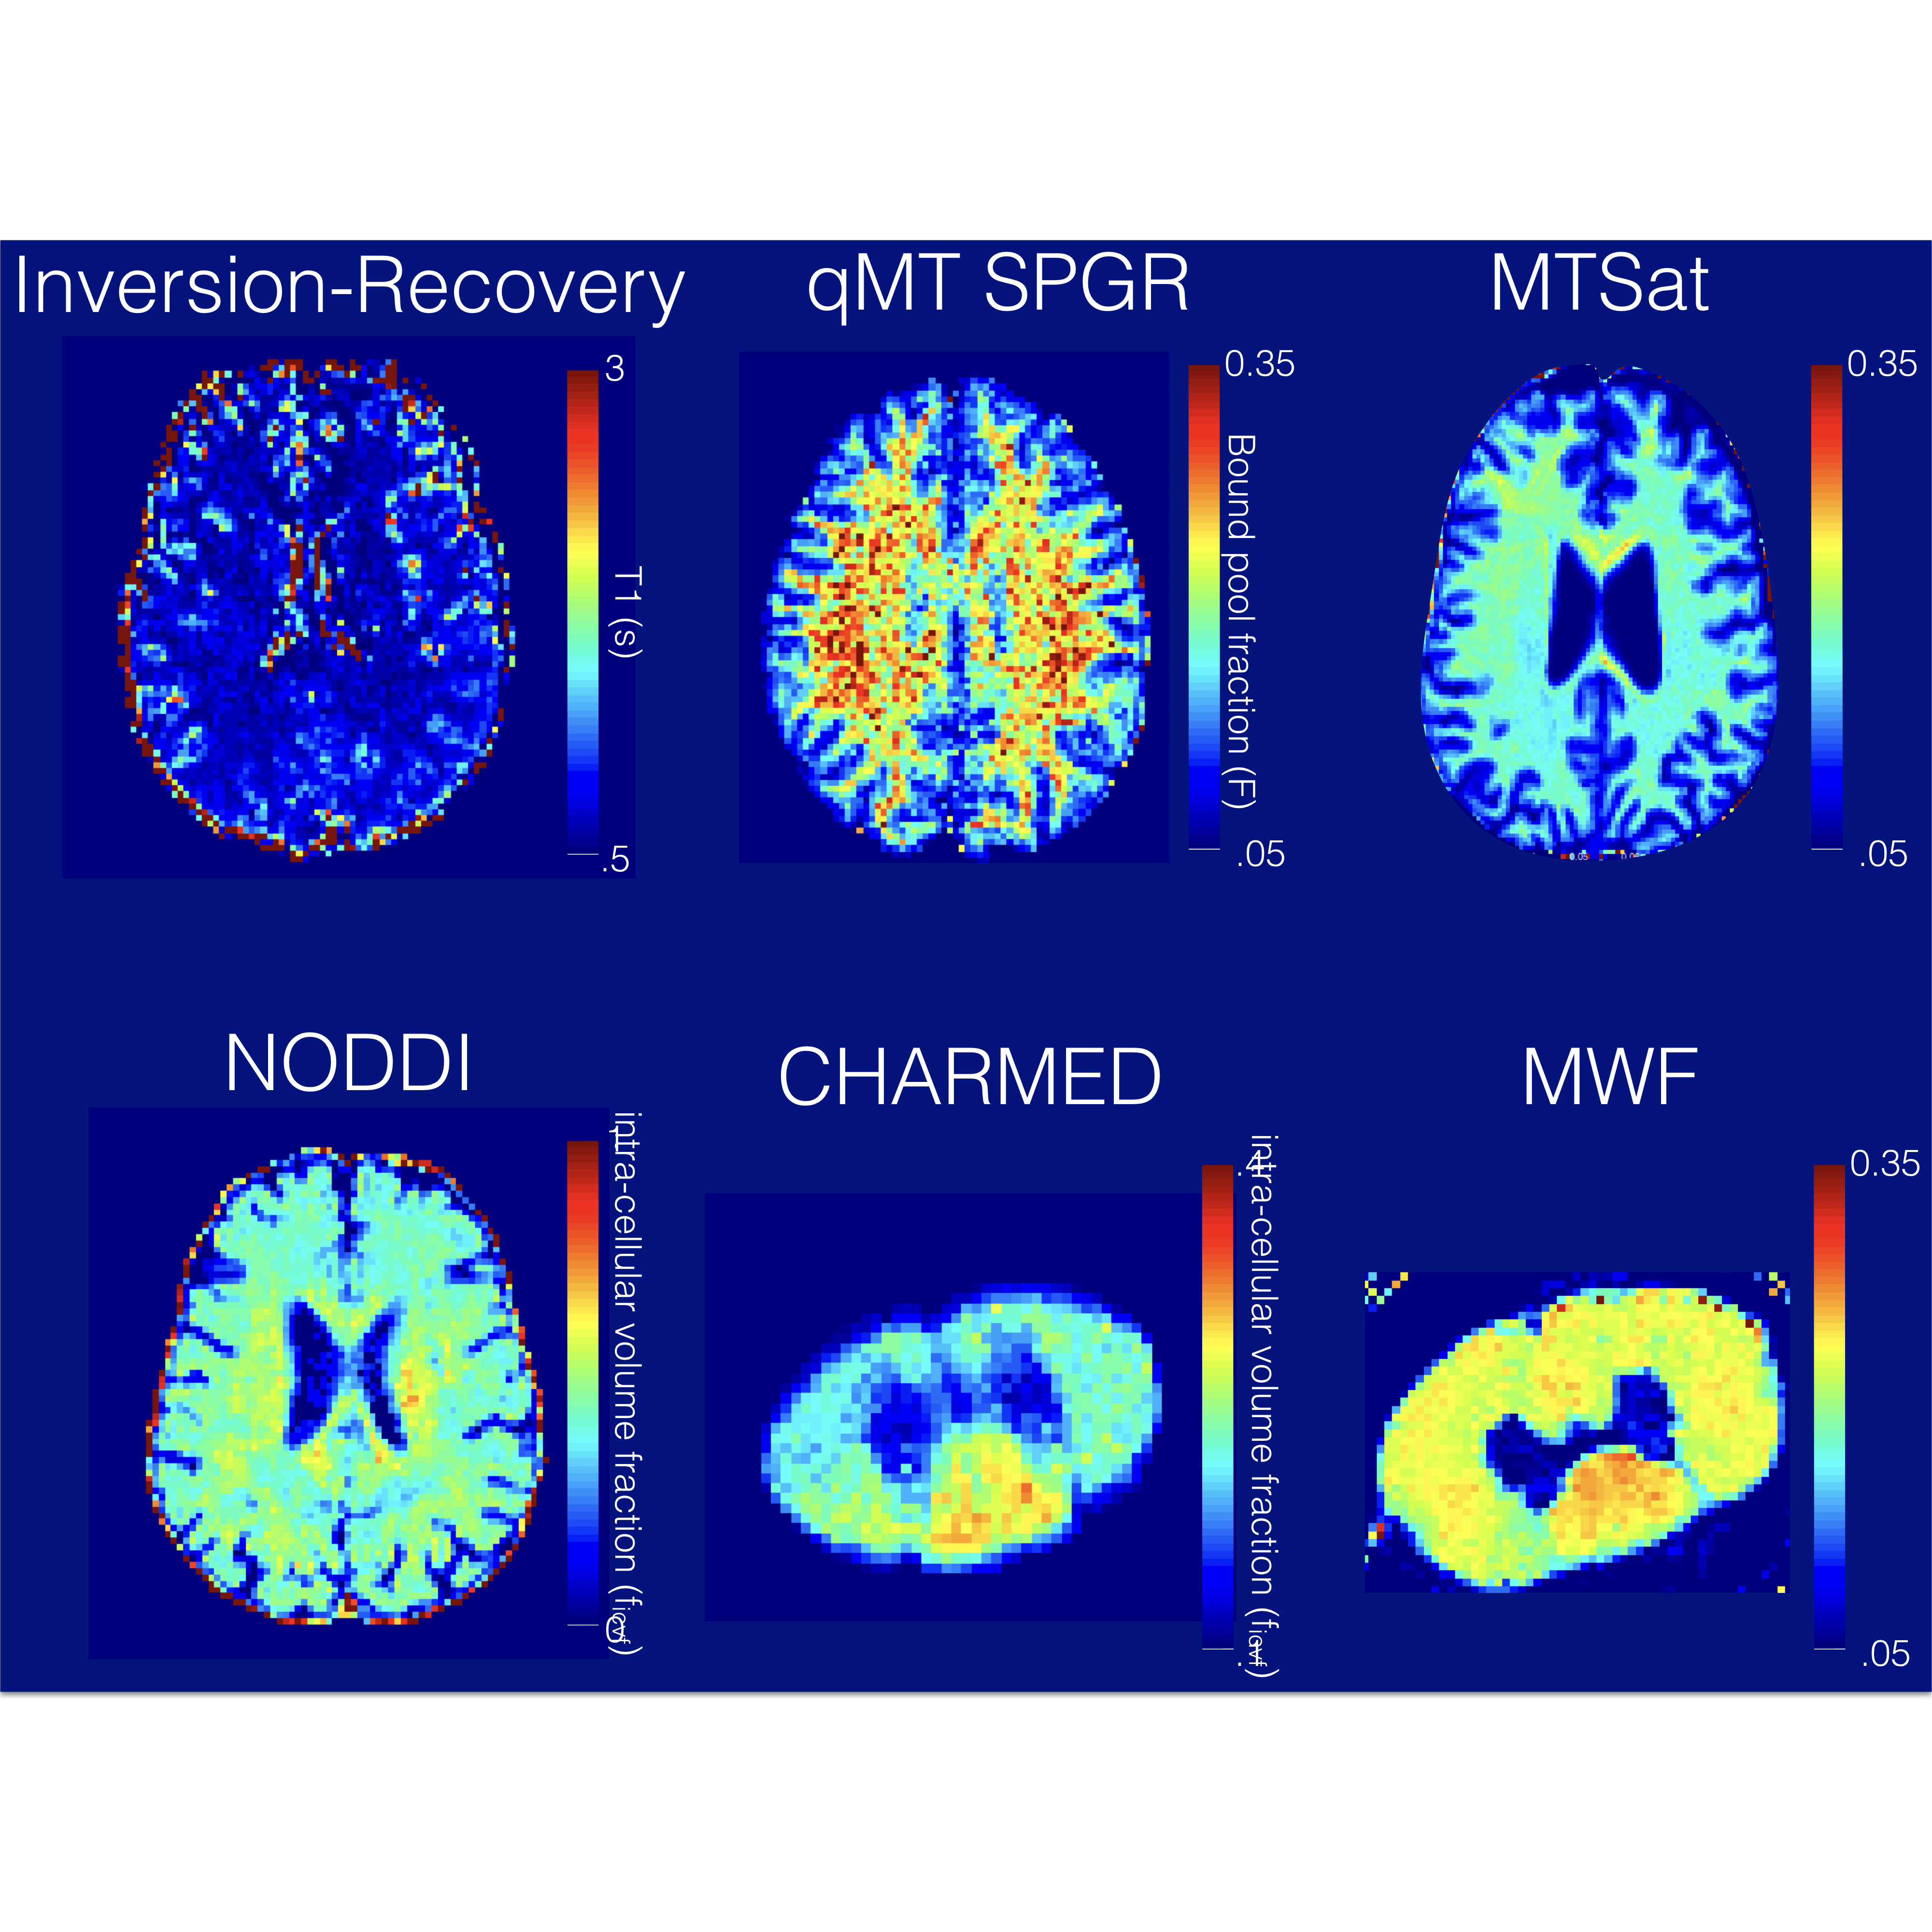
Modalities. Currently, qMRLab includes AxCaliber (Assaf et al. 2008; Fieremans et al. 2016; Ning et al. 2016) and NODDI (Zhang et al., 2012) for diffusion MRI; Myelin Water Fraction (MWF) (MacKay et al., 1994) , MTSat (Helms et al., 2008), quantitative Magnetization Transfer (qMT) (Bieri and Scheffler, 2007; Gochberg et al., 1999; Sled and Pike, 2000) for myelin/macromolecular content imaging, Variable Flip Angle (Fram et al., 1987) and Inversion Recovery (Barral et al., 2010) for T1 mapping, B0/B1 field mapping (Insko and Bolinger, 1993; Maier et al., 2015; Schofield and Zhu, 2003).
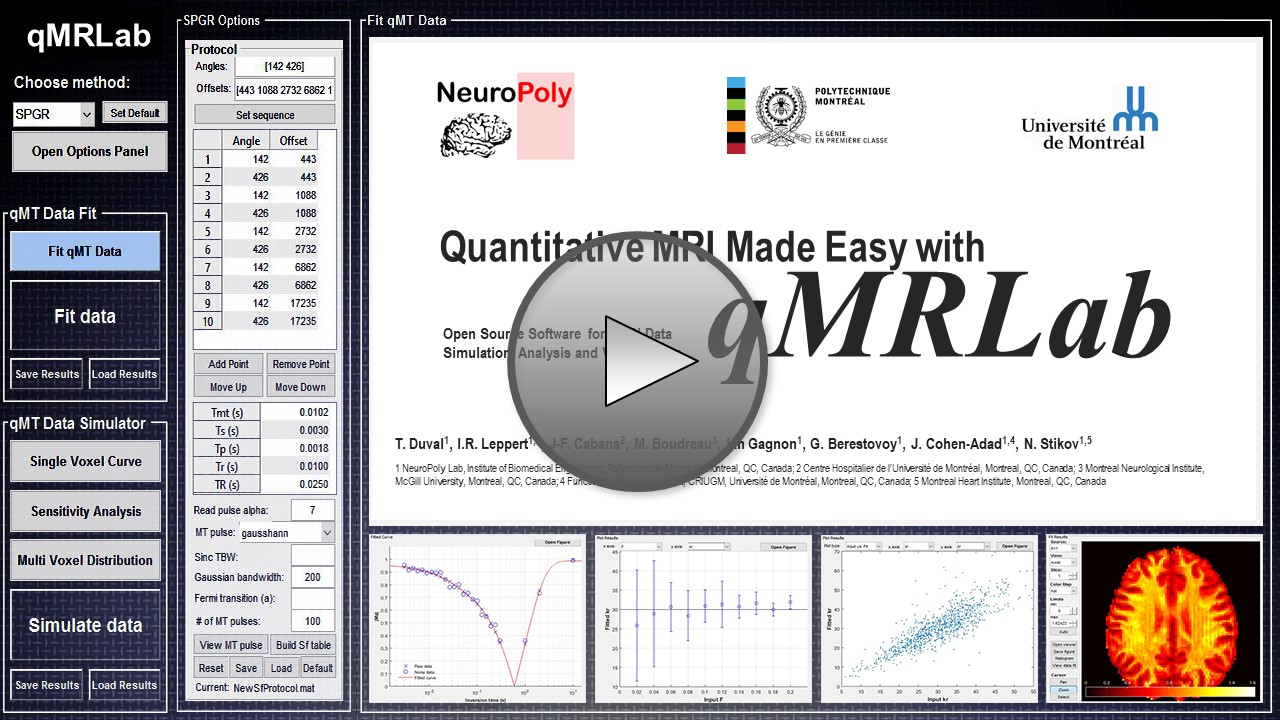
Continuous integration. qMRLab uses Travis (travis-ci.org) to run automated tests at each update. All models are tested for consistent results across versions and accurate fitting (using the single voxel curve simulation). Automatically generated documentation (based on class definition headers, and batch examples), as well as a video introduction to the basics of qMRLab are available online (http://qmrlab.readthedocs.io/) (fig. 4)
Conclusion
The field of quantitative MRI is in dire need of standardization, and we believe qMRLab is an important step in this direction, providing a unified platform that researchers can use to fit their qMR data, simulate signals, and add customizable modules to fulfill the needs of the community. Currently, most labs use in-house code that is difficult to distribute and qMR studies are difficult to reproduce. By providing an open-source software package, coupled with a simple and easy-to-use graphical interface, we also hope to make these techniques accessible to a wider audience, and to help their translation into the clinic.
qMRLab can be downloaded for free at: https://github.com/neuropoly/qMRLab/
Acknowledgements
Study funded by MS Society of Canada, Canada Research Chair, CIHR, FRQS, FRQNT, QBIN and NSERC.References
Alexander, D.C., 2008. A general framework for experiment design in diffusion MRI and its application in measuring direct tissue-microstructure features. Magn. Reson. Med. 60, 439–448.
Assaf, Y., Blumenfeld-Katzir, T., Yovel, Y., Basser, P.J., 2008. AxCaliber: a method for measuring axon diameter distribution from diffusion MRI. Magn. Reson. Med. 59, 1347–1354.
Barral, J.K., Gudmundson, E., Stikov, N., Etezadi-Amoli, M., Stoica, P., Nishimura, D.G., 2010. A robust methodology for in vivo T1 mapping. Magn. Reson. Med. 64, 1057–1067.
Bieri, O., Scheffler, K., 2007. Optimized balanced steady-state free precession magnetization transfer imaging. Magn. Reson. Med. 58, 511–518.
Duval, T., Smith, V., Stikov, N., Klawiter, E.C., Cohen-Adad, J., 2017. Scan-rescan of axcaliber, macromolecular tissue volume, and g-ratio in the spinal cord. Magn. Reson. Med. doi:10.1002/mrm.26945
Fieremans, E., Burcaw, L.M., Lee, H.-H., Lemberskiy, G., Veraart, J., Novikov, D.S., 2016. In vivo observation and biophysical interpretation of time-dependent diffusion in human white matter. Neuroimage 129, 414–427.
Fram, E.K., Herfkens, R.J., Johnson, G.A., Glover, G.H., Karis, J.P., Shimakawa, A., Perkins, T.G., Pelc, N.J., 1987. Rapid calculation of T1 using variable flip angle gradient refocused imaging. Magn. Reson. Imaging 5, 201–208.
Gochberg, D.F., Kennan, R.P., Robson, M.D., Gore, J.C., 1999. Quantitative imaging of magnetization transfer using multiple selective pulses. Magn. Reson. Med. 41, 1065–1072.
Helms, G., Dathe, H., Kallenberg, K., Dechent, P., 2008. High-resolution maps of magnetization transfer with inherent correction for RF inhomogeneity and T1 relaxation obtained from 3D FLASH MRI. Magn. Reson. Med. 60, 1396–1407.
Insko, E.K., Bolinger, L., 1993. Mapping of the Radiofrequency Field. J. Magn. Reson. A 103, 82–85.MacKay, A., Whittall, K., Adler, J., Li, D., Paty, D., Graeb, D., 1994. In vivo visualization of myelin water in brain by magnetic resonance. Magn. Reson. Med. 31, 673–677.
Maier, F., Fuentes, D., Weinberg, J.S., Hazle, J.D., Stafford, R.J., 2015. Robust phase unwrapping for MR temperature imaging using a magnitude-sorted list, multi-clustering algorithm. Magn. Reson. Med. 73, 1662–1668.
Ning, L., Setsompop, K., Westin, C.-F., Rathi, Y., 2016. New insights about time-varying diffusivity and its estimation from diffusion MRI. Magn. Reson. Med. doi:10.1002/mrm.26403
Ramani, A., Dalton, C., Miller, D.H., Tofts, P.S., Barker, G.J., 2002. Precise estimate of fundamental in-vivo MT parameters in human brain in clinically feasible times. Magn. Reson. Imaging 20, 721–731.
Schofield, M.A., Zhu, Y., 2003. Fast phase unwrapping algorithm for interferometric applications. Opt. Lett. 28, 1194–1196.Sled, J.G., Pike, G.B., 2001. Quantitative imaging of magnetization transfer exchange and relaxation properties in vivo using MRI. Magn. Reson. Med. 46, 923–931.
Yarnykh, V.L., 2012. Fast macromolecular proton fraction mapping from a single off-resonance magnetization transfer measurement. Magn. Reson. Med. 68, 166–178.
Zelinka, I., 2004. SOMA — Self-Organizing Migrating Algorithm, in: New Optimization Techniques in Engineering, Studies in Fuzziness and Soft Computing. Springer Berlin Heidelberg, pp. 167–217.
Zhang, H., Schneider, T., Wheeler-Kingshott, C.A., Alexander, D.C., 2012. NODDI: practical in vivo neurite orientation dispersion and density imaging of the human brain. Neuroimage 61, 1000–1016.
Figures