2284
High Resolution Low Field MR Elastography1Bioengineering, University of the Pacific, Stockton, CA, United States
Synopsis
In this study, we extend MRE to a low field strength of 0.5T that offers in-plane resolution of 150 micron x 150 micron. To verify the method, shear wave images through gel phantoms were obtained at a mechanical excitation frequency of 370Hz. Preliminary studies on rat brains demonstrate the feasibility of the using low filed MRE in determining mechanical properties.
Introduction
Magnetic Resonance Elastography is a technique that can be used to determine the mechanical properties of samples by analyzing the visual and temporal strains caused by the propagation of mechanical shear waves1. These shear waves are produced by coupling a piezoelectric actuator with our sample at a specific frequency. The temporal pattern of shear waves can be reconstructed to the stiffness map using an inverse algorithm2. We have extended MRE to the microscopic scale using high field systems2. In this work, we extend to MRE to the microscopic scale using a low field benchtop MRI system.Methods
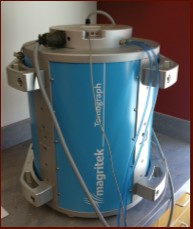
An agarose gel phantom of two different stiffnesses (0.5% and 1%) was subjected to localized shear waves by a piezoelectric actuator (Piezo systems, MA). The actuator was attached to a 3D printed holder and mechanically coupled with the gel phantom via a thin needle to reduce any susceptibility artifacts. Laser Doppler Vibrometry was used to determine the frequency response of the actuator and the resonance frequency was found to be 370Hz. The experiments were conducted at 21 MHz in a 45-cm vertical bore magnet (Magritek, Aachen, Germany) with a magnetic field strength of 0.5 T. A five-cm RF solenoid coil with triple axis gradients was used to acquire the images. A phase contrast spin-echo based pulse sequence was modified to include a variable number of bipolar pulse gradients.The raw data was acquired by Prospa (Magritek, Aachen, Germany) software and analyzed by using Matlab.Results
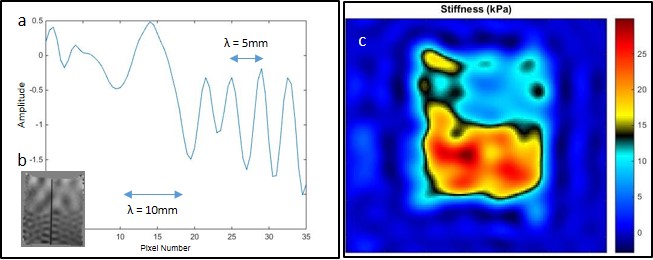
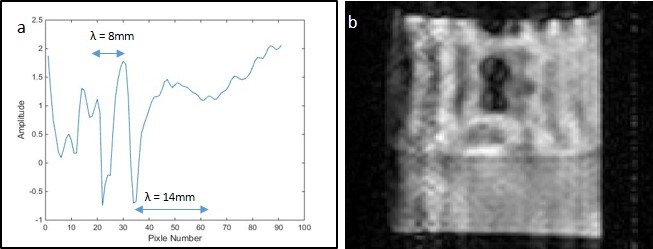
Fig. 2 shows a shear wave image of a gel phantom of two stiffnesses, its vertical line profile showing two wavelengths corresponding to the two materials. Fig.2 (c) shows the stiffness map reconstructed from the propagation of the shear waves. Fig. 3 shows preliminary results of a vertical line profile of a shear wave going through a rat brain that is immersed in agarose gel with the corresponding shear wave image of the brain in agarose gel.
Discussion and Conclusion
In this preliminary study, we extended MRE to a low field (0.5 T) system and the data illustrates the feasibility of MRE with this system. Additionally, a longer acquisition time is needed for a good phase- to-noise ratio image and therefore, this system is better suited for applications where longer acquisition time is not a burden on the specimen. For example, the system can be coupled with a bioreactor to continuously assess the evolution of tissue-engineered constructs. Future work with the system includes monitoring the stiffness evolution of tissue-engineered bone constructs developed in an MRI compatible incubator.Acknowledgements
The author would like to thank Dr. Roshanak Rahimian for providing rat brain samples and Mr. Jeremy Hanlon and Miss Delia Davila for their help with designing the sample holder. The author would also like to thank Dr. Vahid Khalilzad for his input on developing the MRE system.References
1. Muthupillai, R. & Ehman, R. L. Magnetic resonance elastography. Nat. Med. 1996; 36(2), 226-74..
2. Boulet, T., Kelso, M. L. & Othman, S. F. Microscopic magnetic resonance elastography of traumatic brain injury model. J. Neurosci. Methods 201, 296–306 (2011).
3. Othman, S. F., Xu, H., Royston, T. J. & Magin, R. L. Microscopic magnetic resonance elastography (μMRE). Magn. Reson. Med. 54, 605–615 (2005).
Figures