2281
Dynamic Contrast Enhanced DWI in a split dynamic framework1Diagnostic Physics,KRN, Oslo Universityhospital, Oslo, Norway, 2Department of Radiology, Akershus University Hospital, Lørenskog, Norway, 3Sunnmøre MR-klinikk, Ålesund, Norway, 4Department of Oncology, Akershus University Hospital, Lørenskog, Norway, 5Faculty of Medicine, University of Oslo, Olso, Norway, 6Department of Physics, NTNU, Trondheim, Norway
Synopsis
Most MRI contrast agents distributes extracellular only. If the extracellular water signal is suppressed by diffusion weighting the short ranged T1-relaxation effect of a the contrast agent will be solely through water exchange through the cell membrane. In this paper we describe the implementation of a dynamic contrast enhanced diffusion weighted acquisition facilitating the study of diffusion weighting on the relaxivity of contrast agents. This is all done within a Split Dynamic framework allowing for this study to be performed without sacrificing assessment of the established pharmacokinetic parameters.
Introduction
The Split Dynamic technique has shown promising results in breast cancer (1,2), allowing for interleaved acquisitions of high temporal resolution and high spatial resolution images following a single bolus. In breast imaging the need of high spatial resolution is well established as morphology is an important diagnostic criterium. The same technique has recently also been applied in rectal cancer imaging (3) where it has shown potential to assess tumor aggressiveness. In this setting the high spatial resolution images does not have a proven diagnostic value and may be unnecessary.
The Split Dynamic technique then offers an opportunity to explore the value of other sequences in dynamic contrast enhanced imaging. Sequences probing water motion may be worth exploring as water transport or diffusion affect the in vivo relaxivity of the administered contrast (4).
We report here on the implementation of, and preliminary experience with dynamic T1-Weighted Diffusion Weighted (T1W-DWI) in a Split Dynamic framework.
Materials and Methods
The investigation was performed within an ongoing biomarker study approved by the Institutional Review Board and the Regional Committee for Medical and Health Research Ethics. The study was performed in accordance with the Helsinki declaration. Written informed consent was obtained for all patients prior to participation.
The Split Dynamic protocol described by Grøvik et al (3) was modified by removing the high resolution 3D-THRIVE acquisition and replacing it by three dynamic single shot diffusion weighted echo planar imaging (DWI EPI) sequences while keeping the timing of the high temporal resolution acquisition unchanged.
Reliable T1-weighting was achieved by applying a WET saturation pulse (5,6) followed by delays (Tsat) of 300, 600 and 3000 ms respectively. Corresponding repetition times were 425, 725 and 3125 ms and number of dynamic acquisitions were 13, 13 and 10 respectively of which 5, 5 and 3 frames were acquired precontrast. Echo time was 53 ms, aquisition matrix 66 x 64, field of view 240 x 240 mm and pixel bandwidth 2434 Hz. For each saturation time b-values of 0, 100, 400 and 800 s/mm2 were measured in phase, frequency and slice-direction with number of samples 1. Trace images were calculated by the vendor software.
The imaging protocol was otherwise as described in (3).
A dose of 0.2mL/kg body weight of gadolinium-based CA (Dotarem® 279.3mg/mL, Guerbet, Roissy, France) was injected as a bolus (3mL/s) directly followed by 20ml of physiologic saline solution.
Image analysis was performed using IDL (Exelis Visual Information Solutions, Inc, Boulder Colorado, United States). The current preliminary analysis was based on trace images only. Pre- and post-contrast images were summarized and T1 was calculated pixel by pixel by fitting
$$S=A(1-exp(-Tsat/T1))
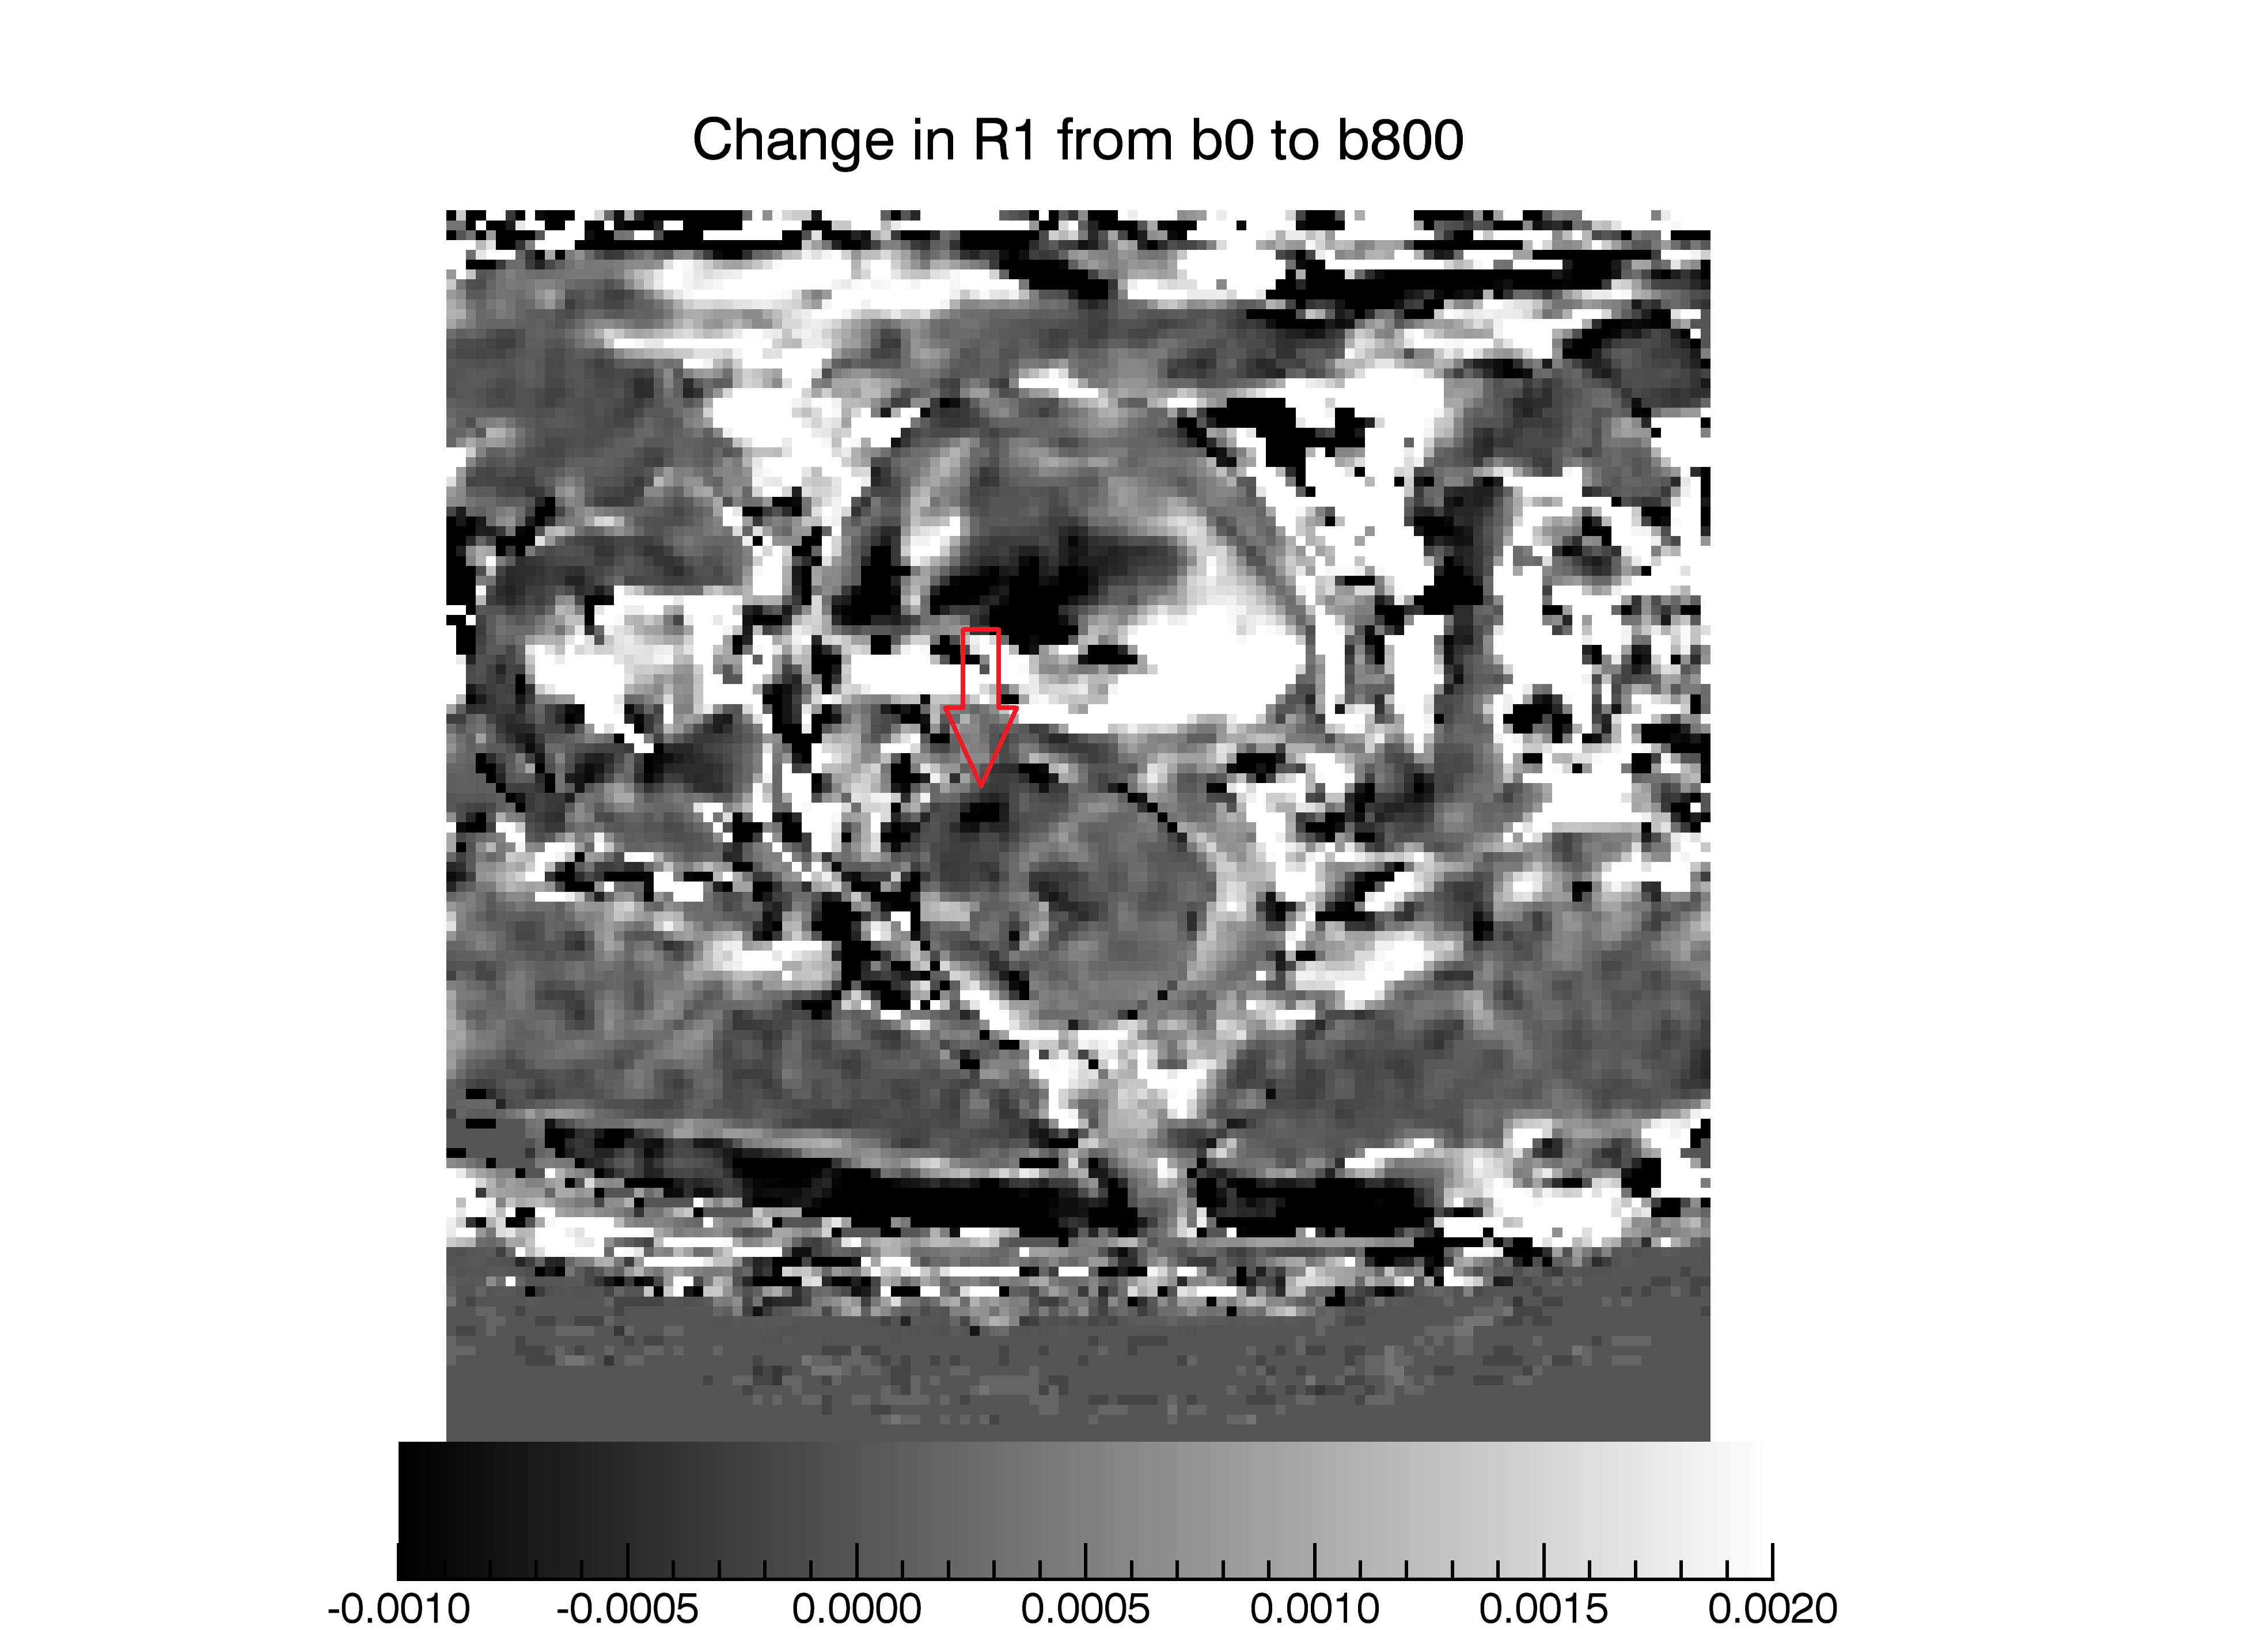
using the Levenberg-Marquardt algorithm (7). Relaxation rates R1 were calculated by inverting the T1 maps and the contrast agent induced change in ΔR1 was calculated by subtracting R1precontrast from R1postcontrast at each b-bvalue. To visualize changes in the effective relaxivity of the contrast agent due to diffusion weighting a new ΔRDW was calculated by subtracting ΔR1b=800 from ΔR1b=0
Results
The DCE-DWI-technique with WET-presaturation has been successfully performed in three patients this far. Results shown here are based on the patient showing the largest tumor as the other two tumors were too small to measure reliably.
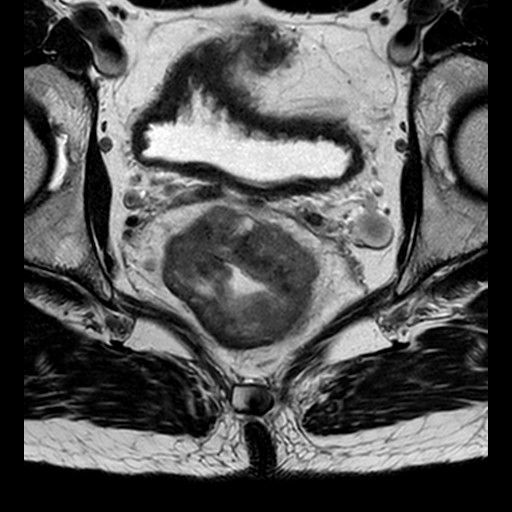
In Figure 1 a T2W TSE image show the anatomy measured. Figure 2 shows corresponding pre- and post-contrast T1-maps and derived contrast induced change in relaxation rate ΔR1. In Figure 3 a map showing ΔRDW is given. It can be seen that ΔRDW does vary through the tumor with a coldspot in the right anterior part.
Discussion and conclusion
Dotarem is an extracellular contrast agent. If the extracellular water is suppressed by diffusion weighting the relaxation effect of the contrast agent will be completely dependent on water exchange over the cell membrane.
In this first demonstration of dynamic contrast enhanced DWI we found that at the applied b-values the effect of diffusion on T1 and relaxivity is modest for most tissues. This may be due to the tissues being in the fast exchange regime. One may however, also question if the applied b-values and diffusion times are sufficient to effectively suppress the extracellular water signal. This question mandate further investigation. We did also see a cold-spot, possibly indicating a part of the tumor tissue being in a intermediate or slow exchange regime.
In conclusion, we have demonstrated the implementation of a Dynamic contrast enhanced T1W DWI into a split dynamic framework allowing the new contrasts to be assessed without sacrificing measurements of the established pharmacokinetic variables. The preliminary data shows heterogenous lesion contrast possibly due to focal slow water exchange.
Acknowledgements
Thanks to the staff at Akershus University Hospital for their support and patience when running ever more demanding MRI protocols.References
- Grøvik, E., Bjørnerud, A., Storås, T. H., & Gjesdal, K. I. (2014). Split dynamic MRI: Single bolus high spatial-temporal resolution and multi contrast evaluation of breast lesions. Journal of Magnetic Resonance Imaging, 39, 673–682.
- Grøvik, E., Bjørnerud, A., Kurz, K. D., Kingsrød, M., Sandhaug, M., Storås, T. H., & Gjesdal, K.-I. (2015). Single bolus split dynamic MRI: Is the combination of high spatial and dual-echo high temporal resolution interleaved sequences useful in the differential diagnosis of breast masses? Journal of Magnetic Resonance Imaging : JMRI, 42(1), 180–7.
- Grøvik, E., Redalen, K. R., Storås, T. H., Negård, A., Holmedal, S. H., Ree, A. H., … Gjesdal, K. I. (2017). Dynamic multi-echo DCE- and DSC-MRI in rectal cancer: Low primary tumor Ktrans and ΔR2* peak are significantly associated with lymph node metastasis. Journal of Magnetic Resonance Imaging, 46(1), 194–206.
- Yankeelov, T. E., Rooney, W. D., Li, X., & Springer, C. S. (2003). Variation of the Relaxographic “Shutter-Speed” for Transcytolemmal Water Exchange Affects the CR Bolus-Tracking Curve Shape. Magnetic Resonance in Medicine, 50(6), 1151–1169. http://doi.org/10.1002/mrm.10624
- Ogg, R. J., Kingsley, R. B., & Taylor, J. S. (1994). WET, a T1- and B1-Insensitive Water-Suppression Method for in Vivo Localized 1H NMR Spectroscopy. Journal of Magnetic Resonance, Series B, 104(1), 1–10.
- Courivaud, F., & Larsson, H. (2008). B1 insensitive saturation recovery T1 measurements at 3 Tesla using Water Suppression Enhanced through T1 effect (WET) saturation pulse. In Proceedings 16th Scientific Meeting, International Society for Magnetic Resonance in Medicine (Vol. Toronto, p. 1413).
- More, J. J. (1977). Levenberg. Marquardt Algorithm: Implementation and Theory. In Numerical analysis (Vol. 630, pp. 105–116).
Figures
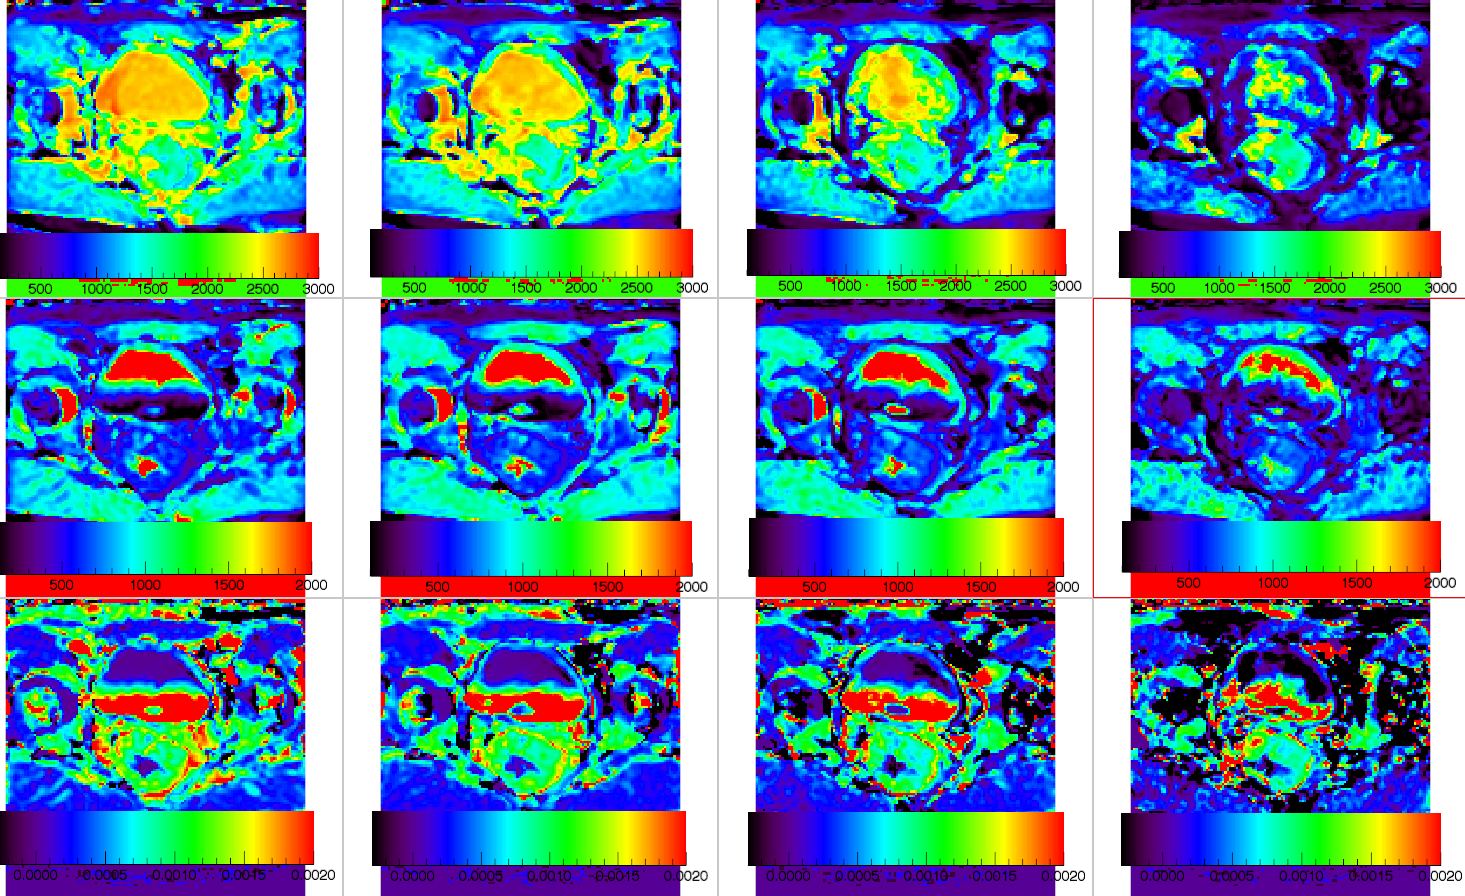
Top row show precontrast T1 maps at b-values 0, 100, 400 and 800 s/mm2 respectively depicting the tumor shown in Figure 1. Second row show corresponding postcontrast T1-maps and the in the bottom row maps show the contrast induced ΔR1 at each b-value.