2280
Accuracy and precision of Synthetic MRI1NeuroPoly Lab, Institute of Biomedical Engineering, Polytechnique Montreal, Montreal, QC, Canada, 2Department of Clinical Neuroscience, Karolinska Institutet, Stockholm, Sweden, 3Division of Neuroradiology, Department of Radiology, Karolinska University Hospital, Stockholm, Sweden, 4Center for Medical Imaging Science and Visualization, CMIV, Linköping, Sweden, 5SyntheticMR, Linköping, Sweden, 6Department of Diagnostic Medical Physics, Karolinska University Hospital, Stockholm, Sweden, 7Division of Clinical Geriatrics, Department of Neurobiology, Care Sciences and Society, Karolinska Institutet, Stockholm, Sweden, 8Montreal Health Institute, Montreal, QC, Canada, 9Functional Neuroimaging Unit, CRIUGM, Université de Montréal, Montreal, QC, Canada
Synopsis
Synthetic MRI (SyMRI) provides quantitative PD, T1 and T2 maps via a rapid single-volume acquisition. Here, we aim to validate the precision and accuracy of SyMRI quantification by performing five scan re-scans, at two field strengths, of the quantitative NIST phantom and one control subject. Results show a good accuracy of T1 and T2 quantification at 3T, and a very good precision of all the phantom and subject measurements at 1.5T and 3T (95% confidence intervals width are respectively lower than 6% and 4%, of the measured value). This study brings confidence in comparing SyMRI quantitative measurements across subjects or time.
Purpose
Quantitative MRI (qMRI) is becoming increasingly popular as a tool that can enable clinicians to compare examinations longitudinally and between patients.1 QMRI has also shown potential to study subtle pathological mechanisms2,3 and to achieve accurate diagnosis.4,5 However, qMRI often comes with limitations such as long scan times and/or complex post-processing. Even more problematic, qMRI techniques are typically hampered by poor reproducibility6,7, and accuracy is rarely estimated. Of potential interest, synthetic MRI (SyMRI) provides quantitative PD, T1 and T2 maps via single-volume acquisition.8 In addition to the advantages associated with the single acquisition (e.g., no co-registration required), synthetic MRI has been validated as a time-efficient imaging method for a number of clinical applications.4,5,8–12 Here, we propose to measure i) the SyMRI precision using data from 5 scan-rescan acquisitions in a healthy subject and ii) the accuracy using the quantitative NIST phantom.13,14Methods
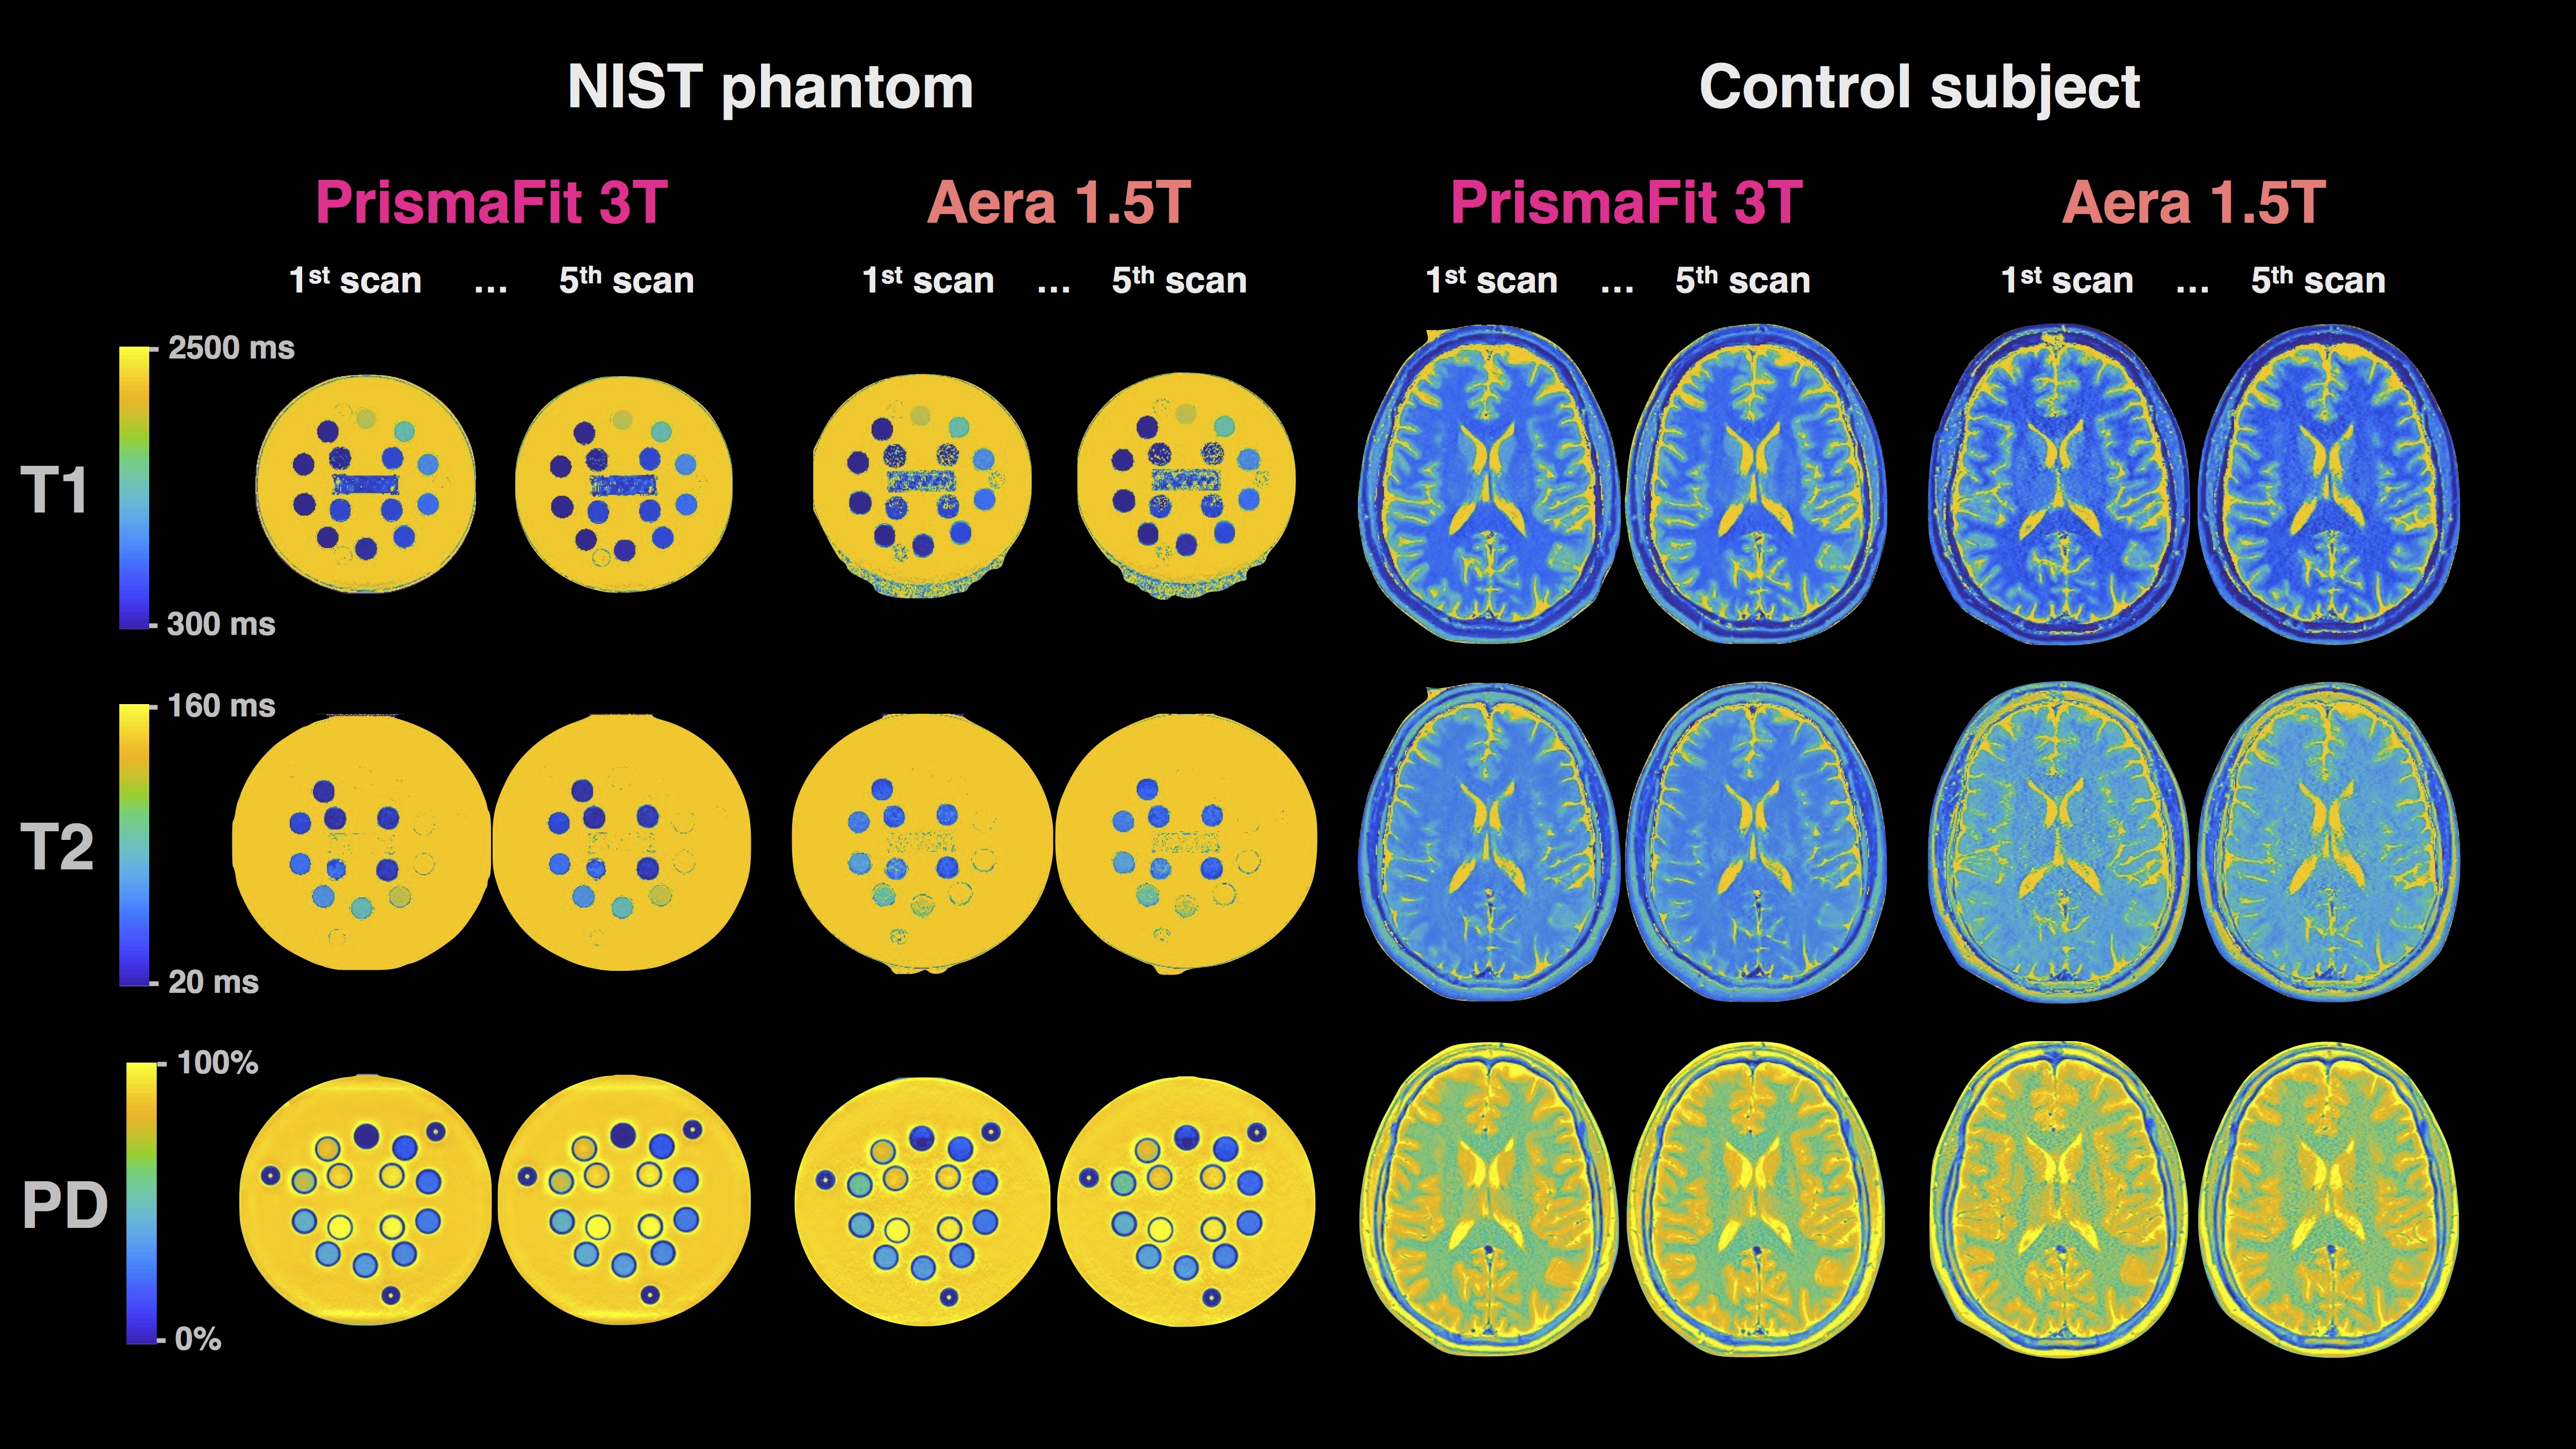
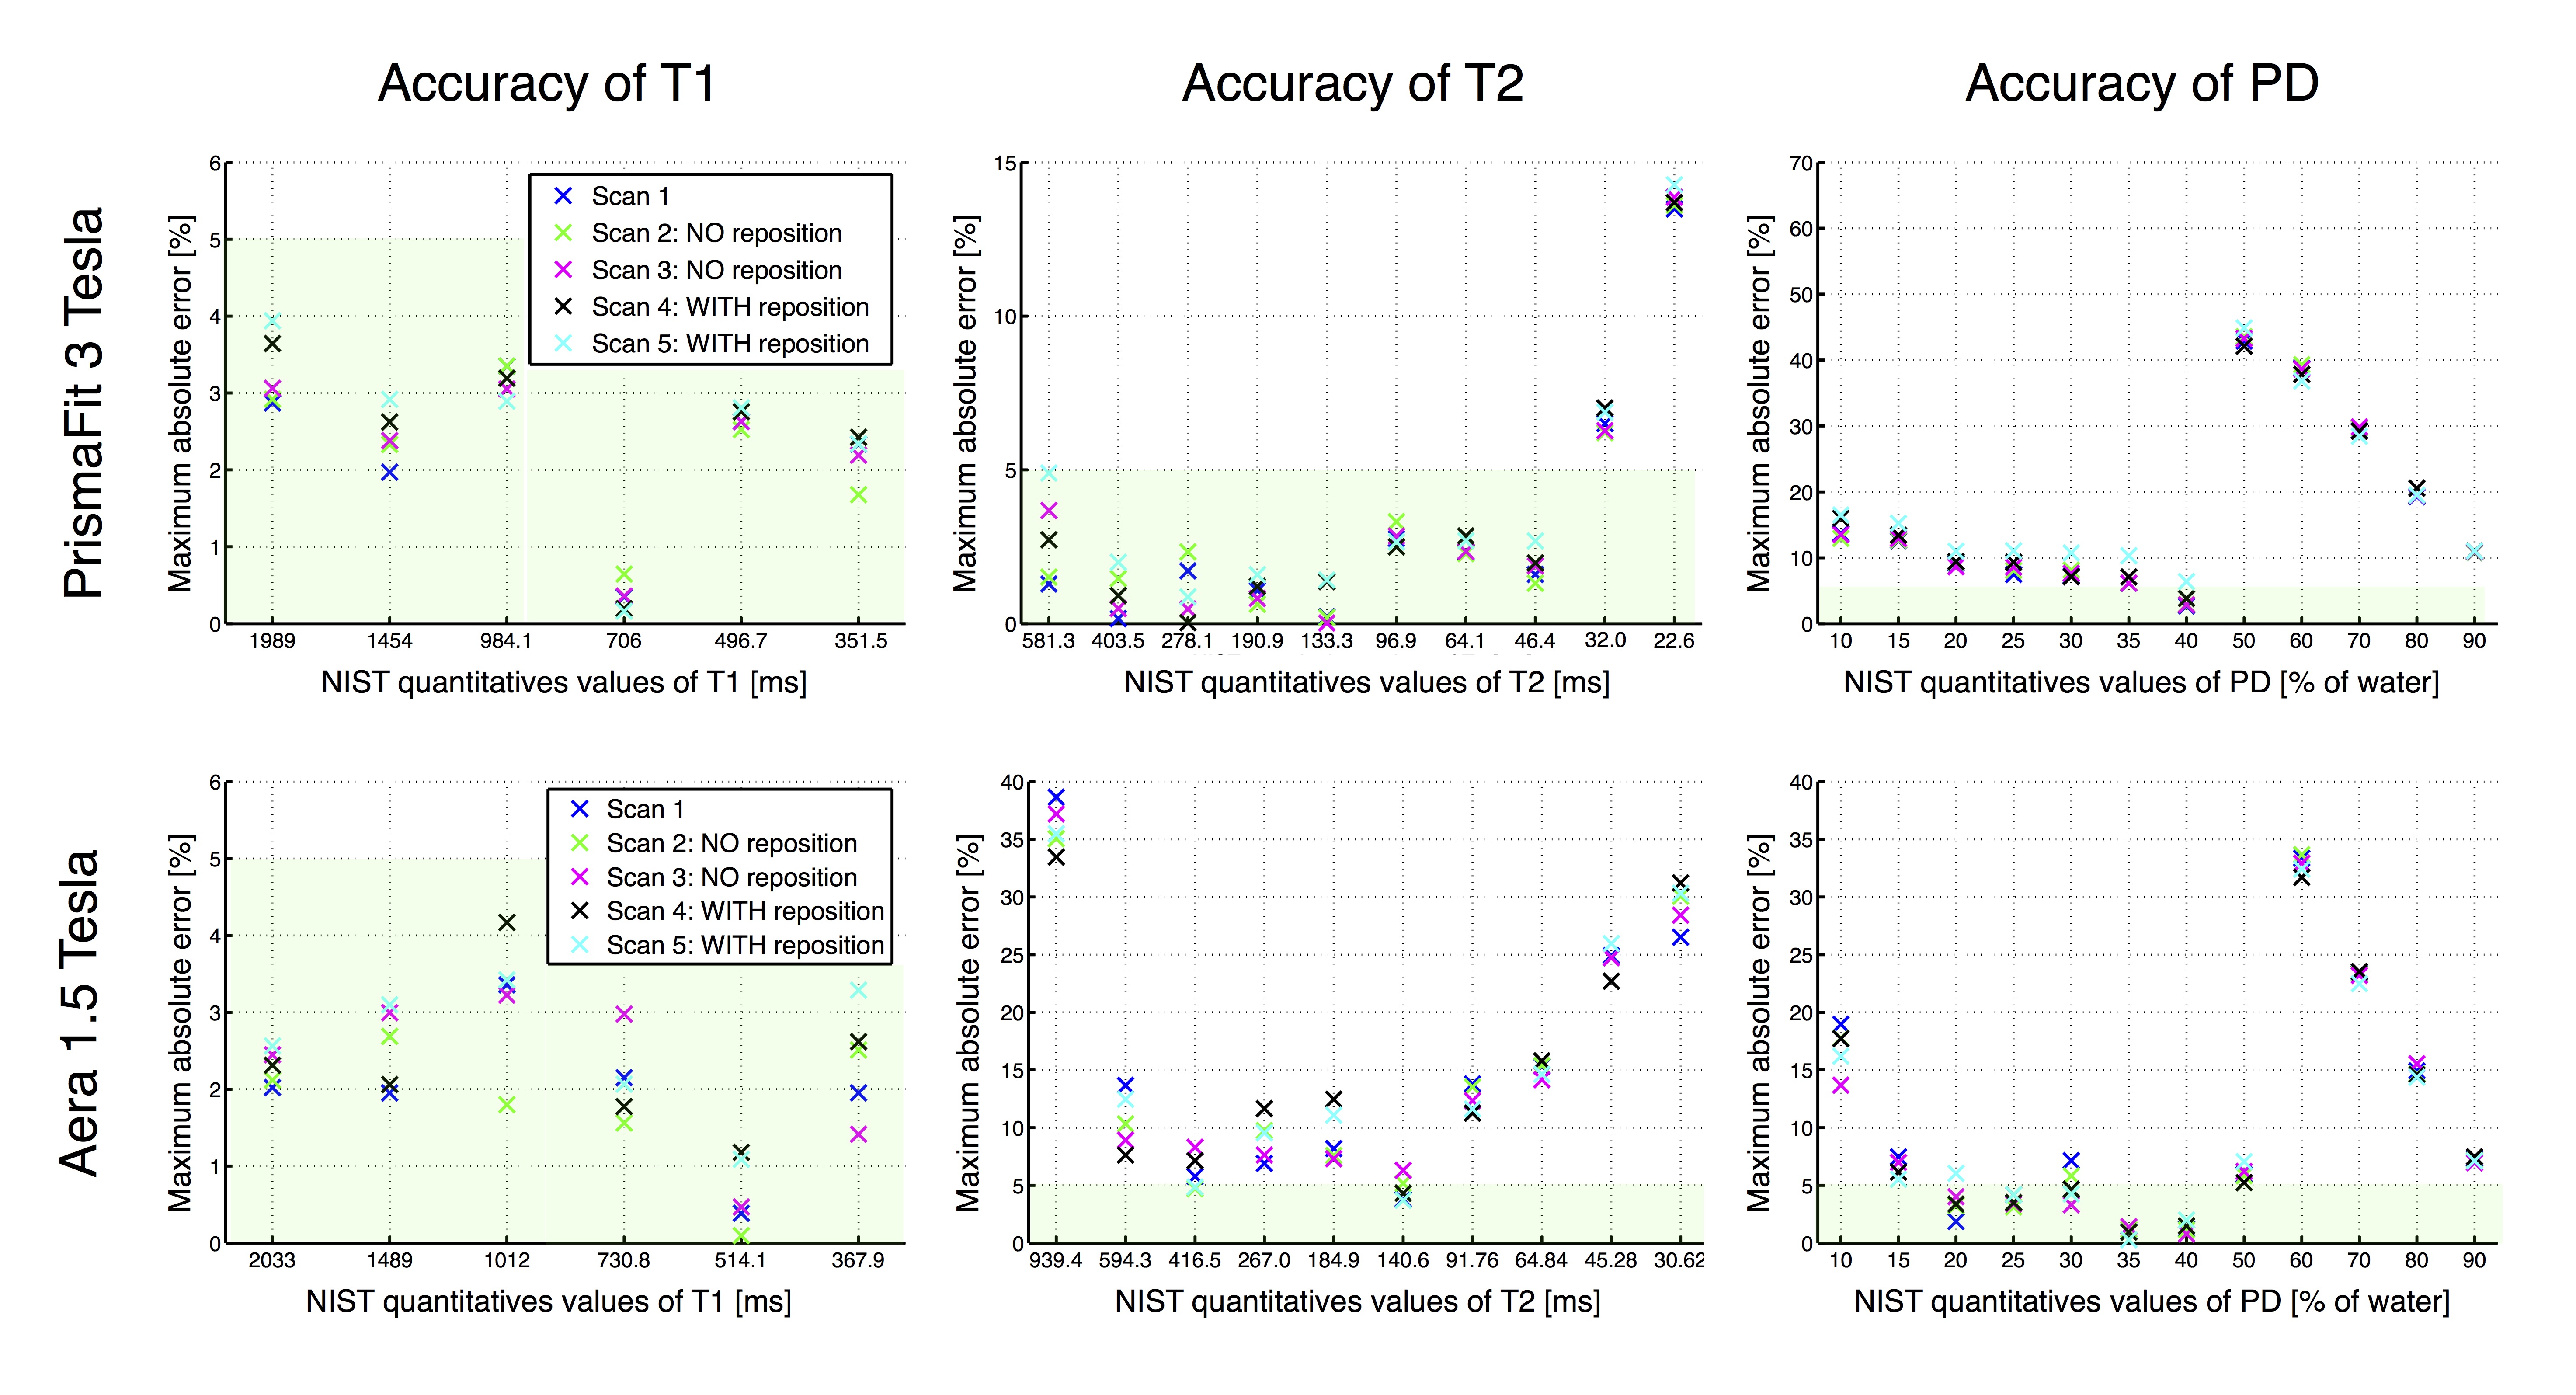
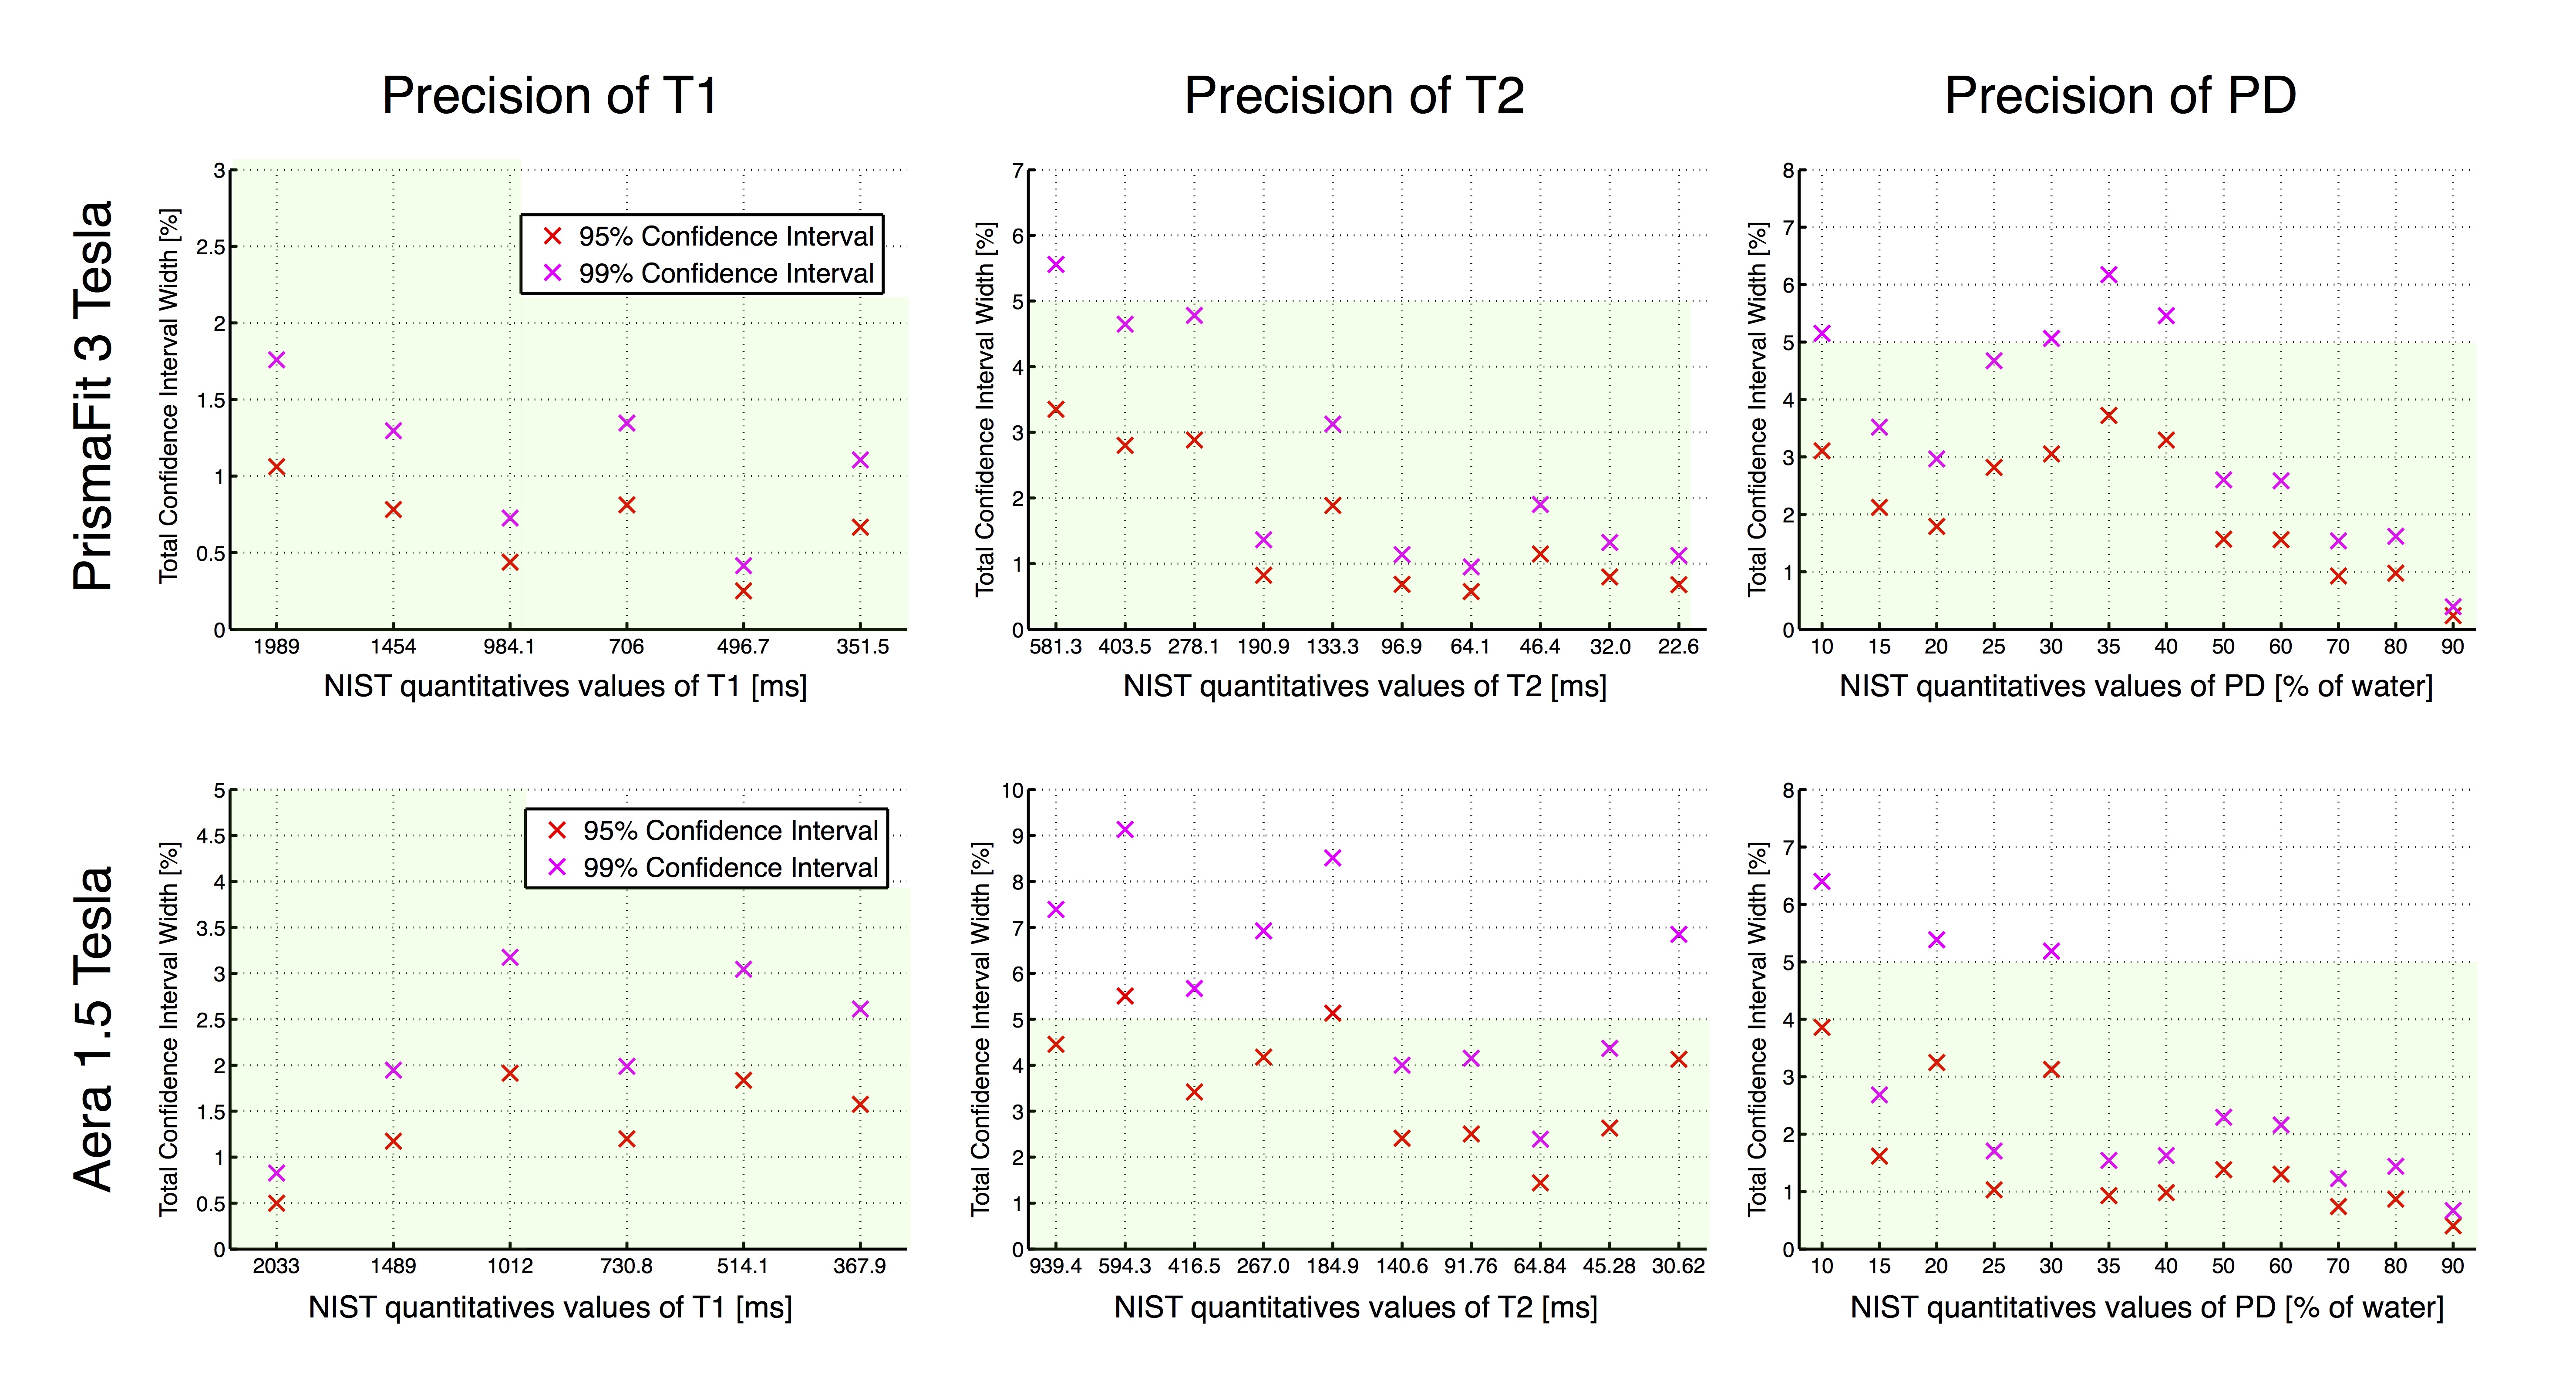
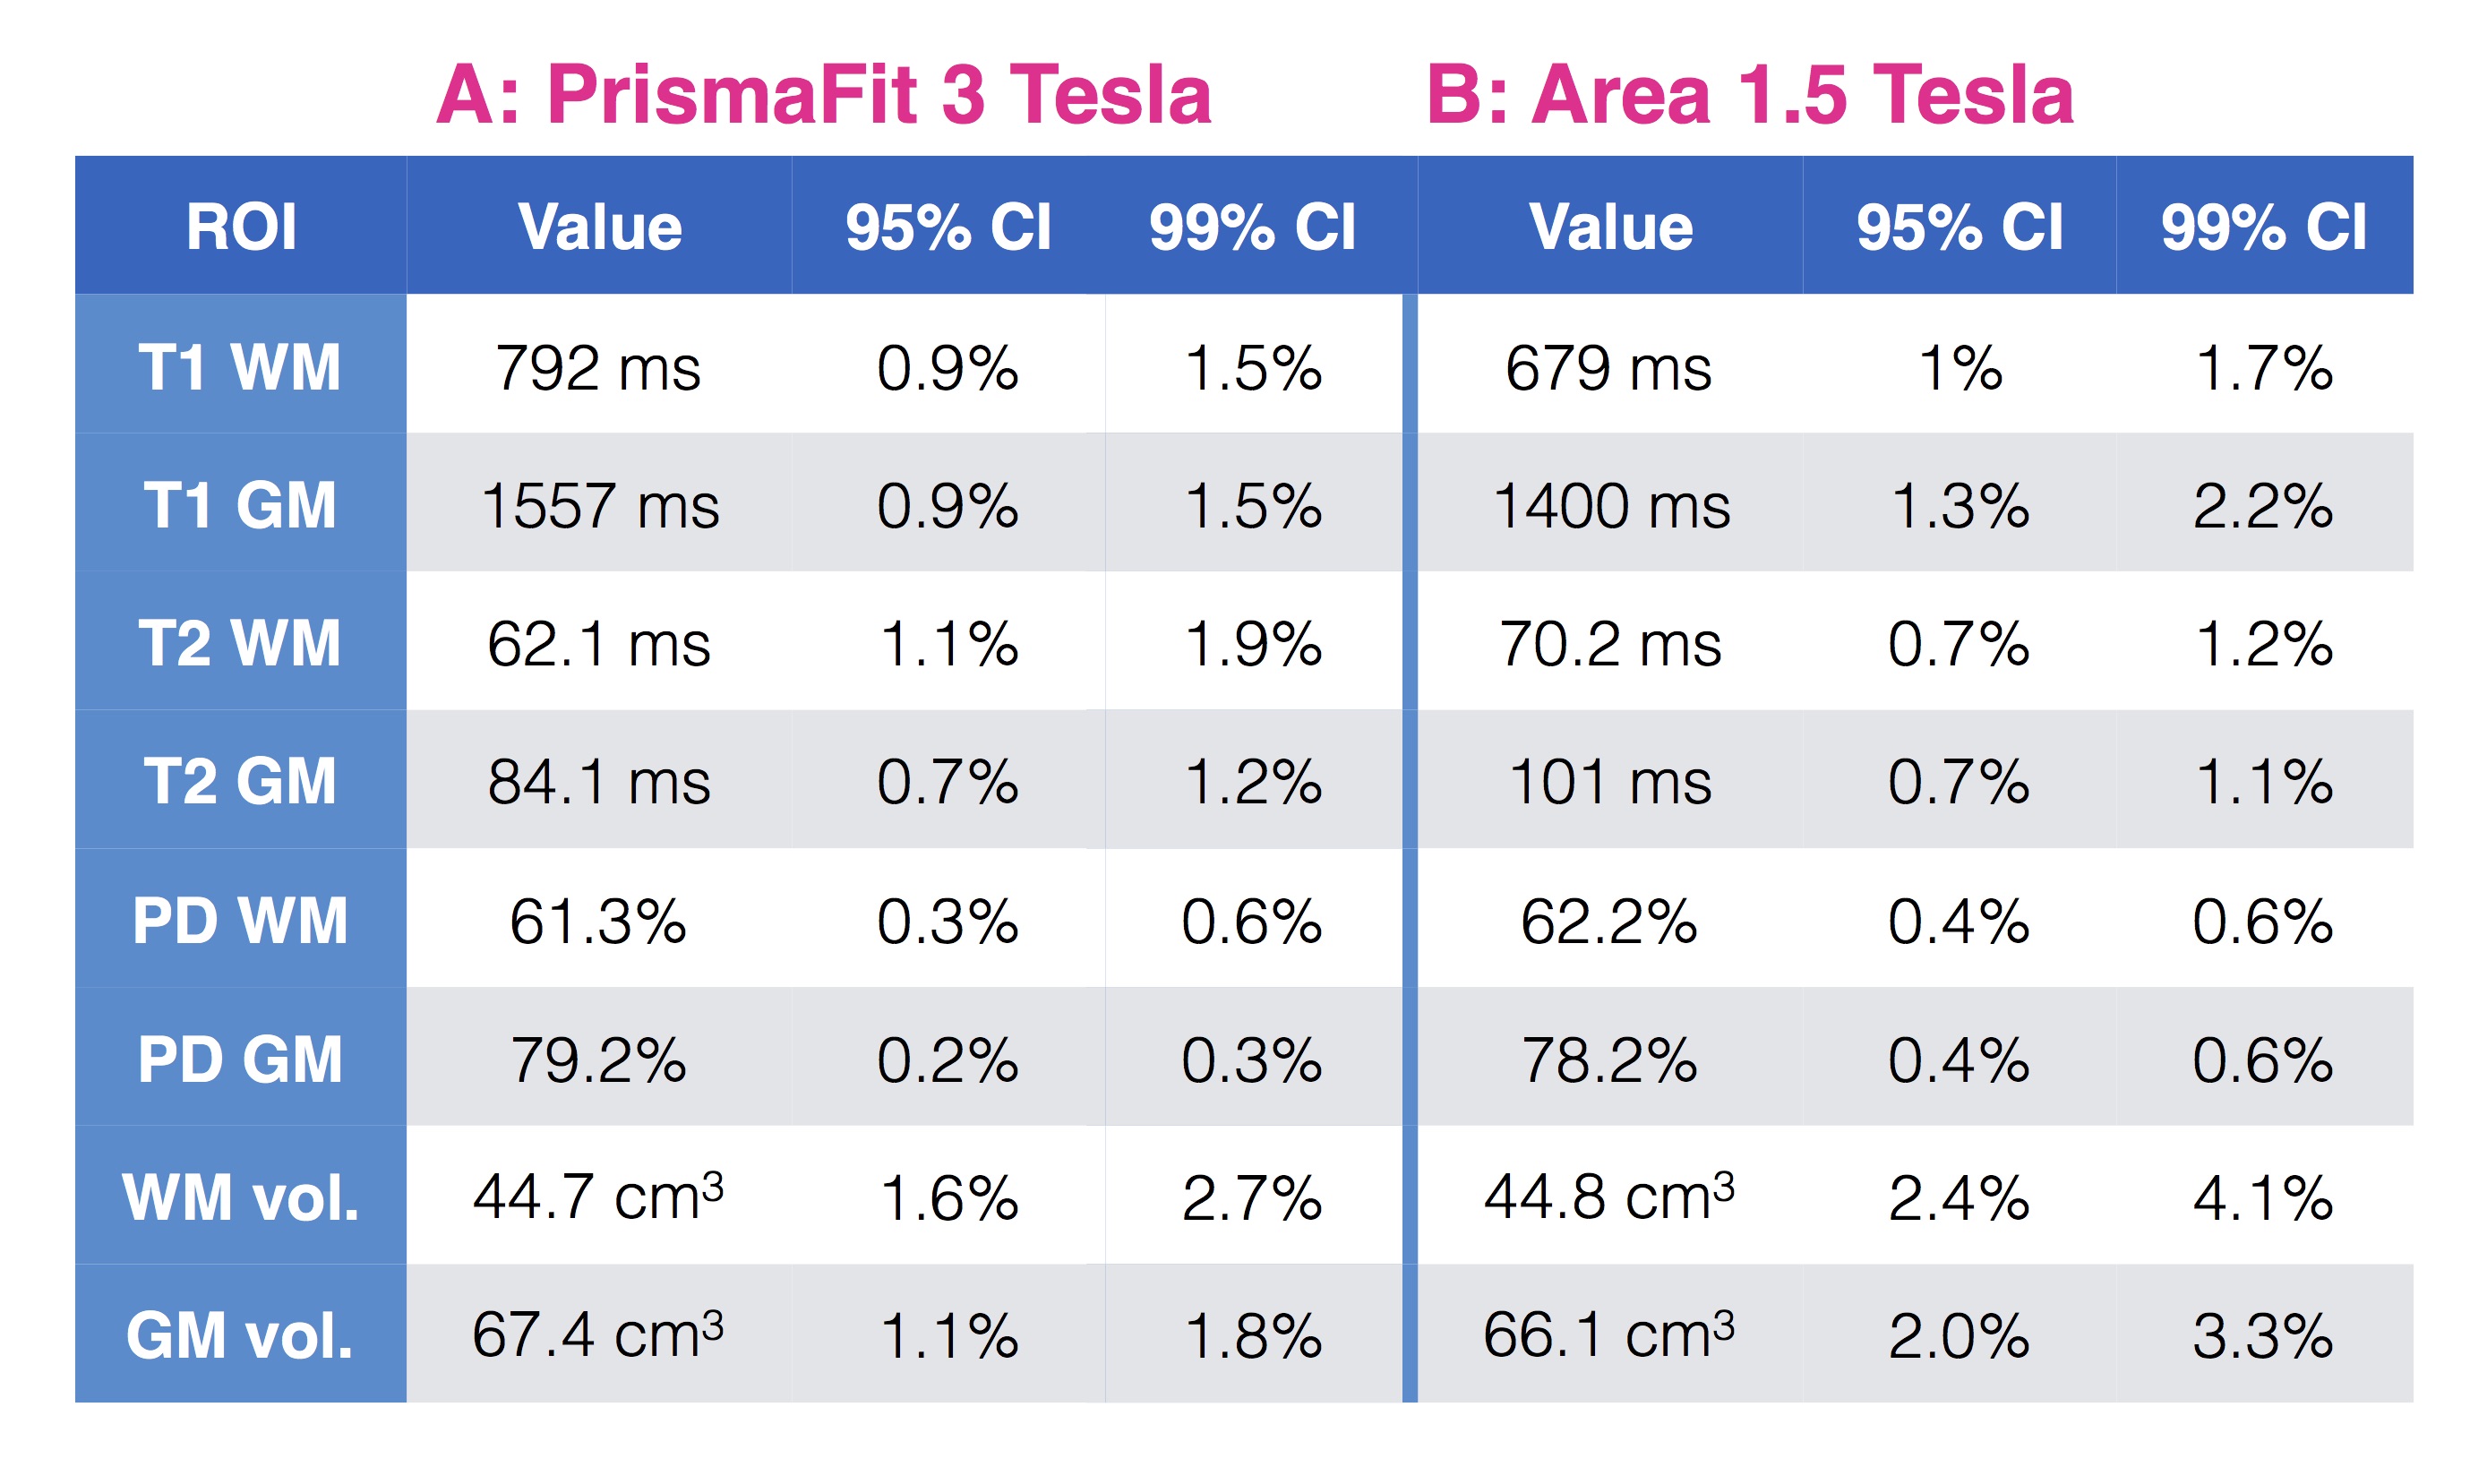
Data acquisition and pre-processing: The quantitative NIST phantom and a 29-year-old healthy male control subject underwent five scans on Siemens Aera 1.5 T and Siemens PrismaFit 3.0 T scanners (Siemens Medical Systems, Erlangen, Germany) with a standard 20-channel head coil. The three first scans were performed without reposition and the two last with removal and repositioning (3+1+1 protocol). The acquisition parameters for the multi-dynamic multi-echo sequence in the control were: 30 axial slices in the control and 40 slices to cover the entire phantom, resolution 0.7x0.7x4.0 mm3 with a 1 mm slice gap, flip angle 120°; repetition time 4480/4630 ms; echo times 22/23 and 97/101 ms (Aera/PrismaFit); 4 averages (150/580/2000/4130 ms effective inversion times); GRAPPA factor 3; acquisition time 5:55/6:24 min (Warntjes et al. 2008). For the phantom the number of slices was increased to 40 to cover the entire phantom, resulting in a repetition time of 5780 and acquisition time of 8:24. The software SyMRI 11.0 Beta 4 was used to fit the quantitative T1, T2 and PD maps.The NIST phantom is composed of spheres filled with water and i) NiCl2, with T1 from 20 to 2000 ms at 3T; ii) MnCl2, with T2 from 80 to 2500 ms at 3T; and iii) D2O, with PD from 5 to 100 %-of-water (Figure 1). Here, only the spheres within the quantification range of SyMRI were considered: 300 to 4300 ms for T1 and 20 to 2000 ms for T2. The center of each sphere was manually determined and the calculations were made on squares of 11x11 voxels centered on each sphere in order to avoid any partial volume effect. Concerning the control subject, white matter (WM) and grey matter (GM) masks were automatically segmented by the SyMRI software, then volumetry and quantitative measurements were done using WM and GM masks as ROIs. The accuracy of the scans was then estimated by relating the measured values to the qMRI values of the NIST phantom. The precision, also known as reproducibility coefficient or confidence interval, was estimated by using the five scan re-scans data-points. Formulas are detailed in the respectives figures.
Results
Figure 2 shows good accuracy of the T1 measurements at 3T and 1.5T (error < 5%). For T2, the accuracy is still high at 3T, over 40 ms, but is lower at 1.5T. The PD quantification in the NIST phantom suffers from large errors, mainly due to the fact that the SyMRI software relies on the tissue segmentation to calibrate the PD scale, a step which is likely to fail in phantom imaging. Concerning the reposition variability, we note that there is only negligible difference between the scans performed without vs with reposition.Figure 3 shows high precision of all the measurements performed at 3T and at 1.5T (95% CI width always under 4% and 6% respectively). We note than T1 measurements show the highest precision with a 95% CI width of no more than 1% or 2% at 3T and 1.5T respectively.
Figure 4 also shows high precision in the control subject’s ROIs: 95% CI width always under 1.6% and 2.4% at 3T and 1.5T respectively.
Discussion/Conclusion
In conclusion, SyMRI exhibits good T1 and T2 accuracy in the NIST phantom, yet the PD quantification in phantom is still a challenge. The precisions in the NIST phantom and in the human subject were high, which brings confidence in comparing measurements across subjects or time. The reported T1 values in grey matter are high compared to literature,16 and in a follow up study we plan to compare them against an inversion recovery gold standard. Future works will investigate variability and accuracy across centers and vendors. We advise that all quantitative MRI techniques should undergo precision and accuracy studies in order to increase confidence in quantitative MRI.Acknowledgements
This research was supported by the Stockholm City Council and Karolinska Institutet (ALF 20120213 and 20150166), the Canadian Institute of Health Research (CIHR FDN-143263), Canada Research Chair in Quantitative Magnetic Resonance Imaging, the Fonds de Recherche du Québec - Santé (FRQS 28826), the Fonds de Recherche du Québec - Nature et Technologies (FRQNT 2015-PR-182754), Quebec Bio-Imaging Network (QBIN), the Natural Sciences and Engineering research Council of Canada (NSERC). Dr. Granberg is supported by the Swedish Society for Medical Research.References
1. Vaughn, J. et al. MRI characterization and longitudinal study of focal cerebellar lesions in a young tuberous sclerosis cohort. AJNR Am. J. Neuroradiol. 34, 655–659 (2013).
2. Mainero, C. et al. A gradient in cortical pathology in multiple sclerosis by in vivo quantitative 7 T imaging. Brain 138, 932–945 (2015).
3. Cohen-Adad, J. et al. T₂* mapping and B₀ orientation-dependence at 7 T reveal cyto- and myeloarchitecture organization of the human cortex. Neuroimage 60, 1006–1014 (2012).
4. Hagiwara, A. et al. Utility of a Multiparametric Quantitative MRI Model That Assesses Myelin and Edema for Evaluating Plaques, Periplaque White Matter, and Normal-Appearing White Matter in Patients with Multiple Sclerosis: A Feasibility Study. AJNR Am. J. Neuroradiol. 38, 237–242 (2017).
5. Hagiwara, A. et al. Analysis of White Matter Damage in Patients with Multiple Sclerosis via a Novel In Vivo MR Method for Measuring Myelin, Axons, and G-Ratio. AJNR Am. J. Neuroradiol. 38, 1934–1940 (2017).
6. De Guio, F. et al. Reproducibility and variability of quantitative magnetic resonance imaging markers in cerebral small vessel disease. J. Cereb. Blood Flow Metab. 36, 1319–1337 (2016).
7. McGuire, S. A. et al. Reproducibility of quantitative structural and physiological MRI measurements. Brain Behav. 7, e00759 (2017).
8. Hagiwara, A. et al. Symri of the Brain: Rapid Quantification of Relaxation Rates and Proton Density, With Synthetic Mri, Automatic Brain Segmentation, and Myelin Measurement. Invest. Radiol. 52, 647–657 (2017).
9. Granberg, T. et al. Clinical Feasibility of Synthetic MRI in Multiple Sclerosis: A Diagnostic and Volumetric Validation Study. AJNR Am. J. Neuroradiol. 37, 1023–1029 (2016).
10. Warntjes, J. B. M., Leinhard, O. D., West, J. & Lundberg, P. Rapid magnetic resonance quantification on the brain: Optimization for clinical usage. Magn. Reson. Med. 60, 320–329 (2008).
11. Kim, H. G., Moon, W.-J., Han, J. & Choi, J. W. Quantification of myelin in children using multiparametric quantitative MRI: a pilot study. Neuroradiology (2017).
12. Vågberg, M. et al. Automated determination of brain parenchymal fraction in multiple sclerosis. AJNR Am. J. Neuroradiol. 34, 498–504 (2013).
13. Keenan, K., Stupic, K. F., Boss, M. A. & Russek, S. E. Standardized phantoms for quantitative cardiac MRI. J. Cardiovasc. Magn. Reson. 17, W36 (2015).
14. Quantitative MRI (qMRI) System Phantom. HPD Available at: http://www.hpd-online.com/system-phantom.php.
15. Hagiwara, A. et al. Synthetic MRI in the Detection of Multiple Sclerosis Plaques. AJNR Am. J. Neuroradiol. 38, 257–263 (2017).
16. Stikov, N. et al. On the accuracy of T1 mapping: Searching for common ground. Magn. Reson. Med. (2014).
Figures