2277
SafeNet: Artificial Neural Network for Real-Time T2 Mapping with Quality Assurance1Department of Electrical and Computer Engineering, Seoul National University, Seoul, Republic of Korea, 2Department of Radiology, Seoul St.Mary's Hospital, College of Medicine, The Catholic University of Korea, Seoul, Republic of Korea
Synopsis
Accurate T2 mapping using multi-echo spin-echo data is a time-consuming process due to stimulated echo correction. In this study, we developed an artificial neural network for real-time T2 mapping. The training dataset using both in-vivo data and model-based synthetic data demonstrated the best performance. The resulting T2 map shows mean T2 errors of less than 0.3 ms with minimal computation time (less than 1 sec as opposed to 8.3 hours for conventional method). An additional algorithm was developed to ensure the fidelity of the T2 map at the cost of slightly increased computation time.
Purpose
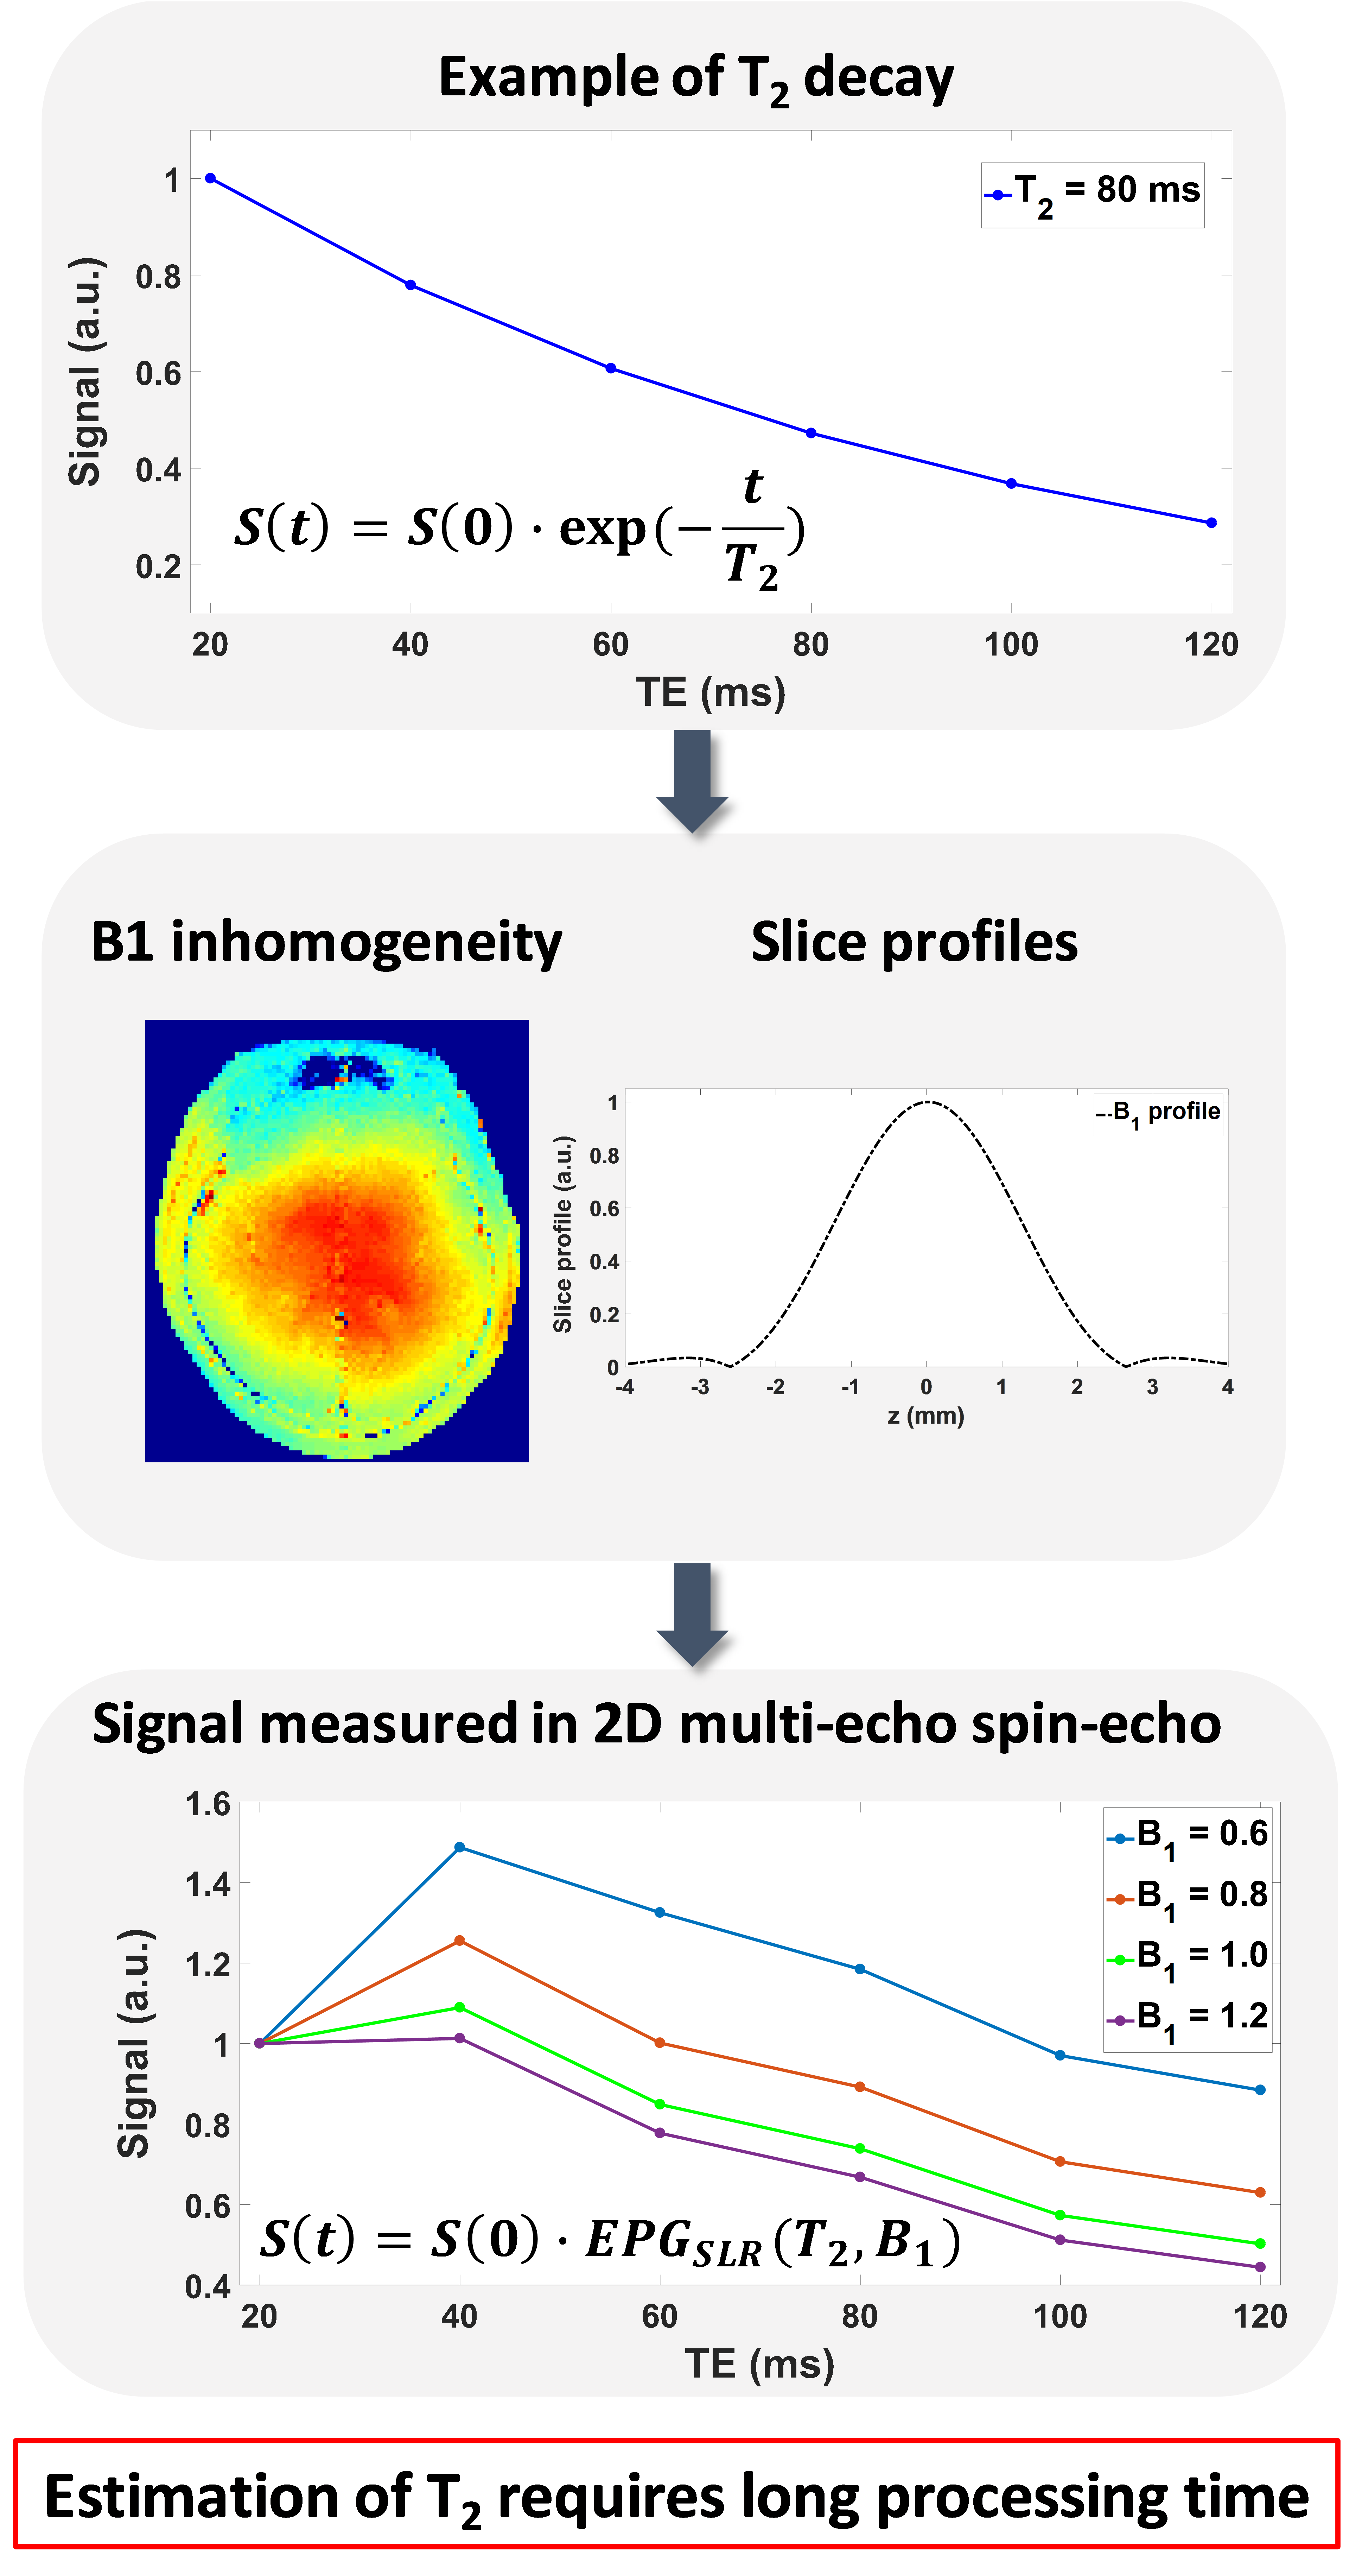
The quantification of T2 is broadly applied as a means for tissue characterization and disease diagnosis.1-3 However, accurate T2 quantification for multi-echo spin-echo data is complicated because it requires correction for the stimulated echoes produced by B1 inhomogeneity and slice profile (Fig. 1).4-6 Recently, an integrated model (EPGSLR) has been proposed to compensate for these factors.6 However, the method requires long processing time, up to several hours per brain volume. To overcome this challenge, we developed an artificial neural network (ANN) 7,8 for real-time T2 mapping. An additional algorithm was developed to ensure the fidelity of the T2 map at the cost of slightly increased computation time.Methods
[Artificial neural network]
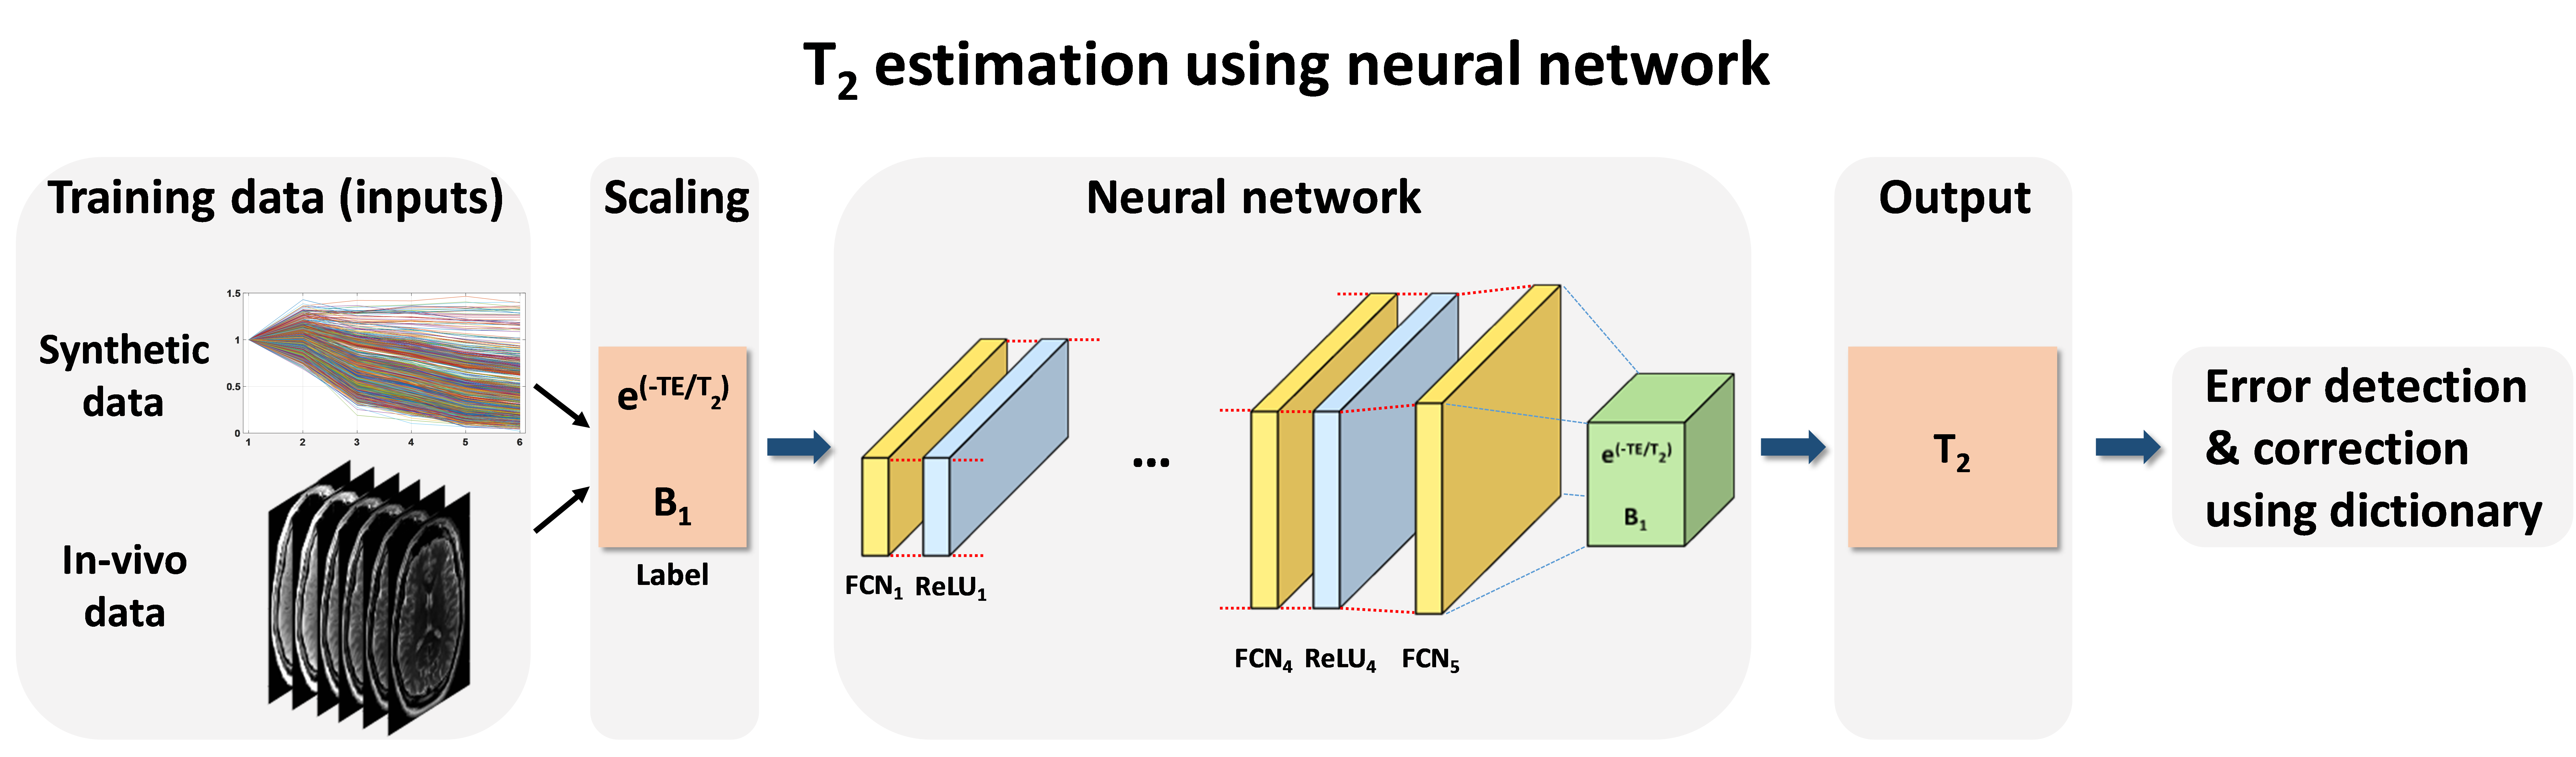
As depicted in Figure 2, the T2 mapping ANN was designed to have 5 different fully connected layers (FCNs) with each FCN except the output layer connected to a rectified linear unit (ReLU). The input layer receives multi-echo spin-echo signals (six echoes in this work) normalized by the first echo magnitude. The outputs of the ANN are E2 and B1, where E2 = exp(-TE1/T2). The T2 value is calculated by substituting TE1 into E2, where TE1 is the first echo-time. The training cost $$$L(\theta)$$$ was defined as $$L(\theta)=\frac{1}{N}∑_{\:i=1}^{\:N}[(E_{2,label}\:(i)-E_{2,output}\:(i;\theta))^{2}+(B_{1,label}\:(i)-B_{1,output}\:(i;\theta))^{2}]$$, where N is the size of data and $$$\theta$$$ are the trainable parameters of the ANN. This approach of using E2 instead of T2 converts the input range from [0,∞) in T2 to (0,1] in E2 and, therefore, enables the ANN to be applied for any TE. Additionally, this approach overcomes the limited T2 range of in-vivo data because a wide range of E2 can be acquired by changing TE. For quality assurance of the T2 mapping (QA process), voxels with large residual error (RMSE>0.02) were reprocessed using EPGSLR dictionary-matching with the estimated T2 from the ANN as an initial point to facilitate an efficient search.
[In-vivo and synthetic data]
For a training set of the ANN, in-vivo data and the EPGSLR fitted E2 and B1 results were used. 2D multi-echo spin-echo data from 5 subjects (1 for test set) were acquired at 3T using the following parameters: four different echo spacings = 9.5, 20, 32 and 46 ms, echo train length = 6, slice thickness = 2 mm, resolution = 1.5×1.5 mm2 and number of slices = 50. Total voxel numbers for training were 120,000 per subject. Synthetic data were generated for different E2 and B1 values using the EPGSLR model. The values were uniformly distributed for E2 ([0,1]) and B1 ([0.5,1.5]).
[Evaluation]
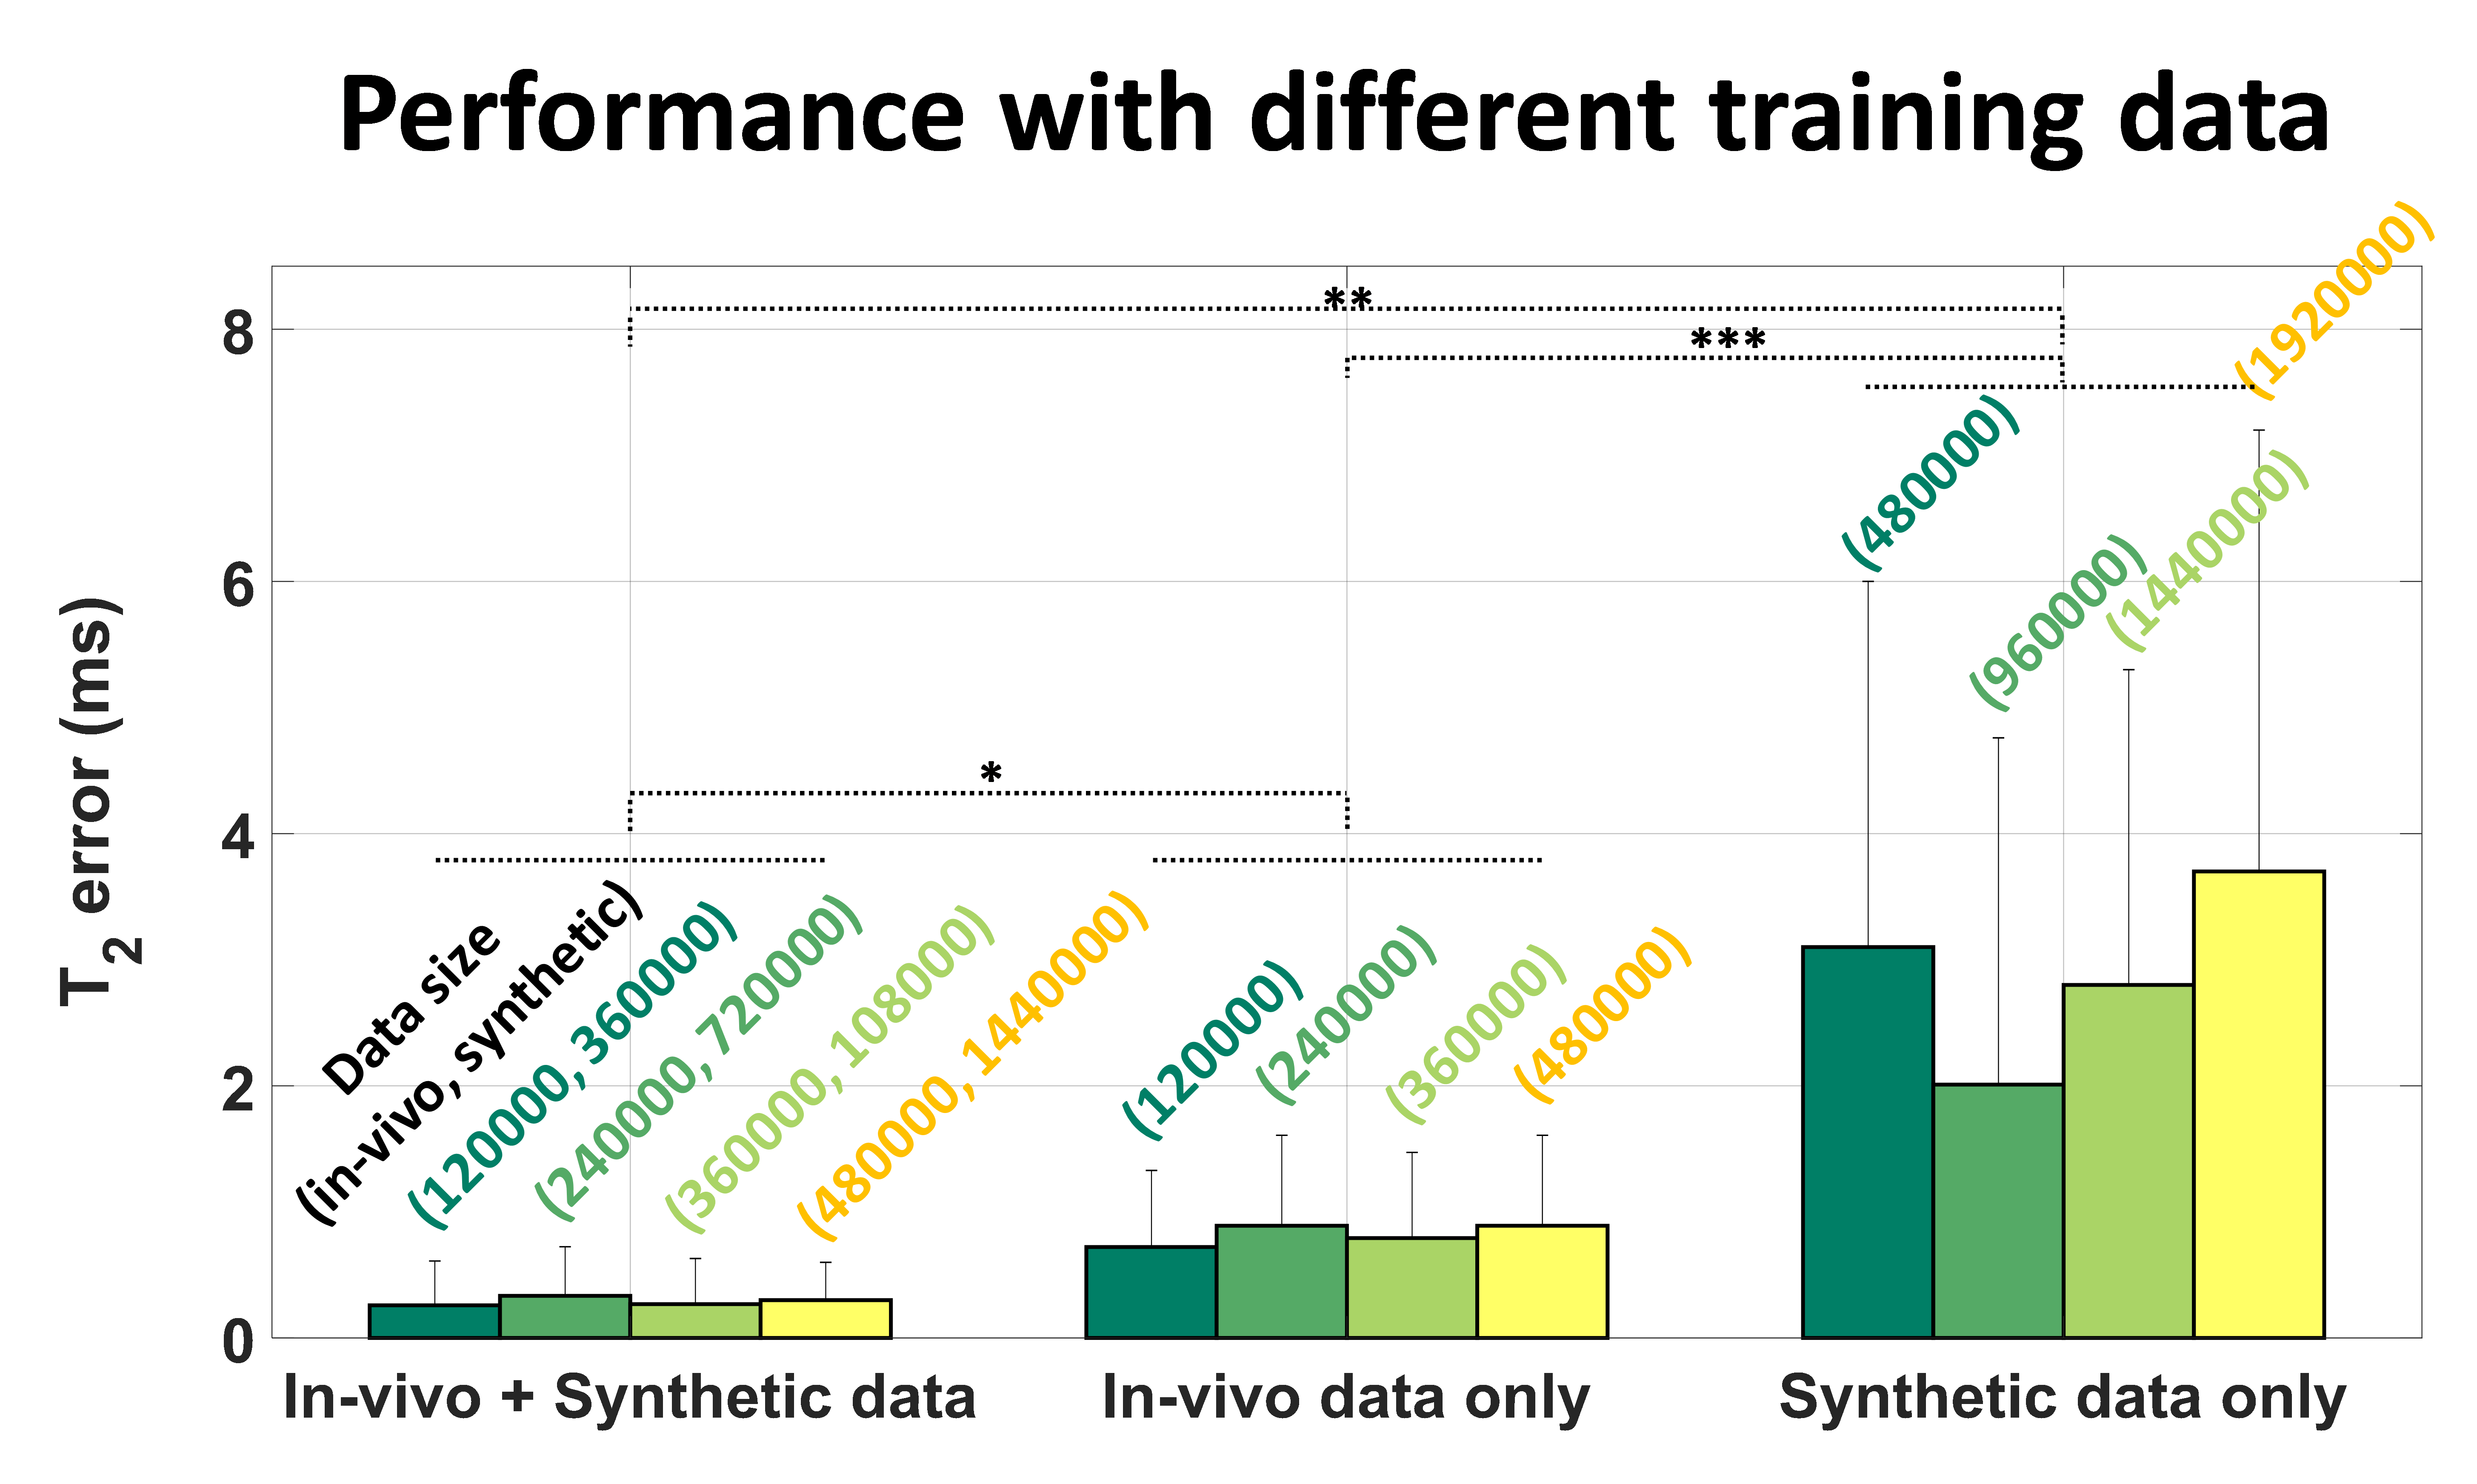
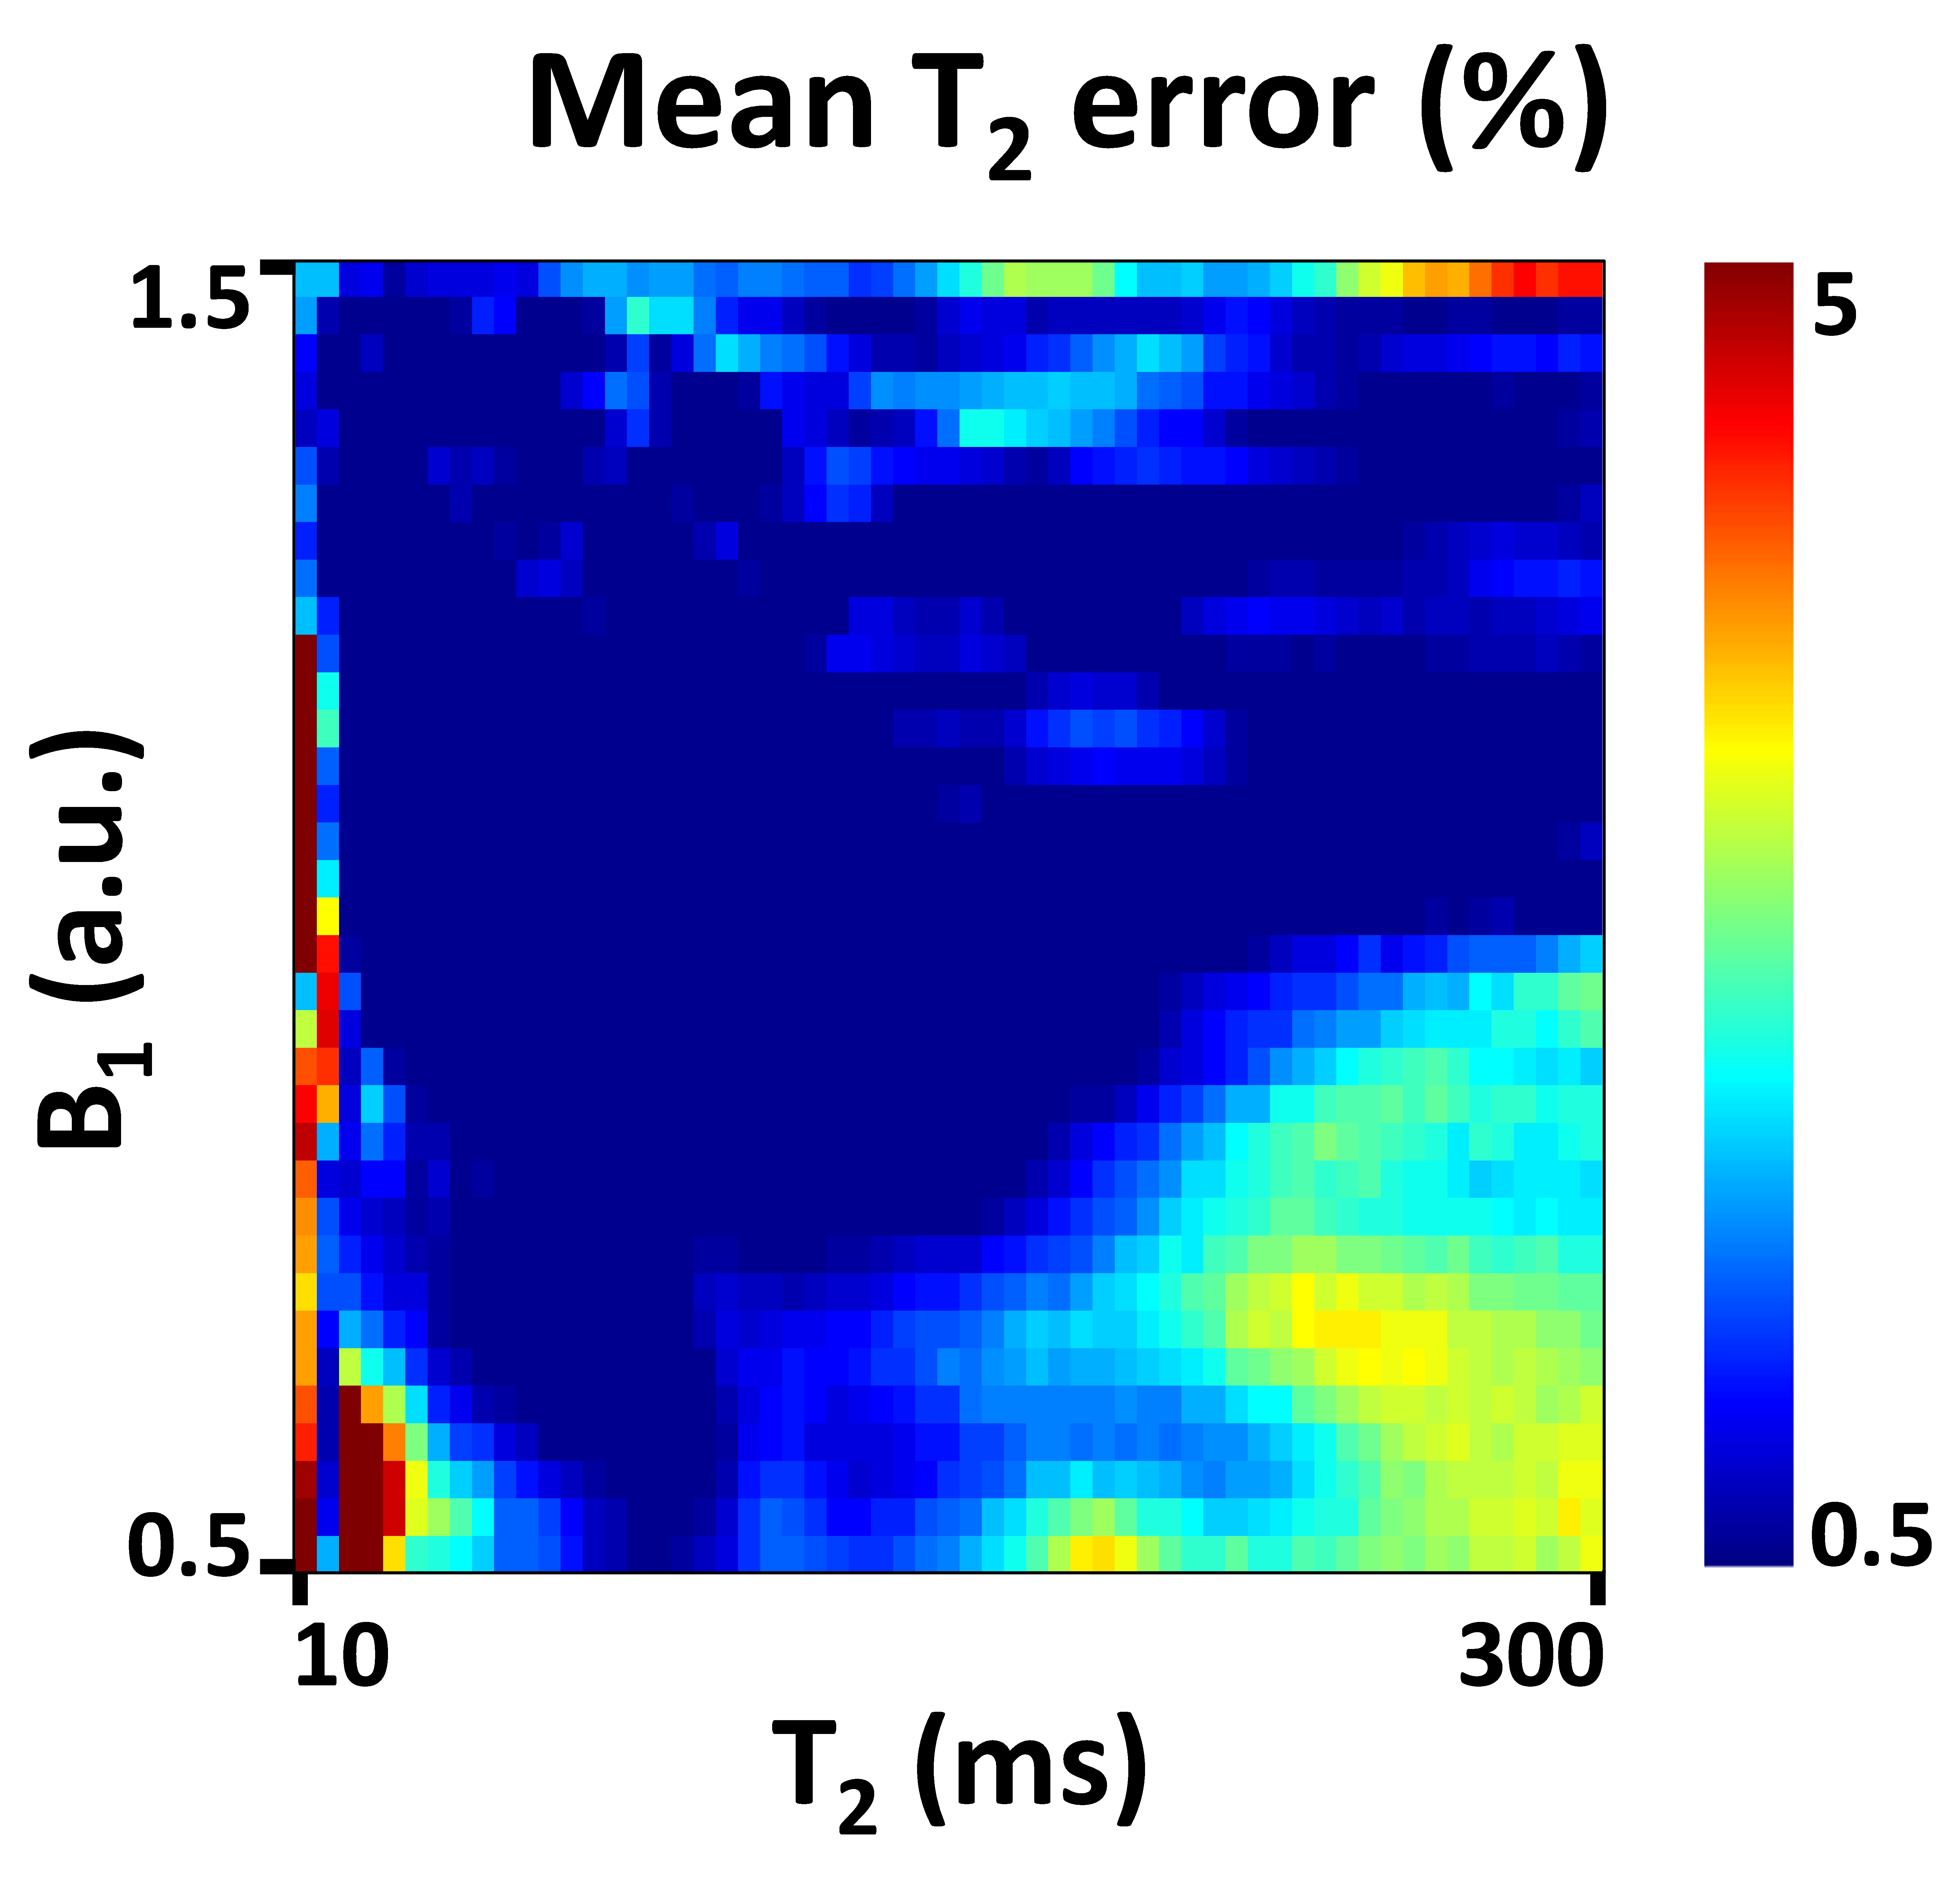
To test the dependencies on the training data composition and size, the ANN was trained with various training sets (in-vivo-only, synthetic-only and both) and a T2 error was evaluated by the difference from the actual T2 values determined by the EPGSLR curve-fitting. For the best performing ANN, the T2 map was compared with that from EPGSLR curve-fitting and EPGSLR dictionary-matching (T2 resolution = 0.5 ms). The processing time was calculated under the same computing environment (MATLAB; 8 core 2.4 GHz CPU). Additionally, EPGSLR signals (SNR(TE1) = 200, repetition = 1000) were generated to compare T2 errors for broad ranges of T2 (10-300 ms) and B1 (0.5-1.5).
Results
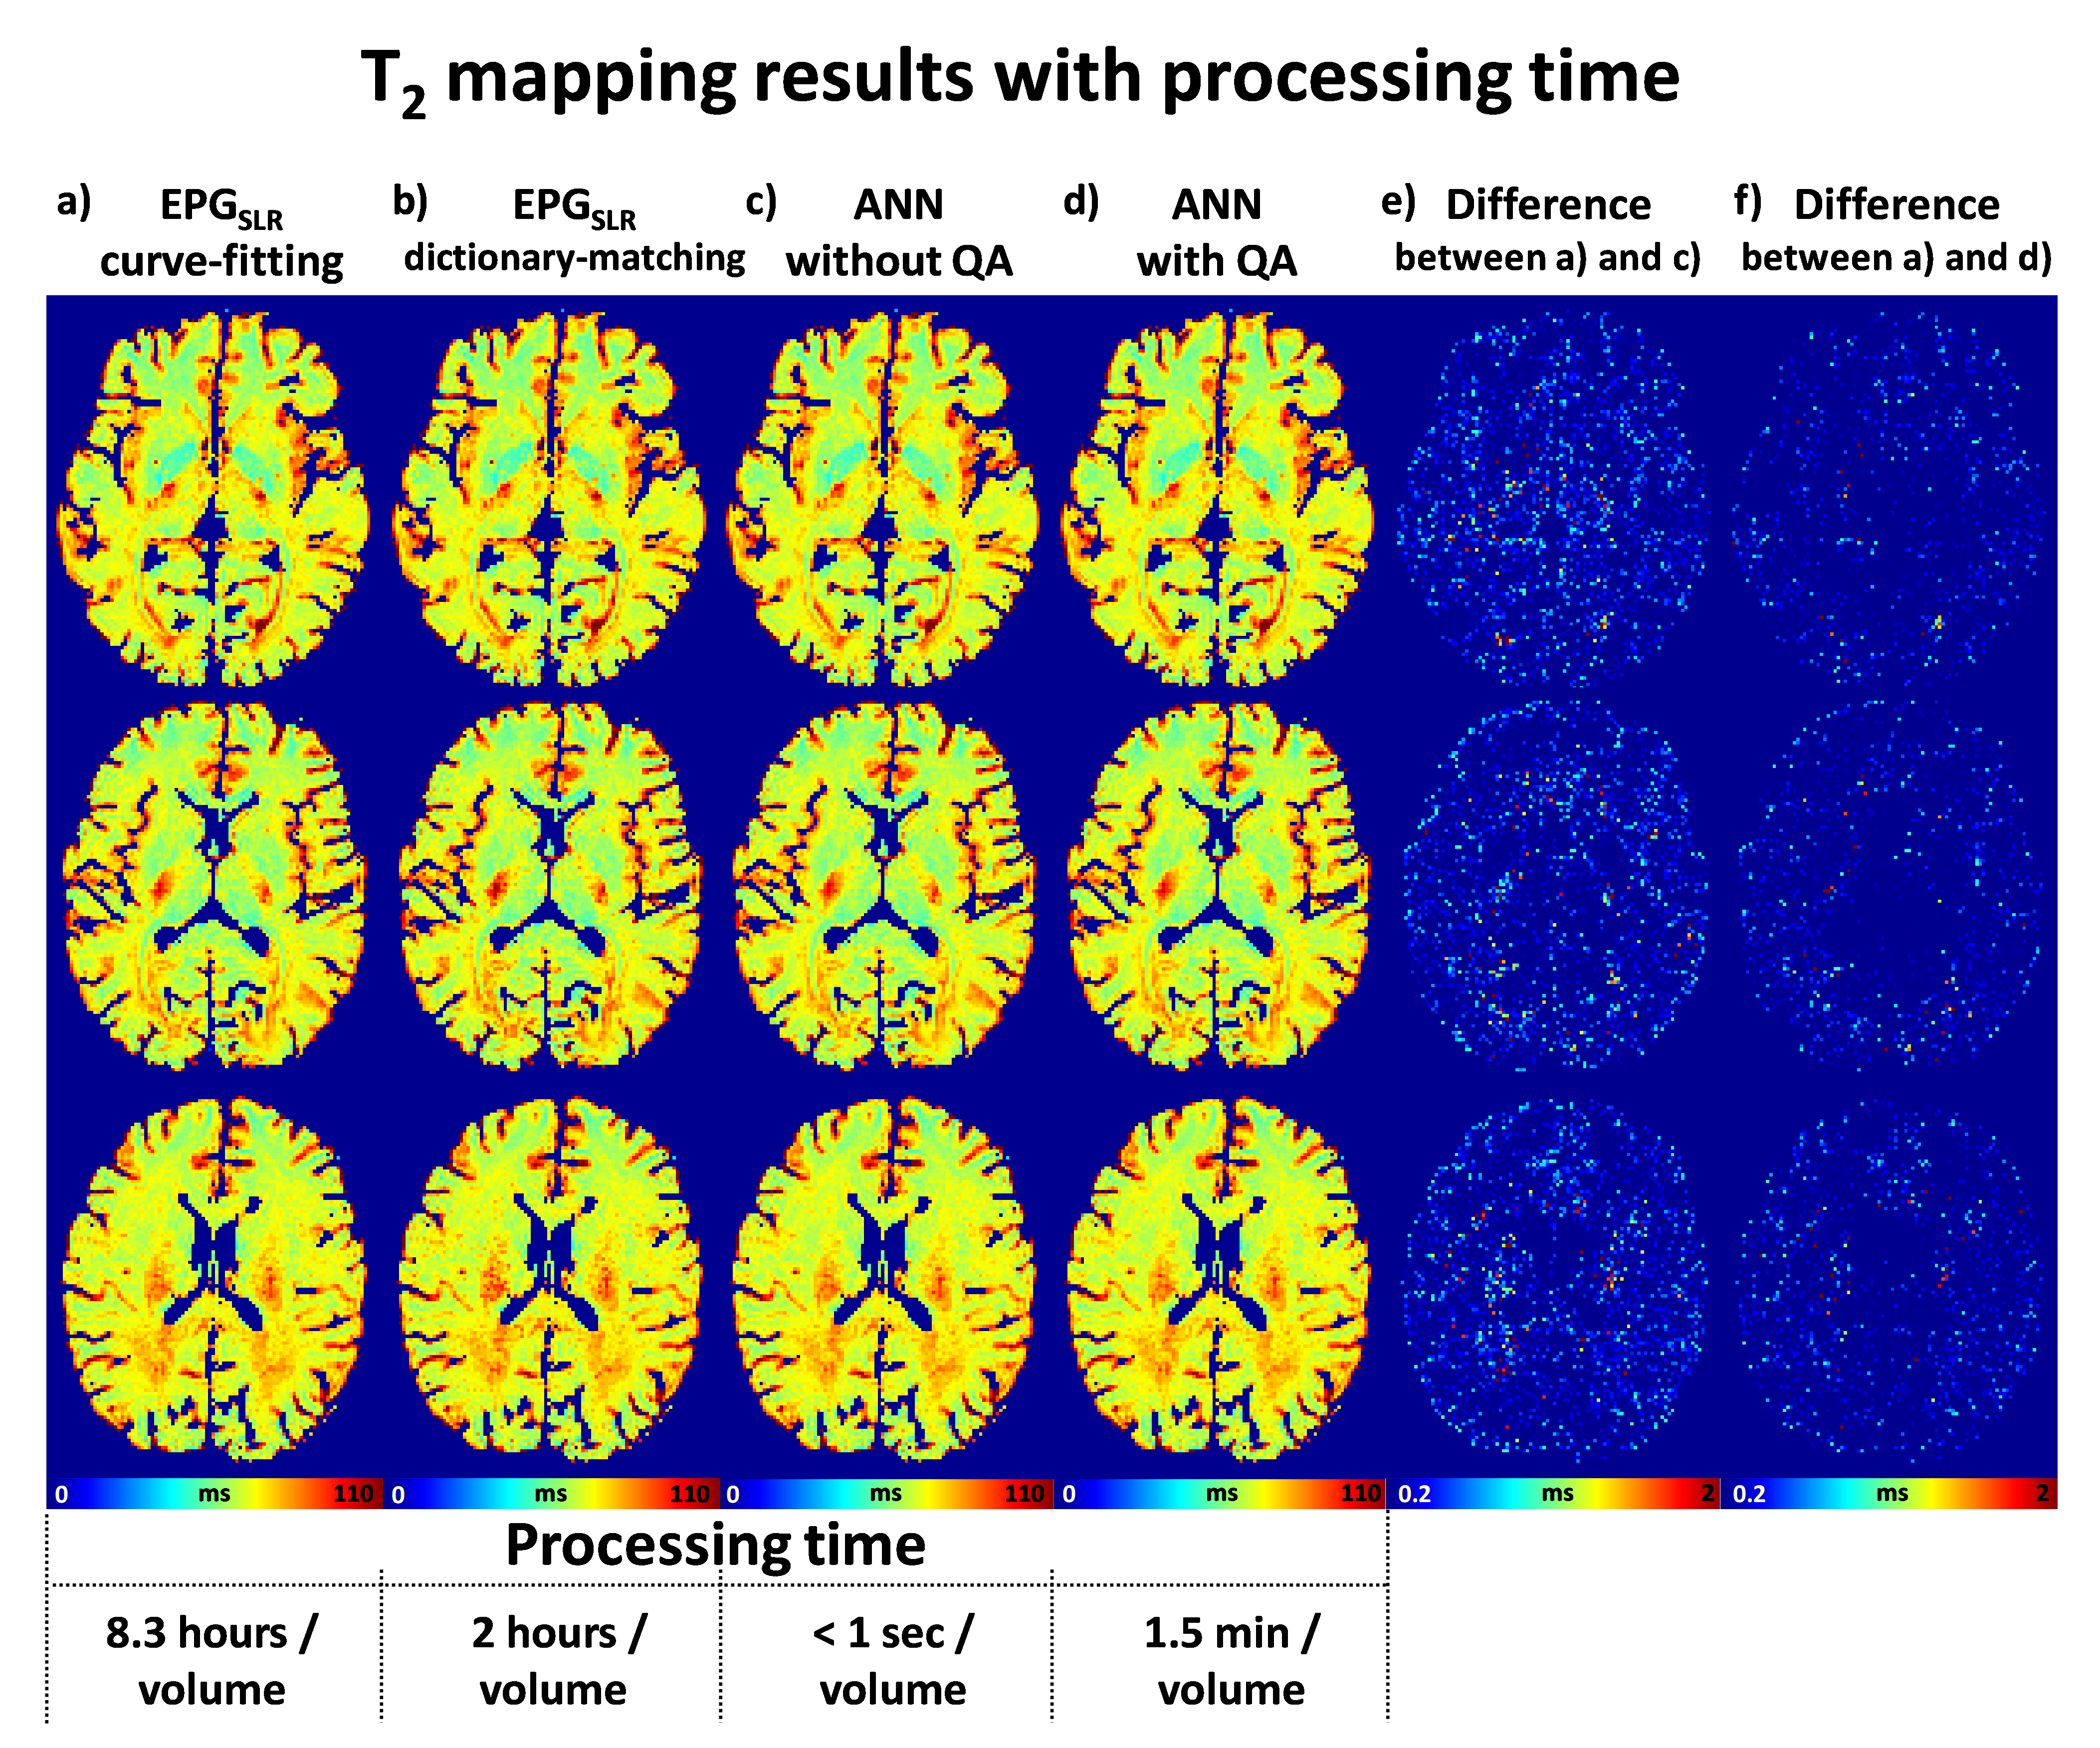
The mean T2 errors of the ANN for different training sets are shown in Figure 3. When compared to the results of in-vivo data training or synthetic data training, those of the combined data training showed significantly lower error values. The training data size did not affect the performance, indicating that training using one subject is sufficient. Figure 4 compares T2 maps from EPGSLR curve-fitting, EPGSLR dictionary-matching and ANN (without and with QA), all of which show nearly identical results. The mean T2 error of ANN maps was 0.26±0.35 ms (without QA), already very small, was reduced to 0.14±0.28 ms with QA, increasing the reliability of the T2 map. The processing time for the whole brain was less than a second for ANN and 1.5 min for ANN with QA. On the other hand, EPGSLR required 8.3 hours for EPGSLR curve-fitting and 2 hours for EPGSLR dictionary-matching. The simulation results (Fig. 5) suggest that the error increases as T2 and B1 get overly large or small (T2<20 ms or >200 ms and B1<0.7 or >1.4).Conclusion and Discussion
In this study, we developed a T2 mapping ANN that generates highly accurate T2 maps with an error of less than 0.3 ms within a second. Further improvement in accuracy was possible (0.14 ms error in 1.5 min), preventing unexpected errors in ANN. The ANN was designed for arbitrary input TE for scalability.Acknowledgements
This research was supported by the Brain Research Program through the National Research Foundation of Korea (NRF) funded by the Ministry of Science, ICT & Future Planning (NRF-2015M3C7A1031969)References
1. Jackson GD, Connelly A, Duncan JS, Grünewald RA, Gadian DG. Detection of hippocampal pathology in intractable partial epilepsy: Increased sensitivity with quantitative magnetic resonance T2 relaxometry. Neurology 1993;43(9):1793-1799.
2. Pell GS, Briellmann RS, Waites AB, Abbott DF, Lewis DP, Jackson GD. Optimized clinical T2 relaxometry with a standard CPMG sequence. J Magn Reson Imaging 2006;23(2):248-252.
3. Dunn TC, Lu Y, Jin H, Ries MD, Majumdar S. T2 relaxation time of cartilage at MR imaging: Comparison with severity of knee osteoarthritis. Radiology 2004;232(2):592-598.
4. Hennig J. Multiecho imaging sequences with low refocusing flip angles. Journal of Magnetic Resonance (1969) 1988;78(3):397-407.
5. Lebel RM, Wilman AH. Transverse relaxometry with stimulated echo compensation. Magn Reson Med 2010;64(4):1005-1014.
6. McPhee KC, Wilman AH. Transverse relaxation and flip angle mapping: Evaluation of simultaneous and independent methods using multiple spin echoes. Magn Reson Med 2017;77(5):2057-2065.
7. Bishop CM, Roach CM. Fast curve fitting using neural networks. Review of Scientific Instruments 1992;63(10):4450-4456.
8. Hornik K. Approximation capabilities of multilayer feedforward networks. Neural Networks 1991;4(2):251-257.
Figures