2276
Live monitoring of red and yellow bone marrow in long bones of the mouse at 9.4T1AIT, CIBM, Lasaunne, Switzerland, 2Laboratory of Regenerative Hematopoiesis, EPFL, Lausanne, Switzerland, 3Department of Oncology, CHUV, Lausanne, Switzerland
Synopsis
When hematopoiesis is compromised, as after lethal irradiation, the red BM is rapidly infiltrated by fat, then slowly recovers hematopoietic function following BM transplantation. Monitoring this red-to-yellow-to-red BM transition non-invasively using a tree point Dixon technique would provide important information on the reconstitution of the hematopoietic system that precedes blood formation as measured by bleeding, and thus be extremely useful in experimental hematology.
In this preliminary study we investigate the feasibility to track differences in bone marrow adiposity in the C57B6 mouse femur and tibia post-irradiation by monitoring the fat content.
Introduction
As the origin of blood production in mammals, the bone marrow (BM) is often considered as a homogeneous source of hematopoietic tissue. Depending on age, skeletal location, and physiological condition, however, it exists heterogeneously in the form of hematopoietic and adipocytic/fatty marrow reflected in its color from the presence of red hematopoietic cells or yellow lipid-filled fat cells1,2. When hematopoiesis is compromised, as after lethal irradiation, the red BM is rapidly infiltrated by fat, then slowly recovers hematopoietic function following BM transplantation. Monitoring this red-to-yellow-to-red BM transition by histology requires an important number of animals and is subject to inter-individual variation. Live, non-invasive monitoring of this transition would provide important information on the reconstitution of the hematopoietic system that precedes blood formation as measured by bleeding, and thus be extremely useful in experimental hematology.
Magnetic resonance imaging proposed different techniques to estimate fat content in tissue. One of the most commonly used is the Dixon’s technique3, used in combination with a spin-echo sequence to minimized signal loss due to B0 inhomogeneities from surrounding bones.
In this preliminary study we investigate the feasibility to track differences in bone marrow adiposity in the C57B6 mouse femur and tibia post-irradiation by monitoring the fat content. Mice were subjected to total-body irradiation scanned at the peak of aplasia occurring two weeks after BM transplant.
Materials and Methods
8-week old female C57BL6 mice were lethally irradiated in a gamma-irradiator (8.5 Gy, split dose, n=2) and transplanted with 125,000 total bone marrow cells via tail-vein injection. One healthy animal (age and sex matched) was used as control to validate the specificity of the technique (n=1).
Animals were anesthetized with 1.5% of isoflurane, respiration and temperature were monitored during the whole study. Animals were placed on their side and the leg was immobilized in contracted position. A triple point Dixon acquisition was performed using a spin-echo based sequence (TE=9ms, TR=1.5s) with ten coronal slices of 0.8 mm on a FOV 25x20 mm2 (acq. matrix 192x128). Three acquisitions were performed with the echo acquisition shifted of 0, 0.4 and 0.8 ms corresponding to the fat-water chemical shift of 1250Hz at 9.4T.
Images were reconstructed using a homebuilt Matlab script to extract water and fat maps. Phase unwrapping was performed using a toolbox from Matlab file exchange4.
At the end of the MR acquisitions, animals were sacrificed, tibia and femur were dissected, fixed in 10% formalin and decalcified in organic acid solution for hematoxylin-and-eosin staining of histological sections to validate MR Dixon acquisitions. Images of histological sections were obtained using a VS120 Virtual Slide Microscope (Olympus Life Sciences).
Results
Bone marrow of both femur and tibia were visible in the images acquired with MR, and the use of a spin-echo based sequence assured a refocusing of the bone marrow signal, thus minimizing signal loss due to bone magnetic susceptibility.
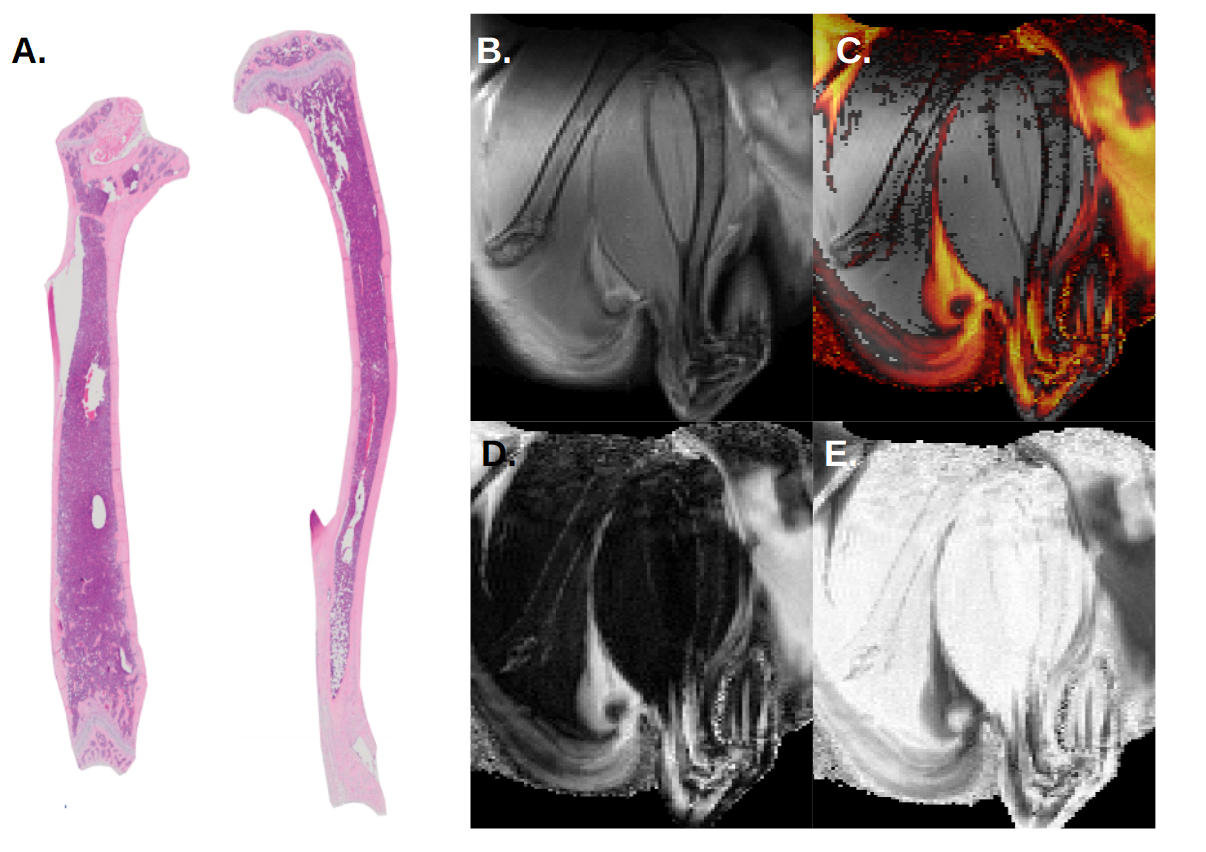
In homeostatic conditions, the control animal showed no visible BM adipose tissue in the femur, whereas the distal part of the tibia was highly adipocytic (Fig. 1), corresponding well to known distribution of red and yellow BM in the young adult C57B6 mouse5.
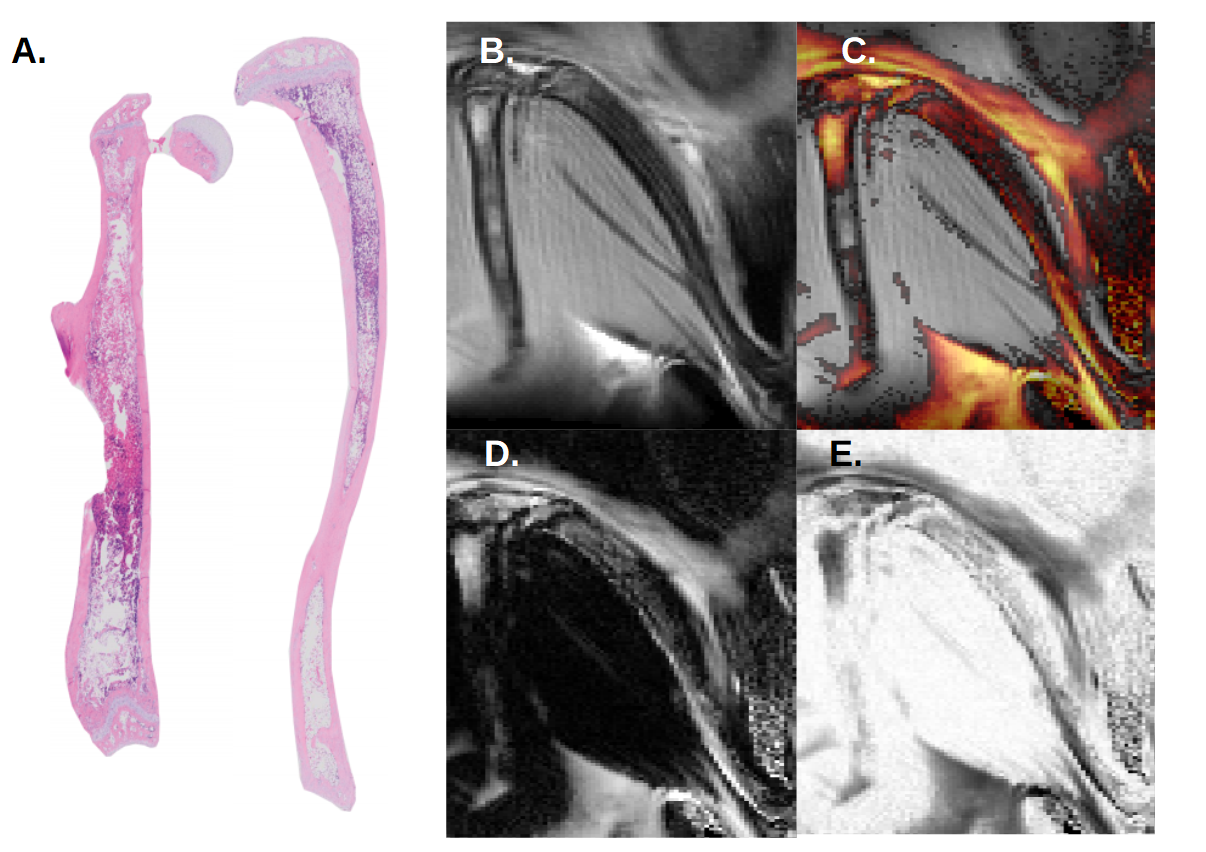
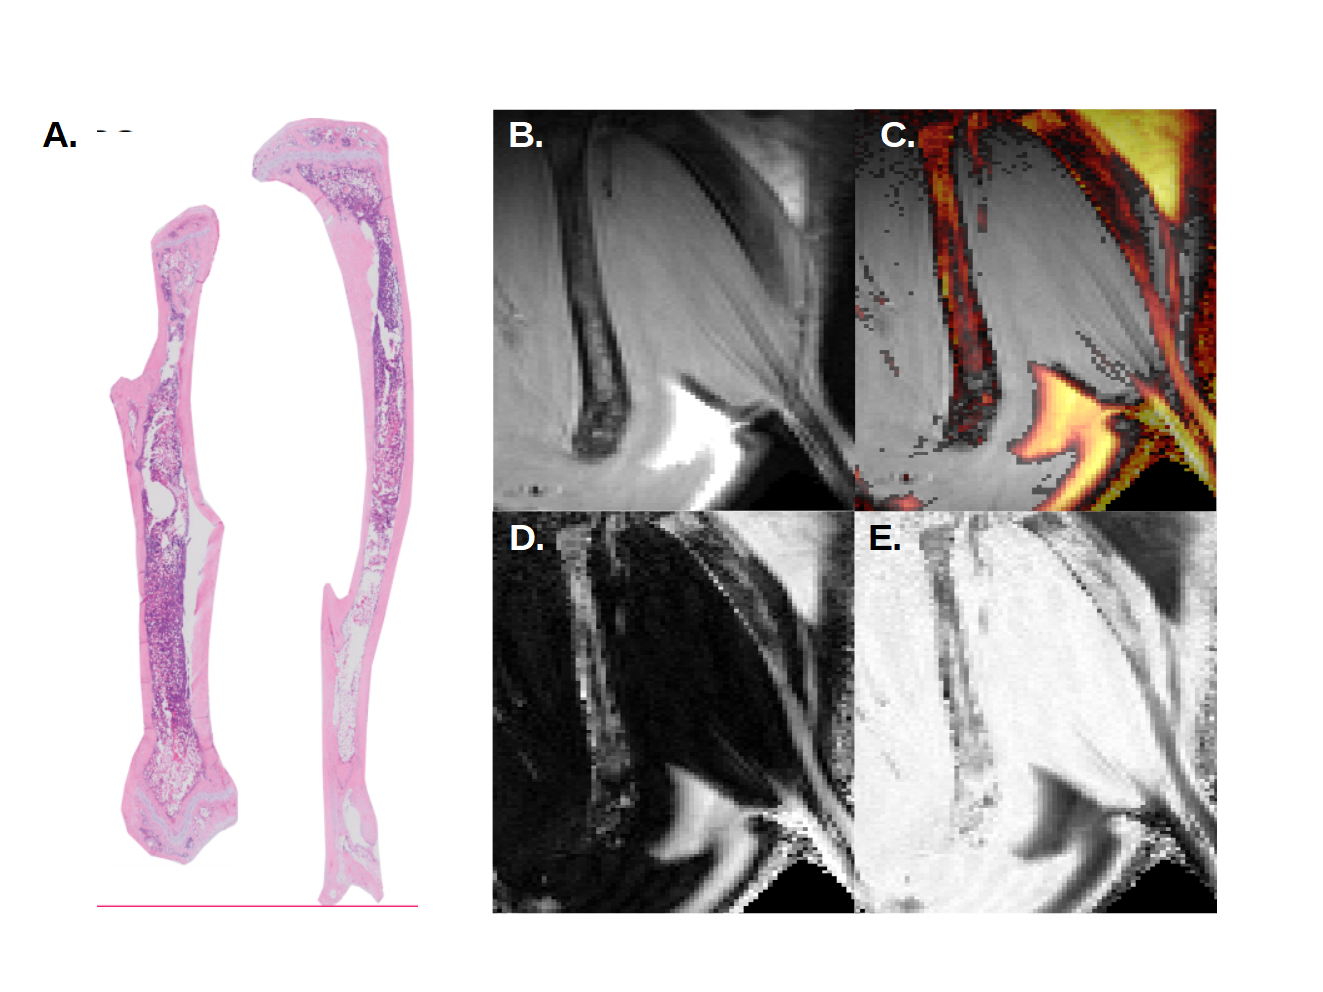
At day 16 post-transplant, MR images show fat signal in the poles or so-called epiphyses of the femur. Progression of fat infiltration in the tibia occurs along the proximal axis (Fig 2). Similar results were found at day 20 post-transplant, with an increased progression of adiposity in the femur (Fig 3). This timeline corresponds exactly to the peak of bone marrow fat content when assessed microscopically by histology.
Discussion and conclusions
Overall, Dixon’s MR images are in strong agreement with histological sections of the BM in homeostatic condition and correlate BM adipogenesis in mice having undergone lethal irradiation and BM transplantation.
Compared to control, Dixon’s images revealed a net progression of adipocytes along the proximal axis of the tibia. In the femur, the progression started from the epiphysis toward the metaphysis at the center of the bone as seen by histology.
These preliminary results are very promising and demonstrate the feasibility to follow BM adipogenesis in the mouse. A longitudinal study will be conducted to better characterize bone marrow regeneration.
Acknowledgements
Supported by the CIBM of the UNIL, UNIGE, HUG, CHUV, EPFL, Leenards and Jeantet foundation. The Naveiras lab is supported by Swiss National Science Foundation Professorship and the Fondation Pierre Mercier pour La Science.References
1Tavassoli, M. & Yoffey, J. M. Bone Marrow: Structure and Function. (Alan R. Liss, 1983).
2Kricun, M. E. Red‐yellow marrow conversion: Its effect on the location of some solitary bone lesions. Skeletal Radiol. 14, 10–19 (1985).
3Glover G. Multipoint Dixon technique for water and fat proton and susceptibility imaging, J Magn Reson Imaging 1991;1:521‐530.
4D. C. Ghiglia and M. D. Pritt, Two-Dimensional Phase Unwrapping: Theory, Algorithms and Software. New York: Wiley-Interscience, 1998. https://fr.mathworks.com/matlabcentral/fileexchange/22504-2d-phase-unwrapping-algorithms
5Scheller, E. L. et al. Region‐specific variation in the properties of skeletal adipocytes reveals regulated and constitutive marrow adipose tissues. Nat. Commun. 6, 7808 (2015).
Figures