2274
Using healthy volunteers to optimize amide proton transfer CEST sequences.1Wellcome Centre for Integrative Neuroimaging, FMRIB, Nuffield Department of Clinical Neurosciences, University of Oxford, Oxford, United Kingdom, 2IBME, Department of Engineering, University of Oxford, Oxford, United Kingdom
Synopsis
Optimising CEST sequences for clinical use is difficult due to the lack of representative phantoms. Healthy volunteers do not show the variation in pH or concentration that these sequences seek to detect. However, in this
Purpose/Background
Optimising CEST sequences for clinical use is difficult due to the lack of representative phantoms. Testing development sequences on patients is not always feasible, and healthy volunteers do not show the variation in pH or concentration that these sequences seek to detect. As a result, much of the sequence optimisation is done in phantoms or by numerical optimisation. These alternatives often fail to capture the in vivo environment as exact exchange parameters are unknown or hard to match using phantoms.
Here, we show how the inherent T1 sensitivity of CEST sequences [1], which is often seen as an unwanted effect, can be exploited to optimise CEST sensitivity directly in vivo using healthy volunteers.
The amount of CEST signal encoded in the longitudinal magnetisation of the bulk water per unit time depends on the T1 of the water. This generates an additional T1 sensitivity, encoded in the longitudinal magnetisation, that is specific to exchange processes [1]. The perceived CEST effect is often corrected for these T1 variations.
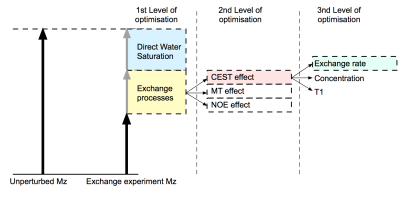
MTRasymmetry expresses the decreased longitudinal signal, due to exchange processes, as a fraction of the unperturbed magnetisation [1] (see Fig.1). Maximization of MTRasymmetry is commonly used to optimise CEST sequences, as an increase in MTRasymmetry reflects an increase in the exchange sensitivity and/or decrease of direct water saturation (DWS) of the sequence. The increase in MTRasymmetry is larger for voxels with longer T1, due to the T1 dependence [1].
Although differences in CEST exchange rates or concentrations are hard to detect in healthy volunteers, the difference in grey and white matter T1 is easily detected. We hypothesise that for exchange metrics which scale linearly with this additional T1 sensitivity, such as MTRasymmetry, the sequence conditions that maximize this CEST contrast metric are also the conditions that maximise the contrast between the grey and white matter in these maps.
Methods
A conventional 2D CEST sequence was implemented (3T Siemens Verio) with the following parameters; TR/TE=5000/23ms; CEST duty cycle=50%; fifty 20ms Gaussian CEST pulses 180°; Readout pulse 90°; 33-offset z-spectrum samples; Acquisition time 3:25min.
MTRasymmetry was calculated from CEST data acquired in a healthy volunteer to separate the contribution of the exchange processes from that of the DWS effect. Conventional T1 and T2 weighting of the images is removed by the normalisation process used to calculate MTRasymmetry.
Using FSL, grey matter, white matter and CSF masks were obtained from a structural scan. These masks were applied to the MTRasymmetry maps and the mean values and variances over several hundred voxels of the three types of tissue were calculated. This process was repeated for different CEST flip angles.
Conventional in silica optimisation using two-pool Bloch-McConnell simulations was also performed for comparison [2].
Results and Discussion
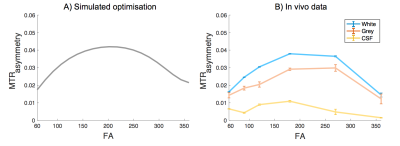
Fig. 2,3B confirms our hypothesis and shows that maximum contrast between the grey and white matter in the MTRasymmetry maps is obtained for the same flip angle that maximises the contribution of the exchange processes as obtained through numerical simulations (Fig. 3A). In line with theory, the CSF, which contains few exchangeable protons, shows little signal. Residual variation in the CSF signal is most likely due to the low SNR of this signal and to partial volume effects. For FA values close to 0° and 360°, where little exchange is expected, the MTRasymmetry contrast between the grey- and white matter disappears.
MTRasymmetry does not distinguish between NOE, MT and CEST. Using alternative definitions for the exchange maps, e.g. Lorentzian fitting, it is possible to also use this method to optimise sequences for specific exchange mechanisms (see Fig. 1). However, many applications (such as stroke) optimise only for maximum exchange sensitivity relative to DWS. This to boost the low CNR, which is expected to disappear in regions of low pH, generating maximum contrast. Post-acquisition model fitting methods are used to separate the different exchange contributions. As such, this method is not limited to MTRasymmetry but MTRasymmetry often suffices.
Factors other than T1, can induce a contrast between the grey and white matter in the MTRasymmetry maps. However, the origin of the contrast does not matter. As long as there is a detectable contrast that scales with the exchange process, optimisation and comparison of sequences in the same subject is possible.
Conclusion
We have demonstrated how the inherent T1 sensitivity, specific to exchange sequences, can be exploited to optimise CEST sequences directly in healthy volunteers where other variations in exchange markers are lacking. This method provides an effective way to optimise CEST sequences for in vivo use without the need for specially designed phantoms or numerical simulations.Acknowledgements
This work was funded by the EPSRC, Scatcherd European Scholarships and the Dunhill Medical Trust.References
[1] P.C.M. van Zijl, N.N. Yadav, Chemical exchange saturation transfer (CEST): what is in a name and what isn’t?, Magn. Reson. Med. 65 (2011) 927–48. doi:10.1002/mrm.22761.
[2] K. Murase, N. Tanki, Numerical solutions to the time-dependent Bloch equations revisited., Magn. Reson. Imaging. 29 (2011) 126–31. doi:10.1016/j.mri.2010.07.003.
Figures

Figure 1: Schematic of the different contributions to the decrease in longitudinal magnetisation. MTRasymmetry cancels the contribution of the direct water saturation (DWS) and expresses the exchange processes as a fraction of the bulk water. Maximising MTRasymmetry is therefore a simple way of optimising sequences for exchange sensitivity. Optimisation for specific exchange processes can be done by using alternative definitions (e.g. Lorentzian fitting). Provided that the defined contrast does not remove the inherent T1 sensitivity of the exchange processes, T1 contrast can be used to assess exchange sensitivity.

