2273
MR Elastography of the brain: Comparison between anisotropic and isotropic stiffness with age1Radiology, Ohio State University Wexner Medical Center, Columbus, OH, United States, 2Center for Biostatistics, Ohio State University Wexner Medical Center, Columbus, OH, United States
Synopsis
Noninvasive measurement of mechanical properties of brain tissue using Magnetic Resonance Elastography has been a promising method for investigating neurological disorders such as multiple sclerosis, hydrocephalus and Alzheimer’s. However, due to regional and directional dependency of brain stiffness, estimating anisotropic stiffness is important. Previous studies have investigated anisotropic and isotropic stiffness separately but none of them investigated the two together. Objective of this study is to investigate both isotropic and anisotropic stiffness together and independently compare with age and with each other. Results demonstrated a significant decrease in isotropic and anisotropic stiffness with age in some regions of the brain.
Introduction
Physiological aging of the brain involves degeneration of neurons[1]. Any changes in the extra cellular matrix can impact its mechanical properties such as stiffness[2]. As a result of aging, changes in brain stiffness have been reported in previous studies[3-5]. Noninvasive measurement of mechanical properties of the brain tissue has been studied using Magnetic Resonance Elastorgraphy(MRE) in neurological disorders such as multiple sclerosis[6], hydrocephalus[7,8], and Alzheimer’s[9]. However, due to regional and directional dependency of brain stiffness[4,5,10], estimating the anisotropic stiffness is important. As per our knowledge, anisotropic stiffness has been studied only in white matter and corticospinal tracts in in-vivo human brains[11,12] and gray matter and white matter in ex-vivo lamb brains[13]. Other studies only studied isotropic measurements in different brain regions[3,14,15]. This is the first study that investigated both isotropic and anisotropic together and also independently compared the two with age and with each other. Objective of this study is to understand both the isotropic and anisotropic brain stiffness in healthy volunteers as a function of age.Methods
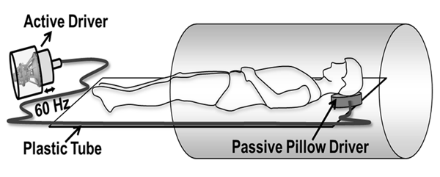
Brain MRE and Diffusion Tensor Imaging(DTI) was performed on 28 healthy subjects(n = 17 males, n = 11 females; mean age: 34.3 years, age range 18-62 years). A written informed consent was obtained from each subject after an IRB approval. All imaging was performed on a 3T MRI scanner(Tim Trio, Siemens Healthcare, Erlangen, Germany). Figure 1 shows shows the experimental setup with a pneumatic driver(Resoundant Inc, Rochester, MN). MRE and DTI scans were performed subsequently with the same resolution. FOV:320mmx320mm; slice-thickness=2.5mm;resolution:2.5x2.5x2.5mm3;matrix:128x128; scan time ~20minutes.
MRE: A GRE MRE sequence with imaging parameters: FA:16°; TR/TE: 25/20.7ms; motion encoding gradient:60Hz; phase offsets:4; slices:55-60; Masks of different brain regions were generated using SPM12 software(The FIL Methods group, UCL, UK). Curl processing was performed to remove longitudinal waves and directional filter was applied to remove reflected waves. Isotropic shear stiffness maps were generated using MRE-Lab software(Mayo Clinic, Rochester, MN, USA) using 3D Local Frequency Estimation(LFE) inversion algorithm.
DTI: A diffusion-weighted (DW) single shot spin-echo echo-planar imaging multi-slice sequence was used with imaging parameters: diffusion encoding directions=256; TR=6400ms; TE=87ms; b-value=1000s/mm2; averages=1. A spatial-spectral filter was applied to the first harmonic of MRE displacements using a spectral window(5x5x5) followed by Helmholtz decomposition to separate compressional and shear components. Principal frequency of the spatially-spectrally filtered first harmonic displacement data was computed[16]. Approximate wavenumbers in each direction was obtained followed by narrowband spatial spectral filters with window of +/- 20 rad/m. Stiffness tensor was solved using the following equation of motion:
Cii (δ2ujk(nl)/δ2xjk(nl)) = ρω2ujk(nl)
where, u(nl) and xl(l=1,2,3) represent the directionally filtered displacements and the differential parameters along the local axes (n1,n2,n3) respectively. C11, C22, C33 are the compressional components and C44, C55, C66 are shear components parallel and perpendicular to the fibres.
Statistical analysis was performed using Spearman correlation method(SAS14, SAS Institute Inc, NC) and graphs were generated using Minitab 17(Minitab Inc, PA).
Results
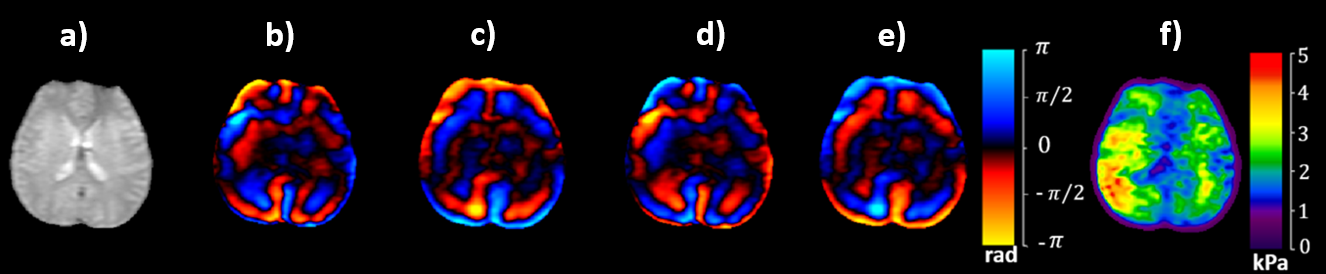
Figure 2 shows the magnitude, snapshots of 4 phase offsets and corresponding stiffness map.
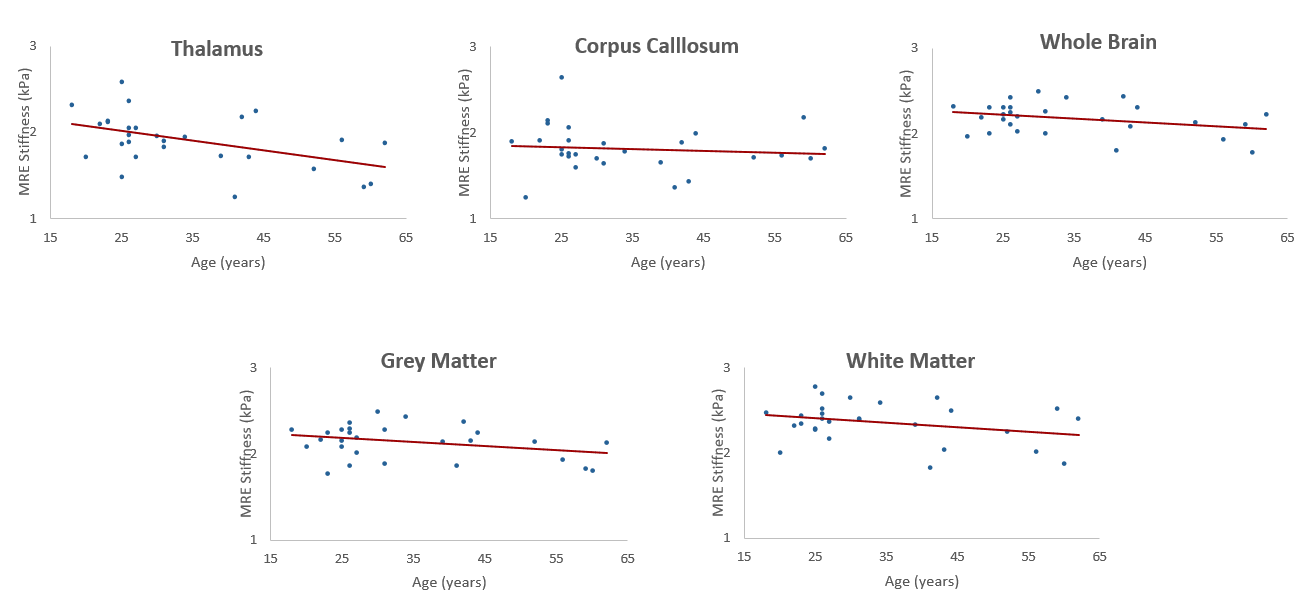
Figure 3 shows spearman correlation for isotropic stiffness versus age. Moderate negative correlation (rs=-0.43) with a significant p=0.02 was found in thalamus. Other regions did not show any significant correlation.
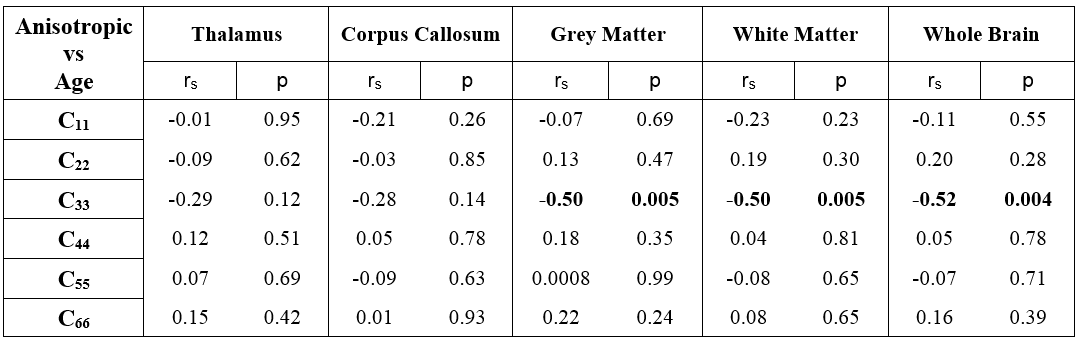
Table 1 shows spearman correlation for anisotropic stiffness versus age. C33 demonstrated a significant decrease with age in whole brain (rs=-0.52; p=0.004), gray matter (rs=-0.50; p=0.005) and white matter (rs=-0.50; p=0.005). C11, C22, C44, C55 and C66 demonstrated no significant trend with age.
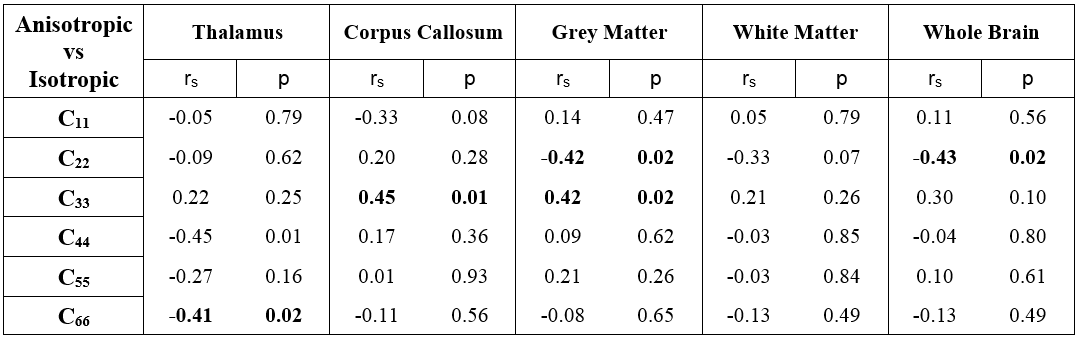
Table 2 shows spearman correlation for anisotropic versus isotropic stiffness. C33 showed moderate positive correlation with isotropic stiffness in corpus callosum(rs=0.45; p=0.01) and gray matter(rs=0.42; p=0.02). However, C22 showed moderate negative correlation with isotropic stiffness in whole brain(rs=-0.43; p=0.02) and gray matter(rs=-0.42; p=0.02). C11, C44, C55, and C66 did not demonstrate any trend with isotropic stiffness.
Discussion
A decrease in brain isotropic stiffness with age was more evident in thalamus than corpus callosum, white matter, gray matter and whole brain and this trend agrees with previous studies[3, 4, 17]. On the other hand, a decrease in anisotropic stiffness component(C33) was found in white matter, gray matter and whole brain with age. While comparing isotropic with anisotropic stiffness, there was a moderate positive correlation found in anisotropic component C33 in corpus callosum and gray matter while a moderate negative correlation in anisotropic direction C22 in whole brain and gray matter and C66 in thalamus. This suggests that brain stiffness varies regionally, and is directional and age dependent.
Conclusion
In conclusion, measurement of isotropic and anisotropic stiffness together provides more accurate information about brain stiffness as compared to just one alone.Acknowledgements
NIH-NHLBI: R01HL124096
Mayo clinic (Dr. Richard Ehman for providing the pillow driver)
References
[1] Morrison, John H., and Patrick R. Hof. "Life and death of neurons in the aging brain." Science 278.5337 (1997): 412-419.
[2] Fung, Y.C., 2013. Biomechanics: mechanical properties of living tissues. Springer Science & Business Media.
[3] Sack, Ingolf, et al. "The impact of aging and gender on brain viscoelasticity." Neuroimage 46.3 (2009): 652-657.
[4] Arani, Arvin, et al. "Measuring the effects of aging and sex on regional brain stiffness with MR elastography in healthy older adults." Neuroimage 111 (2015): 59-64.
[5] Margulies, Susan S., and M. T. Prange. "Regional, directional, and age-dependent properties of the brain undergoing large deformation." J Biomech Eng 124 (2002): 244-252.
[6] Wuerfel, Jens, et al. "MR-elastography reveals degradation of tissue integrity in multiple sclerosis." Neuroimage 49.3 (2010): 2520-2525.
[7] Streitberger, Kaspar‐Josche, et al. "In vivo viscoelastic properties of the brain in normal pressure hydrocephalus." NMR in Biomedicine 24.4 (2011): 385-392.
[8] Freimann, Florian Baptist, et al. "Alteration of brain viscoelasticity after shunt treatment in normal pressure hydrocephalus." Neuroradiology 54.3 (2012): 189-196.
[9] Murphy, Matthew C., et al. "Decreased brain stiffness in Alzheimer's disease determined by magnetic resonance elastography." Journal of magnetic resonance imaging 34.3 (2011): 494-498.
[10] Scahill, Rachael I., et al. "A longitudinal study of brain volume changes in normal aging using serial registered magnetic resonance imaging." Archives of neurology 60.7 (2003): 989-994.
[11] Romano, Anthony, et al. "In vivo waveguide elastography of white matter tracts in the human brain." Magnetic resonance in medicine 68.5 (2012): 1410-1422.
[12] Romano, Anthony, et al. "In vivo waveguide elastography: effects of neurodegeneration in patients with amyotrophic lateral sclerosis." Magnetic resonance in medicine 72.6 (2014): 1755-1761.
[13] Romano, Anthony J., et al. "Waveguide magnetic resonance elastography of the heart." Proc. ISMRM 2013 Annu. Conf. No. 2431. 2013.
[14] Feng, Yuan, et al. "Measurements of mechanical anisotropy in brain tissue and implications for transversely isotropic material models of white matter." Journal of the mechanical behavior of biomedical materials 23 (2013): 117-132.
[15] Kruse, Scott A., et al. "Magnetic resonance elastography of the brain." Neuroimage 39.1 (2008): 231-237.
[16] McGee, K.P., D. Lake, Y. Mariappan, et al.;, Calculation of shear stiffness in noise dominated magnetic resonance elastography data based on principal frequency estimation. Phys Med Biol, 2011. 56(14): p. 4291-309.
[17] Sack, I., Streitberger, K.J., Krefting, D., Paul, F. and Braun, J., 2011. The influence of physiological aging and atrophy on brain viscoelastic properties in humans. PloS one, 6(9), p.e23451.
Figures