2271
Towards Quantifying pO2 via 1H Longitudinal Relaxation of Water: Quantifying the Confounds1Physics, Washington University in St Louis, St Louis, MO, United States, 2Radiology, Washington University in St Louis, Saint Louis, MO, United States, 3Siteman Cancer Center, Washington University in St Louis, Saint Louis, MO, United States, 4Internal Medicine, Washington University in St Louis, Saint Louis, MO, United States, 5Chemistry, Washington University in St Louis, Saint Louis, MO, United States
Synopsis
Crosslinked bovine serum albumin phantoms are used as tissue surrogates/mimics to investigate the physiologic confounds to R1-based tissue-O2 quantification under precise, laboratory controlled conditions. The relaxation-rate constants for both the rapidly relaxing and the slowly relaxing populations are affected by changes in temperature, pH, and protein concentration.
INTRODUCTION:
Low oxygen levels in the body are a hallmark of many diseases and disorders, including cancer, cardiovascular disease, diabetes, and placental dysfunction. Established methods for quantifying dissolved oxygen (pO2) in tissue are invasive.
O2 is weakly paramagnetic, therefore in principle the MR-measured water 1H longitudinal relaxation-rate constant (R1) is linearly related to [O2] via the equation $$R_{1}=R_{1,0}+r_{1}\times[O_2],$$ in which R1 is the measured longitudinal relaxation-rate constant, r1 is the “relaxivity” of oxygen, R1,0 is the rate constant in the absence of O2, and [O2] is the concentration of dissolved O2 in the tissue water. Significant challenges must be overcome in vivo when quantifying tissue pO2 via measured R1, including blood flow, which can mask the comparatively small contribution of dissolved O2 to the overall relaxation process.1
In practice, due to 1H magnetization transfer (MT) between water and semi-solid macromolecular constituents, water 1H longitudinal relaxation in mammalian tissue is well modelled as a biexponential, rather than a monoexponential, function.2 To first approximation, this reflects two distinct apparent water populations in slow exchange. This biexponential function can be written as $$M_z(t)=A+[B\cdot F\cdot\exp(-tR_{1,fast})]+[B\cdot(1-F)\cdot\exp(-tR_{1,slow})].$$ Here, A is a constant offset, B is a constant amplitude, R1,fast is the longitudinal relaxation-rate constant for the rapidly relaxing water population with fraction F, and R1,slow is the longitudinal relaxation-rate constant for the slowly relaxing water population, with fraction 1-F.
In addition to blood flow, physiologic confounds such as temperature, pH, and protein concentration are expected to modulate MT and, thus, to have an effect on R1 measurements. Phantom studies allow for precise control and characterization of such factors, allowing for improved signal modelling. Herein, in anticipation of developing R1-based pO2 maps, we apply crosslinked bovine serum albumin (x-BSA) samples as tissue surrogates/mimics to characterize the influence of physiologically-relevant variations in temperature, pH, and macromolecule (protein) concentration on R1.
METHODS:
x-BSA samples were created by crosslinking varying concentrations of BSA (10-40%, by weight) in a phosphate-buffered saline (PBS) solution with glutaraldehyde. Sample pH of the BSA in PBS solution was altered through the addition of sodium hydroxide (NaOH) or hydrochloric acid (HCl) prior to crosslinking. Data were collected using a 500-MHz Agilent/Varian high-resolution NMR spectrometer. R1 measurements employed a Modified Fast Inversion Recovery3 (MFIR) pulse sequence with 128 exponentially spaced inversion times ranging from 5 ms to 7.5 s.
Longitudinal relaxation-rate constants (R1,slow, R1,fast) and the fraction of the signal associated with the rapidly relaxing water population (F) were quantified as a function of variations in temperature, pH, and macromolecule concentration. Each parameter estimate was the result of jointly analyzing six replicate datasets (triplicate determinations with each of two xBSA samples) with R1,slow, R1,fast, and F as common parameters, using Bayesian probability theory-based methods.4
RESULTS & DISCUSSION:
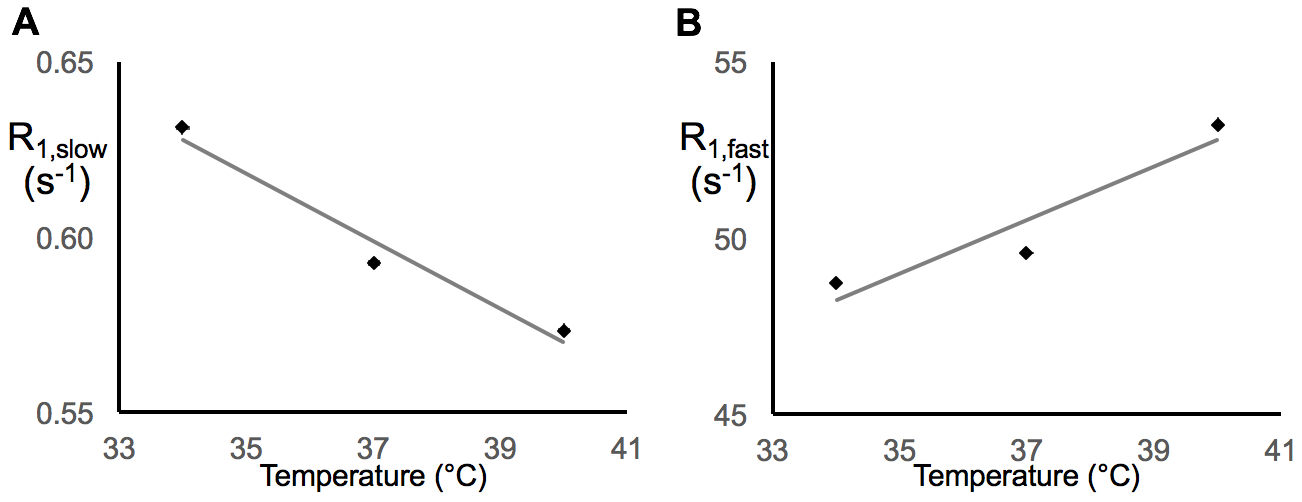
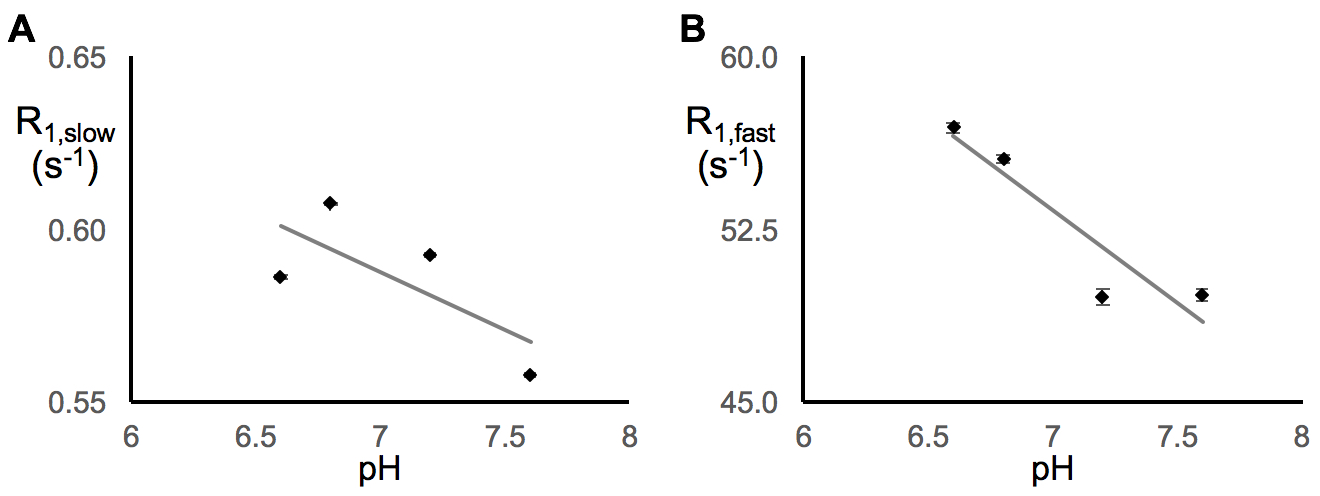
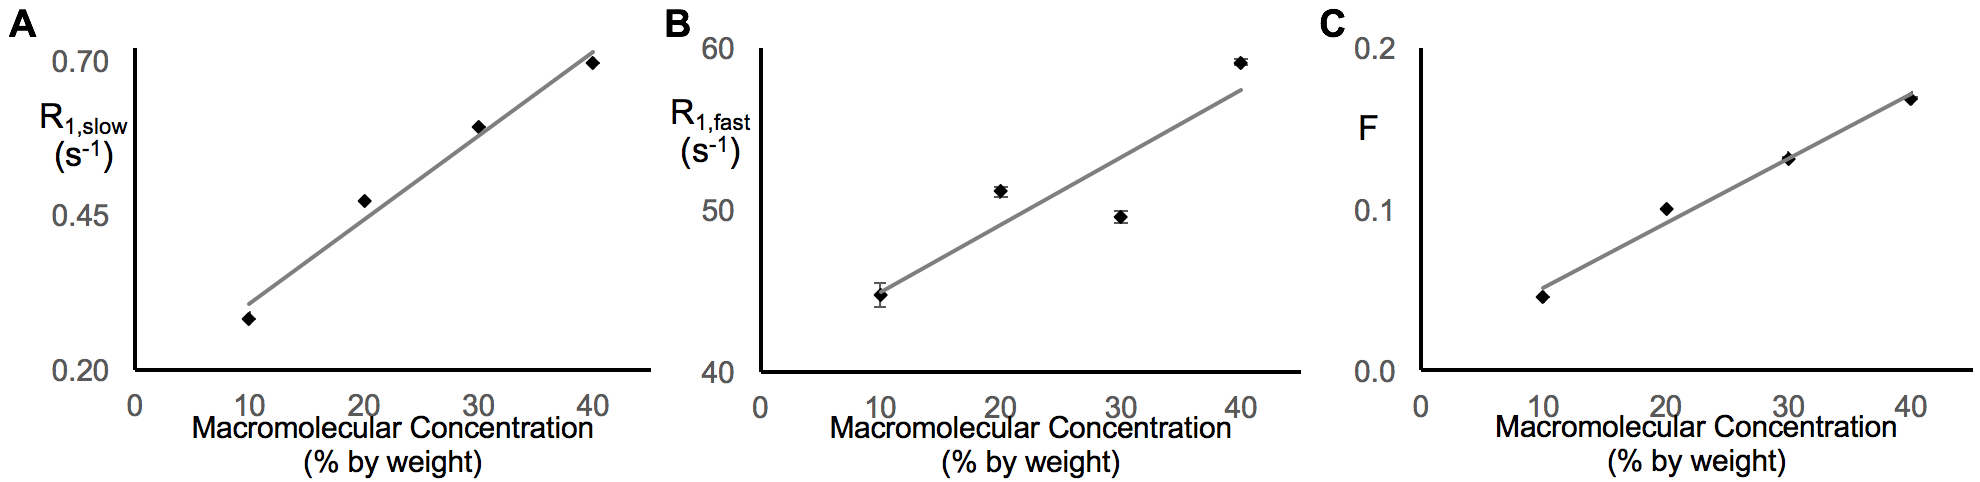
In earlier work,5 we showed that R1,slow is linearly proportional to pO2. Herein, R1,slow (and R1,fast) is found to be a linear function of temperature, pH, and protein concentration over physiologically relevant ranges (Figs. 1-3). Thus, accurate correlation of R1,slow with tissue pO2 will either require knowledge of tissue temperature, pH, and protein concentration, or that baseline control R1 measurements are made at known tissue pO2 (e.g., Oxford Optronix OxyLiteTM O2 microprobe).
Tissue temperature can be determined via the temperature-dependent water 1H chemical shift relative to a reference resonance, e.g., NAA in brain.6 pH is known to vary across tissue types, particularly in tumor vs. healthy tissue7, but can be determined via 31P and 1H MRS (e.g., via the chemical shifts of inorganic phosphate or (±) 2-imidazole-1-yl-3-ethoxycarbonyl propionic acid (IEPA)).8,9 Finally, varying tissue types have differing, but known, protein concentrations, varying from 20-40% for in vivo cells.10 Again, baseline control R1 measurements made at known tissue pO2 will account for these potential confounds and lead to accurate MRI R1,slow-based maps of tissue pO2.
In summary: (i) 1H longitudinal relaxation of water in x-BSA phantoms is well-characterized as biexponential, (ii) x-BSA phantoms allow for precise characterization of physiologic dependencies of longitudinal relaxation rate constants, R1,slow and R1,fast, and (iii) R1,slow and R1,fast are linearly dependent upon temperature, pH, and macromolecule concentration over physiologically relevant ranges.
Acknowledgements
Research supported, in part, by the McDonnell Center for Cellular and Molecular Neurobiology (JA) and National Institute of Health grants: P50 CA094056, R01 HD086323, 5T32 EB014855, and the Small Animal Cancer Imaging Shared Resource of the Alvin J. Siteman Cancer Center (P30 CA091842).References
- Beeman, S.C., et al., O2 -sensitive MRI distinguishes brain tumor versus radiation necrosis in murine models. Magn Reson Med, 2016. 75(6): p. 2442-7.
- Prantner, A.M., et al., Magnetization transfer induced biexponential longitudinal relaxation. Magnetic Resonance in Medicine, 2008. 60(3): p. 555-563.
- Gupta, R.K., et al., A Modified Fast Inversion-Recovery Technique for Spin-Lattice Relaxation Measurements. Journal of Magnetic Resonance, 1980. 38(3): p. 447-452.
- G. Larry Bretthorst, Bayesian Analysis of Common NMR Problems, a Bayesian signal analysis toolbox available for free download at: http://bayesiananalysis.wustl.edu/index.html
- Meinerz, K., et al., Quantifying pO2-Driven Longitudinal Relaxation of Water 1H Spins in the Presence of Magnetization Transfer: Cross-Linked BSA as a Tissue Mimic [abstract]. In: Proceedings of the ISMRM 25th Annual Meeting & Exhibition; 2017 April 22-27; Honolulu, HI. Abstract 3025.
- Zhu, M., et al., Improved calibration technique for in vivo proton MRS thermometry for brain temperature measurement. Magn Reson Med, 2008. 60(3): p. 536-41.
- Gerweck, L.E. and K. Seetharaman, Cellular pH gradient in tumor versus normal tissue: potential exploitation for the treatment of cancer. Cancer Res, 1996. 56(6): p. 1194-8.
- Ackerman, J.J., et al., The NMR chemical shift pH measurement revisited: analysis of error and modeling of a pH dependent reference. Magn Reson Med, 1996. 36(5): p. 674-83.
- Raghunand, N., Tissue pH measurement by magnetic resonance spectroscopy and imaging. Methods Mol Med, 2006. 124: p. 347-64.
- Fulton, A.B., How
crowded is the cytoplasm? Cell, 1982. 30(2):
p. 345-7
Figures