2270
Aqueous and Non-aqueous T1 relaxation in brain under six diverse initial conditions1Physics, University of British Columbia, Vancouver, BC, Canada, 2Radiology, University of British Columbia, Vancouver, BC, Canada
Synopsis
A consistent view of T1 relaxation in white matter remains elusive. We use an NMR spectrometer to observe white matter T1 relaxation behavior in both aqueous and non-aqueous protons following six diverse initial magnetizations. The data is analyzed in the context of both an unrestricted and restricted four pool model. We show how the observed multi-component T1 relaxation behavior depends sensitively on the initial conditions of the different pools, suggesting that great care must be taken in interpreting T1 relaxation measurements.
Introduction
T1 relaxation of white matter is the source of much disagreement regarding: the measured T1 value,1,2 whether one T1 component is sufficient,3,4,5,6,7,8 and whether T1 components can be associated with specific protons pools.5,6,7,8,9,10,11,12,13 To clarify some of these issues, here we use NMR spectroscopy to observe T1 relaxation in aqueous and non-aqueous protons (typically invisible to MRI scanners) during recovery from six different non-equilibrium states. We then analyze our data in both general and model-specific ways.
If longitudinal relaxation in an arbitrary system (Fig 1A) is modeled by coupled, first-order differential equations, then the general solution as a function of recovery time τR is 13,14: $$\mathbf{m}(\tau_R)=\sum_{j=1}^N C_j\mathbf{v}_j \exp(-\tau_R/T_{1,j}^{*}).$$Here, m is a vector whose components are each pool’s reduced magnetizations (0<mi<1, 0=thermal equilibrium, 0.5=zero magnetization, 1=inverted magnetization), Cj depends on initial conditions, vj is the jth eigenvector, 1/T1,j* is the jth effective T1 time, and N the number of pools. This equation also describes measured data that is the sum of two or more pools.
The above equation implies an unrestricted multi-pool analysis, since no assumptions about pool connectivity are made. We also fit a specific four-pool model,7,13,15,16,17,18 henceforth called the restricted FPM. In this model for WM (Fig. 1B), the proton pools are 1) non-aqueous myelin, 2) myelin water, 3) intra/extra-cellular (IE) water, 4) non-aqueous non-myelin, and exchange only occurs between pools 1↔2, 2↔3, and 3↔4.
Materials and Methods
A chilled bovine brain was obtained about 30 hours after harvesting (Innovative Research, Novi, MI, USA). Samples of white (WM) and grey matter (GM) were excised, sealed in short sections of 5 mm NMR tubes between Teflon spacers, and chilled until use (samples: WM-sp1 and WM-sp2 are splenium WM, WM-fr is frontal WM, GM-bg is basal ganglia grey matter). A 4.7 T homebuilt NMR spectrometer with a broadband solenoidal probe was used. The sample temperature was regulated at 37 oC.
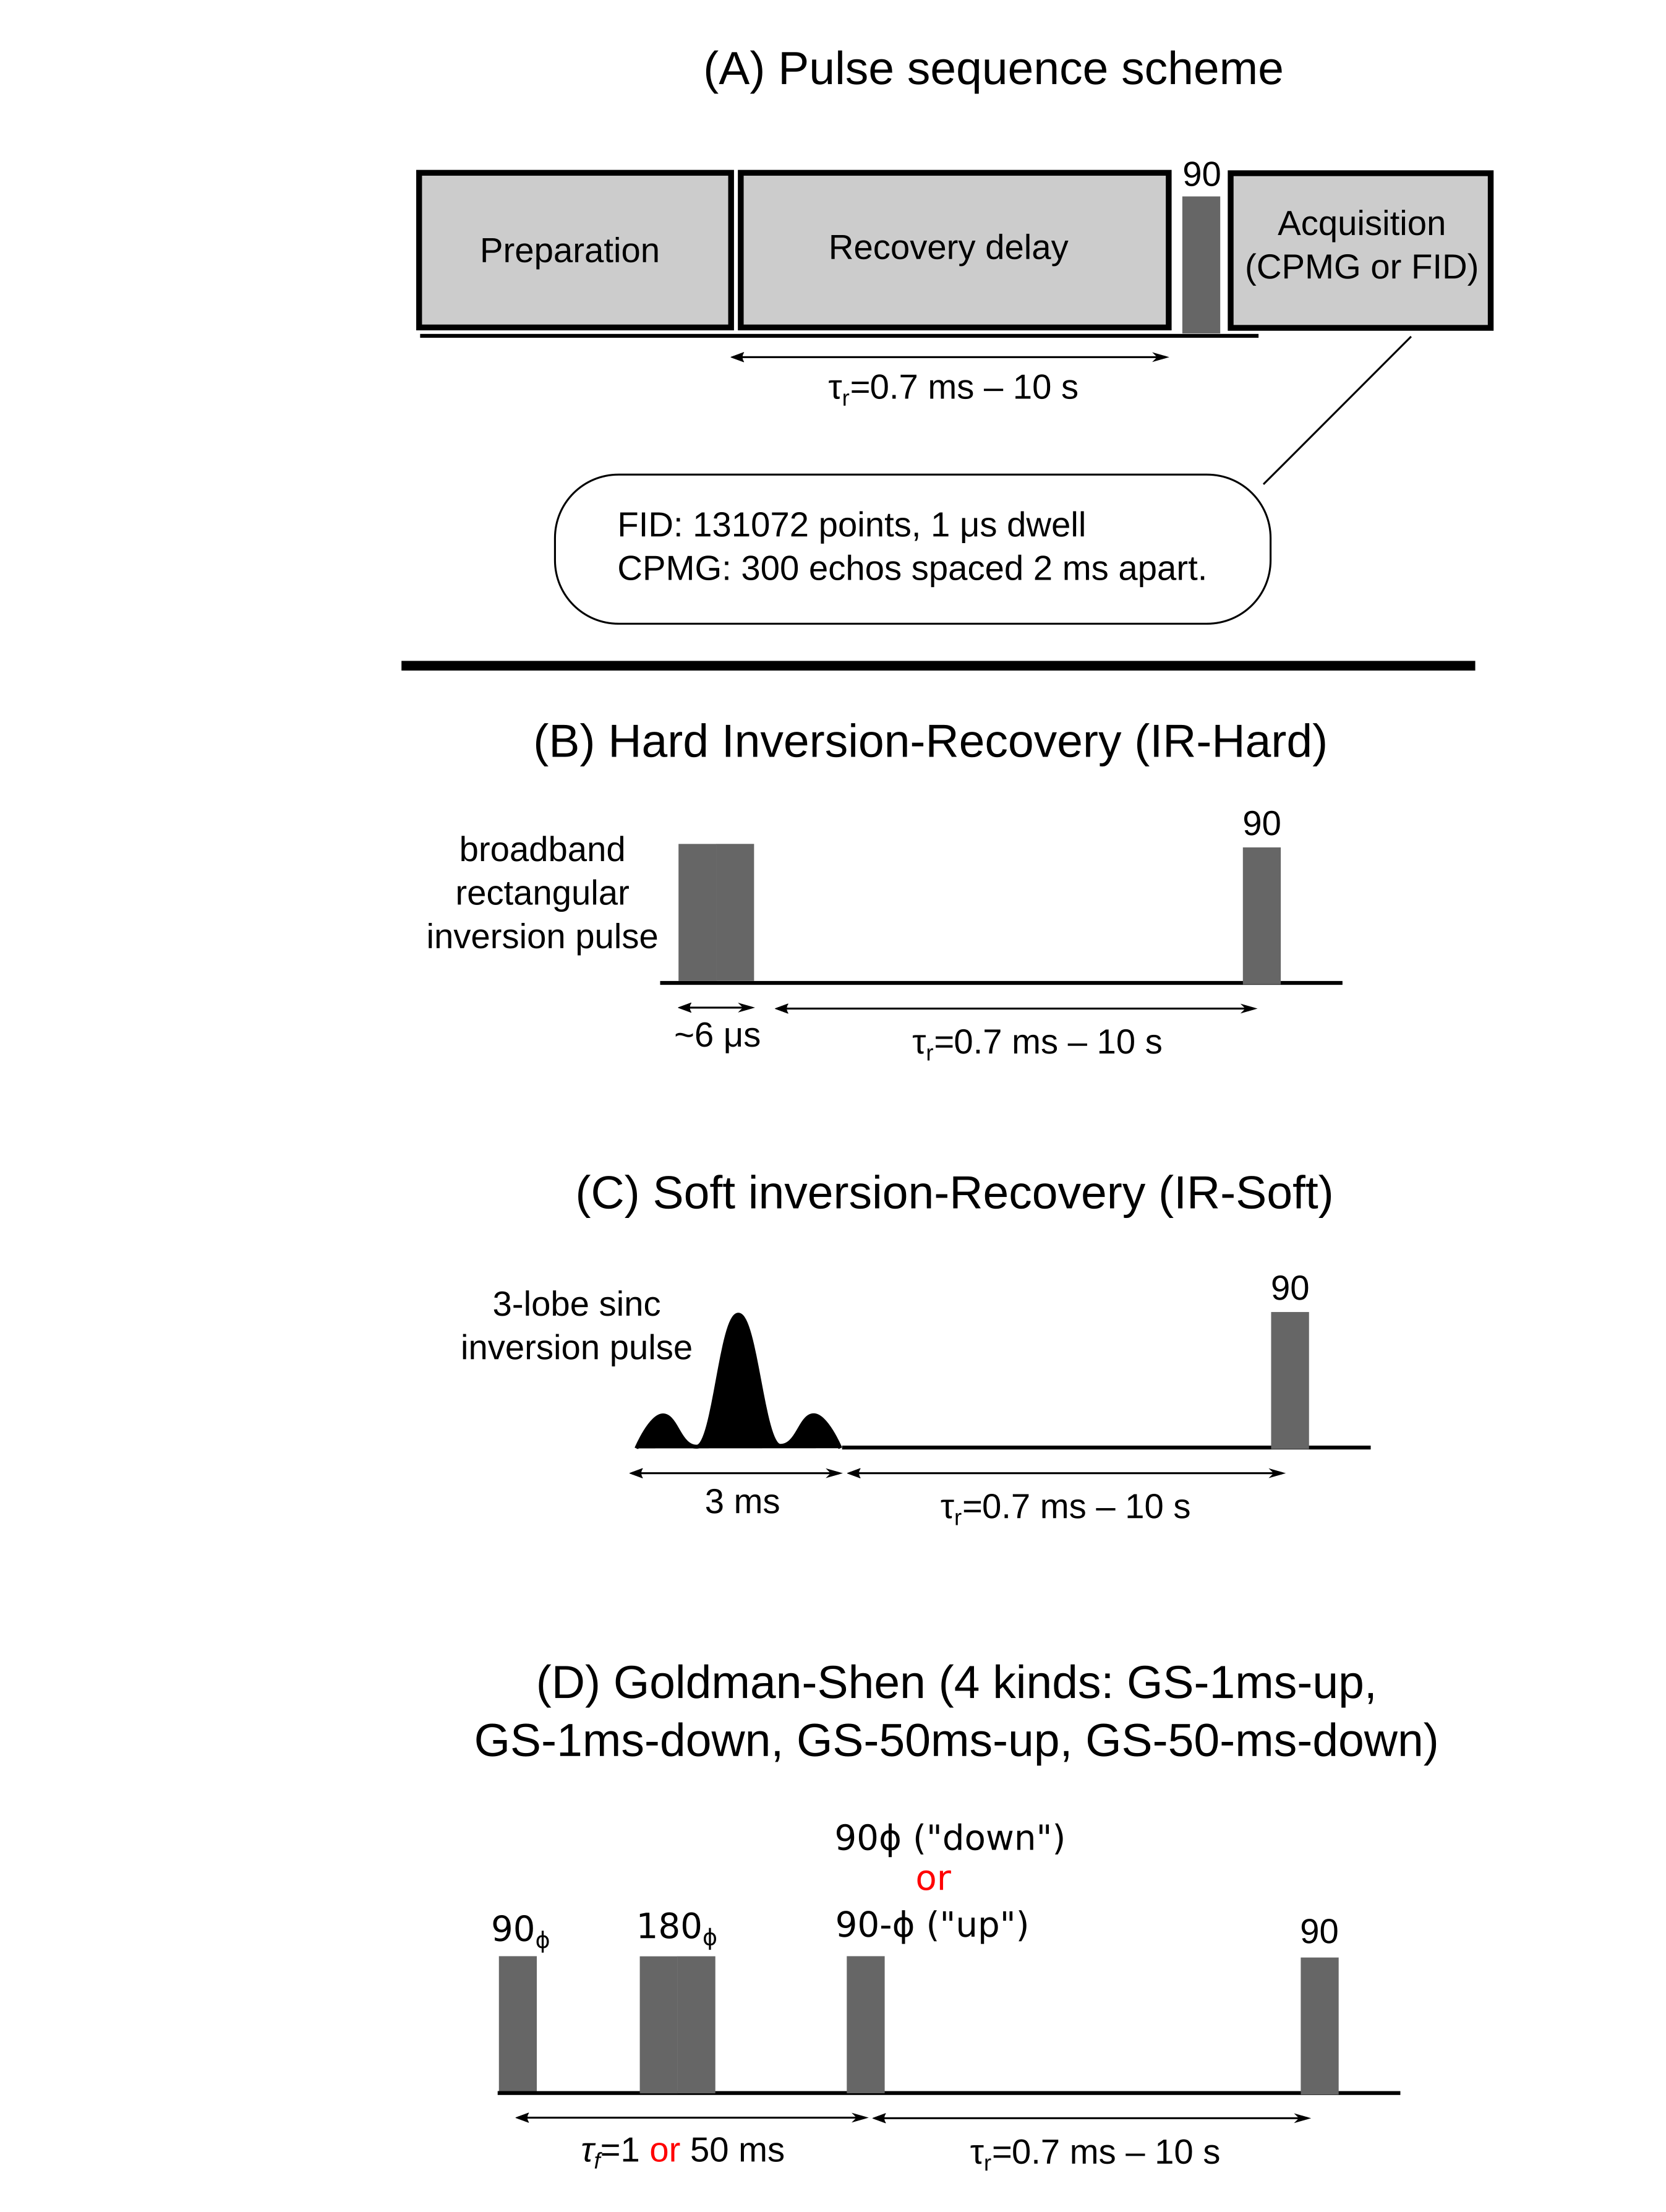
Six pulse sequences were used to prepare unique initial longitudinal magnetization states. Each sequence follows the general scheme shown in Fig. 2A: preparation pulses were followed by a recovery delay of time τR, and then an FID or CPMG echo train was acquired. The six preparation pulses were: 1) hard or 2) soft inversion-recovery, and 3-6) four kinds of Goldman Shen (GS) sequences.
FIDs were fit with a sum of super-Lorentzian and Gaussian lineshapes for the non-aqueous signal19 and with a template from the equilibrium aqueous spectrum for the aqueous signal. CPMG curve fits used three exponentials to account for the myelin water and two distinct (~60 ms and ~110 ms) IE water components. Together, this gives measured pool amplitudes m(τR) for myelin water, IE water, and the sum of both non-aqueous pools. The unrestricted FPM was fit to m(τR) and the restricted FPM was fit to the CPMG curves, giving a fitted m(τR) indirectly.
Results and Discussion
Fig. 3 shows an example of the FID and spectral data when the system is in equilibrium (τR=10 s, panel A,C) and shortly after a soft inversion pulse (τR=2.7 ms, panel B,D). We are able to fit the signal from the non-aqueous and aqueous protons separately.
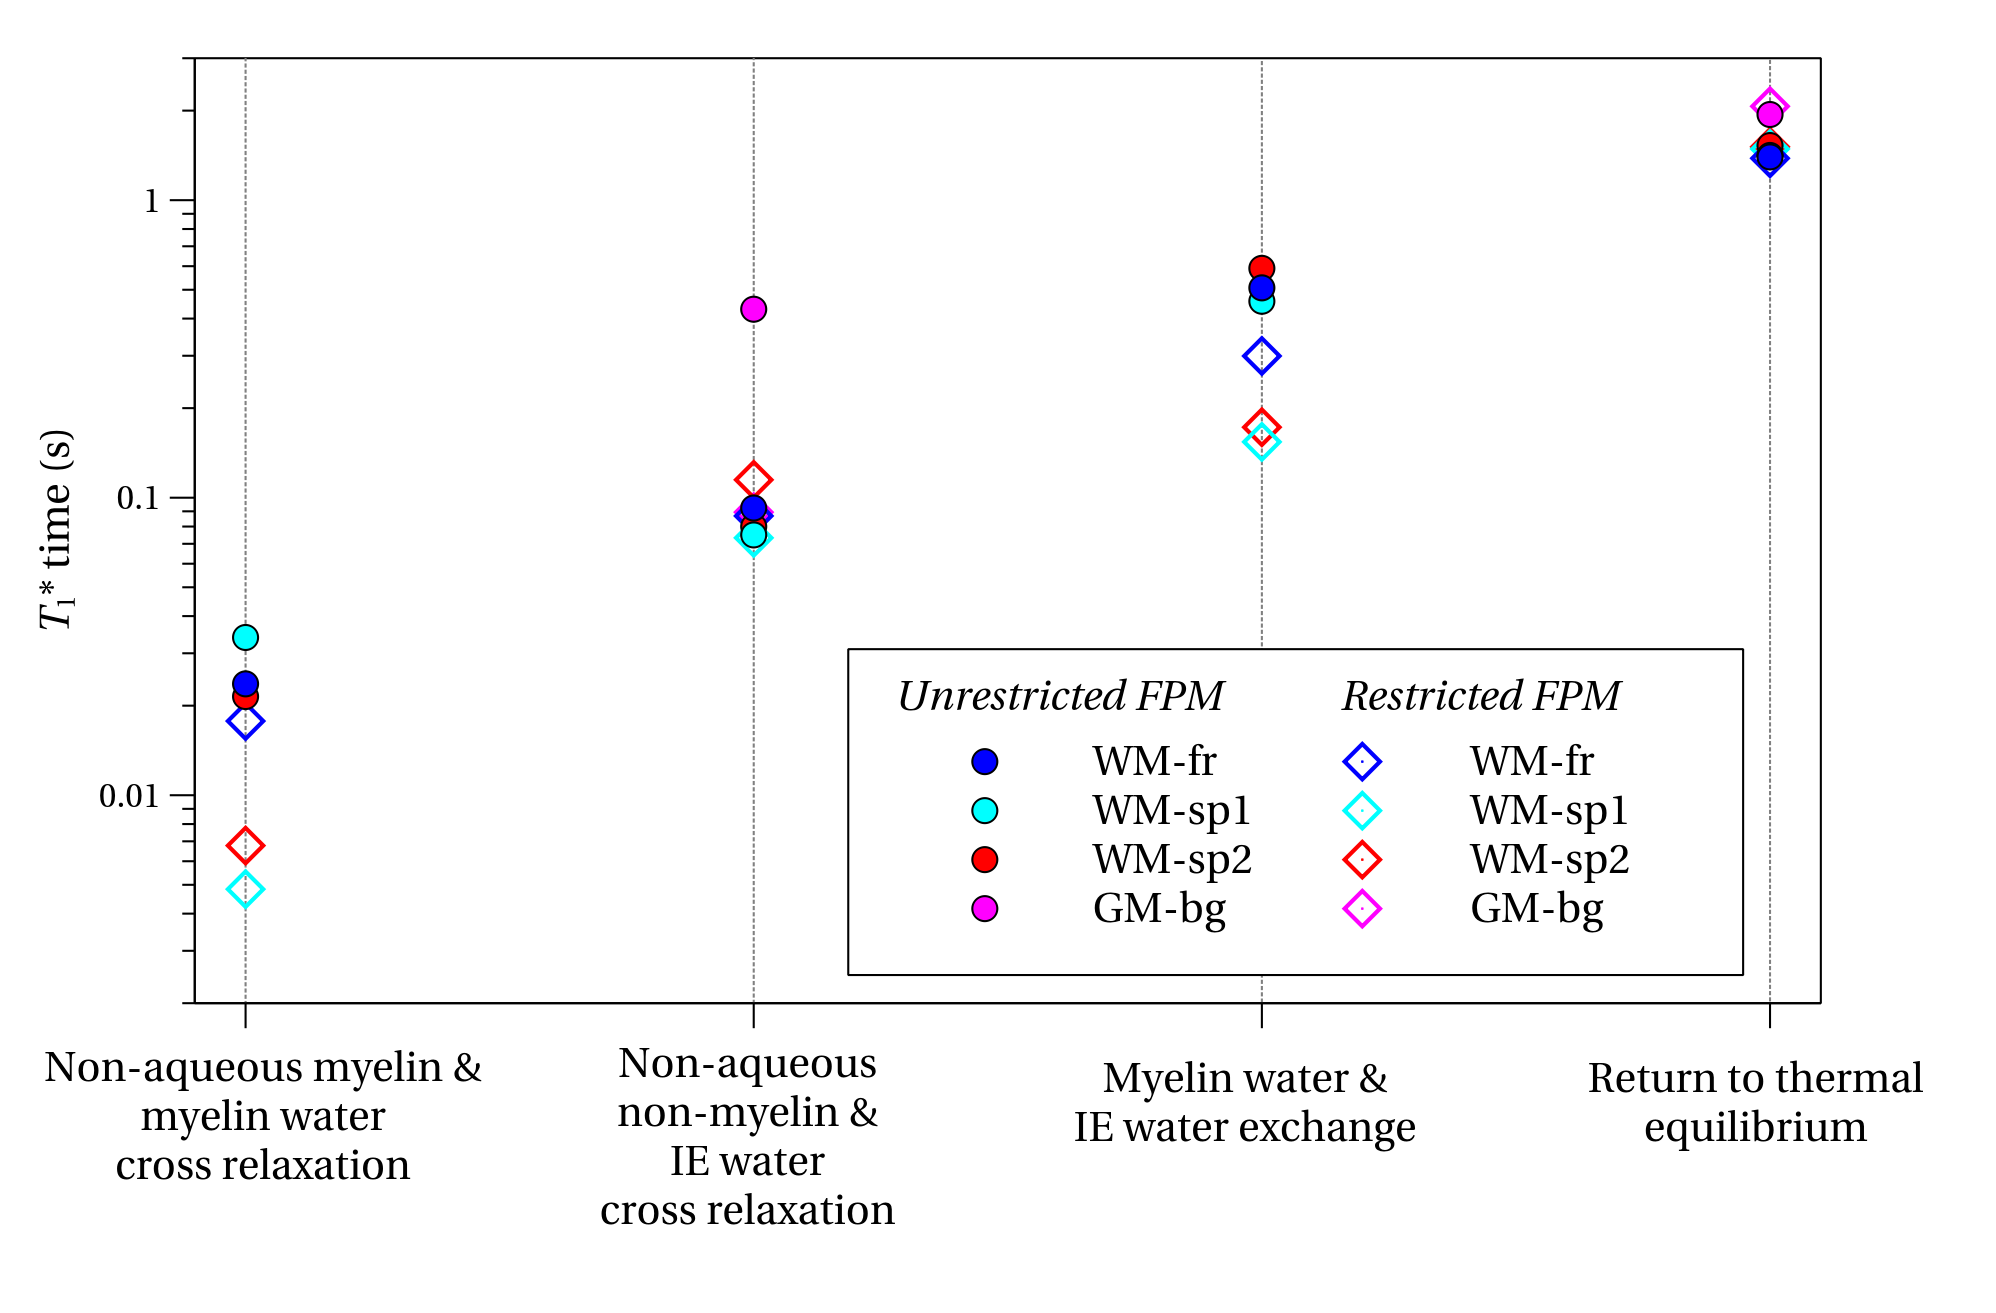
When the restricted and unrestricted FPM were fit to the data, the resulting T1*s and their associated eigenvectors were similar, as shown in Fig. 4 for all samples. This shows the assumptions leading to the restricted FPM are valid. Whether the T1*s originate from exchange between pools or from spin-lattice relaxation can be determined by analyzing the eigenvectors. The GM sample was fit well with only two pools, due to its low myelin content.
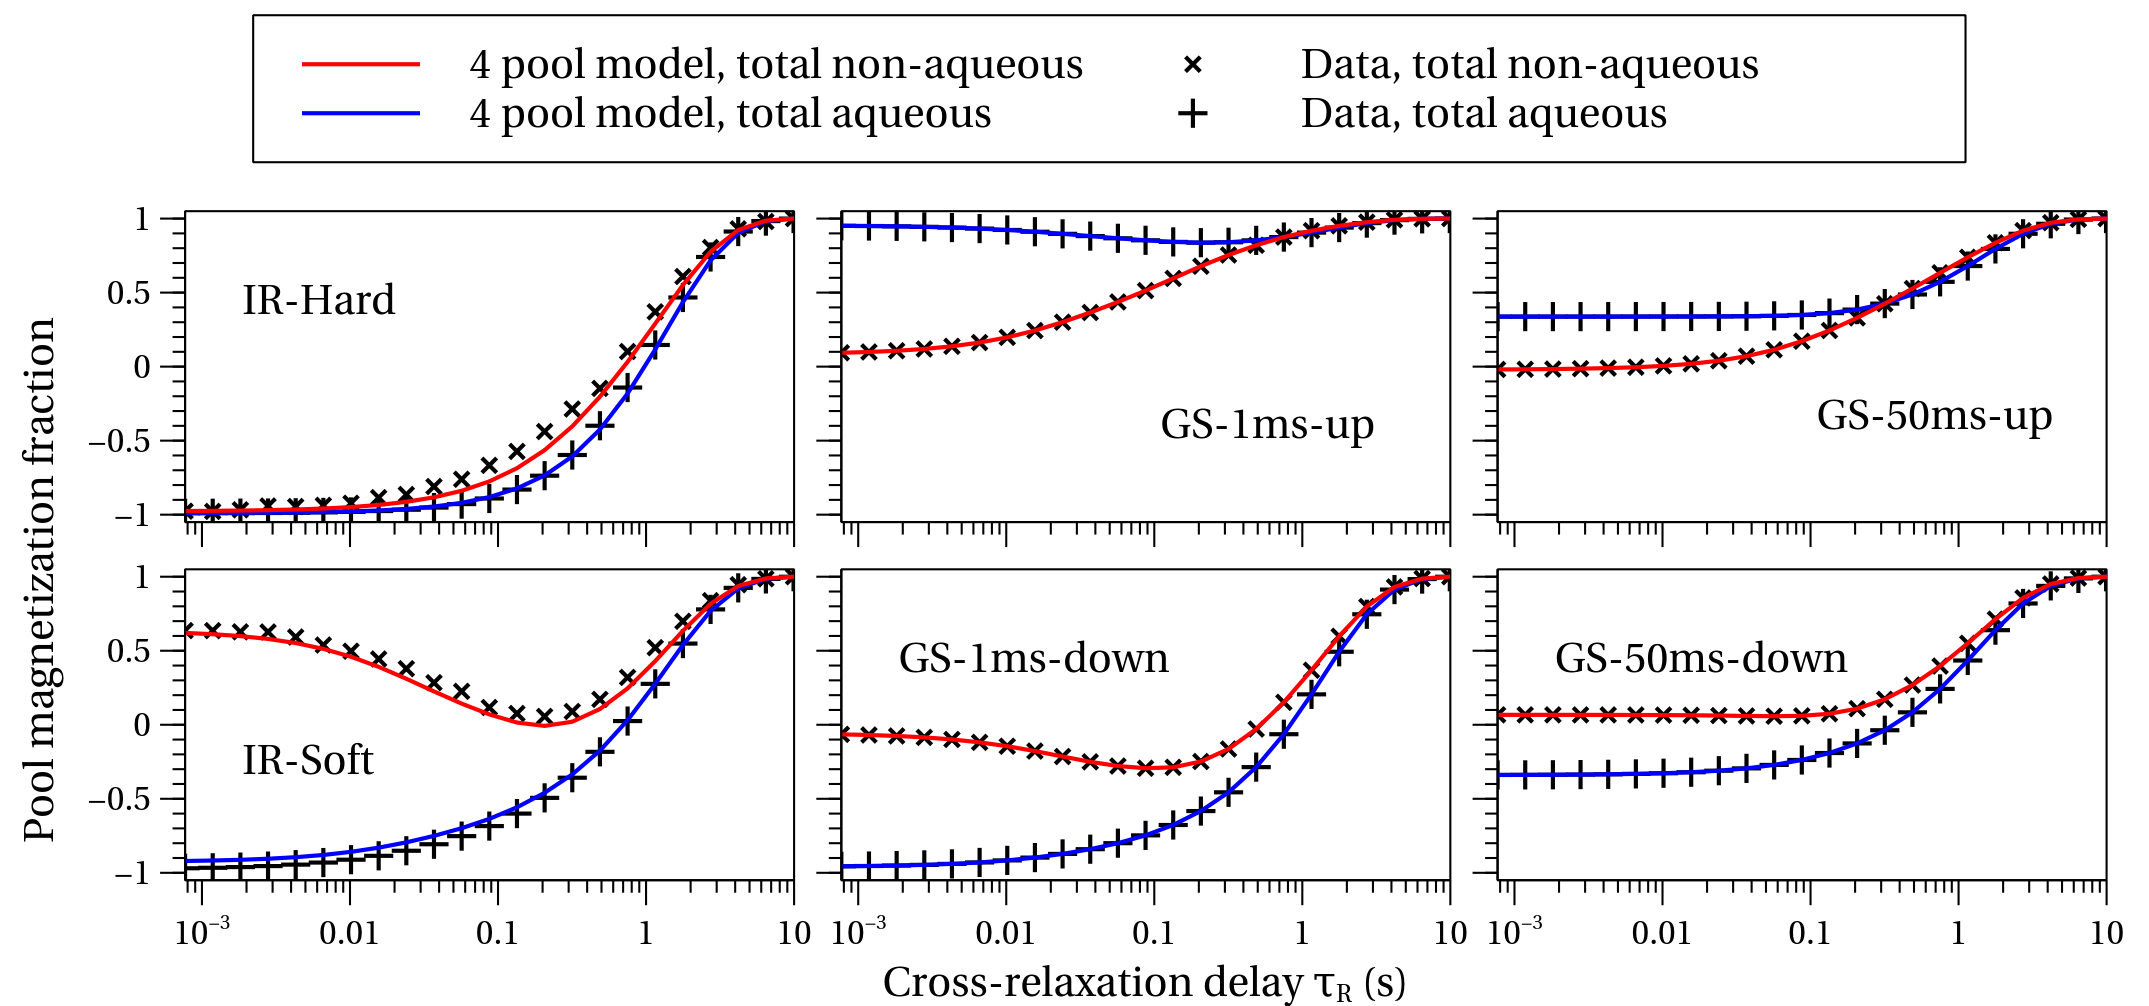
Comparisons of the restricted FPM fit with the measured total aqueous and total non-aqueous amplitudes are shown in Fig. 5. The diverse initial conditions from the six experiments are evident, as is its multi-component behavior. The restricted FPM describes the data well, although not as well as the unrestricted FPM (not shown), which deviates negligibly from the data. Future work will focus on modifications to the restricted FPM to more fully describe the data.
Conclusion
Observation of the aqueous and non-aqueous magnetizations using NMR spectroscopy can yield detailed insights into the T1 relaxation behavior of white matter. Unrestricted multi-pool analysis offers a way to analyze T1 relaxation data in a general way. Because the observed T1 relaxation behavior is in general multi-component, and depends sensitively on the initial conditions of the different pools, great care must be taken in interpreting T1 relaxation measurements.Acknowledgements
APM was supported by an NSERC doctoral scholarship. ALM and CAM were supported by NSERC Discovery Grants. This research was enabled in part by support provided by WestGrid (www.westgrid.ca) and Compute Canada (www.computecanada.ca).References
[1] Stikov, N. et al. On the accuracy of T1 mapping: Searching for common ground. Magnetic Resonance in Medicine 73, 514–522 (2014).
[2] Bojorquez, J. Z. et al. What are normal relaxation times of tissues at 3T? Magnetic Resonance Imaging 35, 69–80 (2017).
[3] Gochberg, D. F. & Gore, J. C. Quantitative magnetization transfer imaging via selective inversion recovery with short repetition times. Magnetic Resonance in Medicine 57, 437–441 (2007).
[4] Prantner, A. M., Bretthorst, G. L., Neil, J. J., Garbow, J. R. & Ackerman, J. J. Magnetization transfer induced biexponential longitudinal relaxation. Magnetic Resonance in Medicine 60, 555–563 (2008).
[5] Labadie, C. et al. Myelin water mapping by spatially regularized longitudinal relaxographic imaging at high magnetic fields. Magnetic Resonance in Medicine 71, 375–387 (2013).
[6] Oh, S.-H. et al. Direct visualization of short transverse relaxation time component (ViSTa). NeuroImage 83, 485–492 (2013).
[7] Harkins, K. D. et al. The microstructural correlates of T1 in white matter. Magnetic Resonance in Medicine 75, 1341–1345 (2015).
[8] van Gelderen, P., Jiang, X. & Duyn, J. H. Effects of magnetization transfer on T1 contrast in human brain white matter. NeuroImage 128, 85–95 (2016).
[9] Does, M. D. & Gore, J. C. Compartmental study of T1 and T2 in rat brain and trigeminal nerve in vivo. Magnetic Resonance in Medicine 47, 274–283 (2002).
[10] Lancaster, J. L., Andrews, T., Hardies, L. J., Dodd, S. & Fox, P. T. Three-pool model of white matter. Journal of Magnetic Resonance Imaging 17, 1–10 (2002).
[11] Deoni, S. C. L., Matthews, L. & Kolind, S. H. One component? Two components? Three? The effect of including a nonexchanging “free” water component in multicomponent driven equilibrium single pulse observation of T1 and T2. Magnetic Resonance in Medicine 70, 147–154 (2012).
[12] Dortch, R. D., Harkins, K. D., Juttukonda, M. R., Gore, J. C. & Does, M. D. Characterizing inter-compartmental water exchange in myelinated tissue using relaxation exchange spectroscopy. Magnetic Resonance in Medicine 70, 1450–1459 (2013).
[13] Barta, R. et al. Modeling T1 and T2 relaxation in bovine white matter. Journal of Magnetic Resonance 259, 56–67 (2015).
[14] Edzes, H. T. & Samulski, E. T. Cross relaxation and spin diffusion in the proton NMR of hydrated collagen. Nature 265, 521–523 (1977).
[15] Bjarnason, T., Vavasour, I., Chia, C. & MacKay, A. Characterization of the NMR behavior of white matter in bovine brain. Magnetic Resonance in Medicine 54, 1072–1081 (2005).
[16] Stanisz, G., Kecojevic, A., Bronskill, M. & Henkelman, R. Characterizing white matter with magnetization transfer and T2. Magnetic Resonance in Medicine 42, 1128–1136 (1999).
[17] Levesque, I. R. & Pike, G. B. Characterizing healthy and diseased white matter using quantitative magnetization transfer and multicomponent T2 relaxometry: A unified view via a four-pool model. Magnetic Resonance in Medicine 62, 1487–1496 (2009).
[18] Kalantari, S., Laule, C., Bjarnason, T. A., Vavasour, I. M. & MacKay, A. L. Insight into in vivo magnetization exchange in human white matter regions. Magnetic Resonance in Medicine 66, 1142–1151 (2011).
[19] Wilhelm, M. J. et al. Direct magnetic resonance detection of myelin and prospects for quantitative imaging of myelin density. Proceedings of the National Academy of Sciences 109, 9605–9610 (2012).
[20] Goldman, M. & Shen, L. Spin-spin relaxation in LaF3. Physical Review 144, 321–331 (1966).
[21] Hills, B. & Favret, F. A comparative multinuclear relaxation study of protein-dmso and protein-water interactions. Journal of Magnetic Resonance, Series B 103, 142–151 (1994).
Figures