2268
Accuracy and precision of measured T1 in hepatic portal vein blood using a variety of Look- Locker and Modified Look-Locker Inversion Recovery sequences.1The Intervention Center, Oslo University Hospital, Oslo, Norway, 2Oxy Solutions AS, Oslo, Norway, 3Faculty of Medicine, University of Oslo, Oslo, Norway, 4Dept. of Diagnostic Physics, Oslo University Hospital, Oslo, Norway, 5Institute of basic medical sciences, University of Oslo, Oslo, Norway
Synopsis
The longitudinal variation and averaged T1 measured in the hepatic portal vein (HPV) obtained with 12 variations of Look-Locker (LL) and Modified Look-Locker Inversion Recovery (MOLLI) sequences were compared to identify the sequence with least variation. Among the sequences studied, LL sequence with 5 beat readout and 45o flip angle and MOLLI with an acquisition scheme 10 beats readout, 5 beats recovery followed by 5 beat readout (10(5)5) were shown to be the most stable. Method of image analysis and the use of simulated versus real-time EKG did not significantly affect the stability of the T1-estimates.
Introduction
LL and MOLLI are two techniques often used for clinical T1 measurements. In short, while LL consists of an inversion pulse followed by sequential imaging, MOLLI samples the relaxation images in an non-sequential fashion, pre-defined by the MOLLI scheme (1). Previous studies have shown differences in reported T1 and variations in longitudinal measurements (2-5). The aim of this work was to compare the longitudinal variation and measured T1 of different LL and MOLLI sequences for T1-measurements in the portal vein.Methods
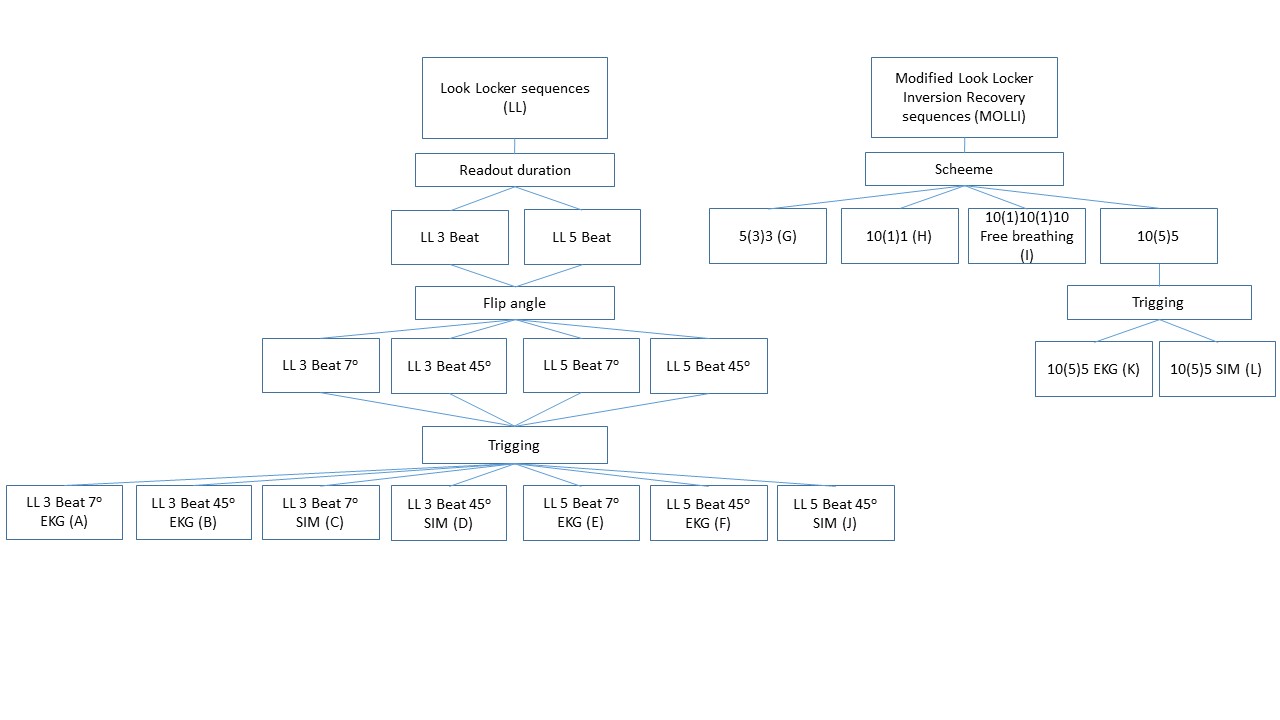
Ten healthy male volunteers were recruited. The sequences for evaluation were scanned a total of 12 times (runs) pr. volunteer over two sessions a minimum of one week apart (figure 1). Scanning was performed using a Philips 3T Ingenia system (Philips Medical system, Best, The Netherlands). Image analysis and quantification was done in NordiceICE software package (NordicNeuroLab, Bergen, Norway), using two different methods. Method 1: ROIs were manually placed in the portal vein in the images and the resulting inversion recovery curve was used as input to the curve fit function in nordicICE to obtain an average T1 value within the ROI. Method 2: Parametric T1 maps were generated and T1 was obtained from ROIs placed manually in the portal vein.
The average T1 for a given sequence was calculated by the equations:
$$ T1_{session} =\frac{\sum_{1}^{run} T1_{run}}{nrun} $$
$$ T1_{sequence} =\frac{\sum_{1}^{session} T1_{session}}{nsession} $$
To compare the stability of the sequences T1 values for each run were normalized according to:
$$ nT1_{run} = \frac{T1_{run}}{T1_{session}} $$
Variance was then defined as the average standard deviation of nT1run (nT1SD) per session. Differences in measured T1 and stability were evaluated using ANOVA analysis with Bonferroni correction.
Results
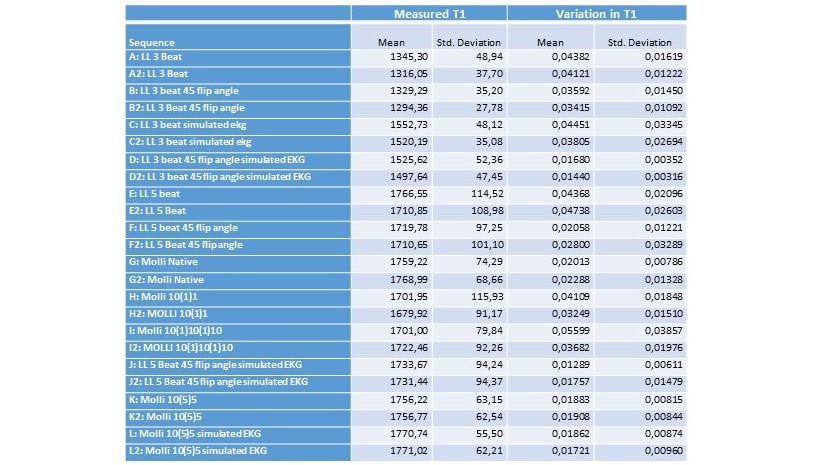
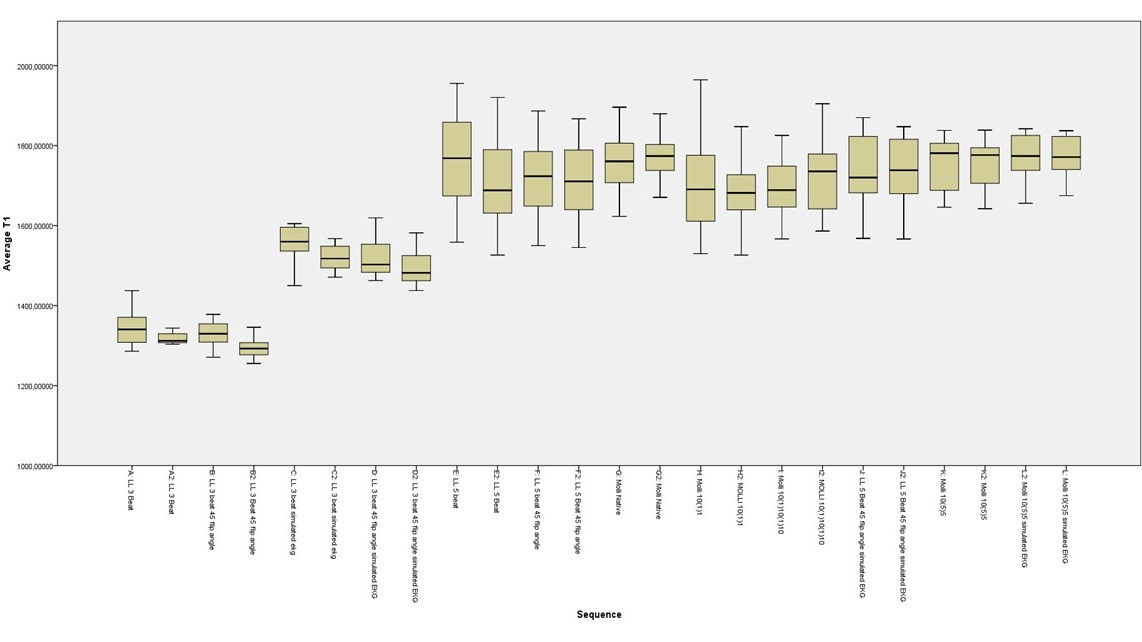
The highest and lowest T1 were found in MOLLI 10(5)5 SIM “L2” (T1=1771 ms +/- 62,2ms) and LL 3 Beat 45 “B2” (T1=1294 ms +/- 27.78ms) respectively.
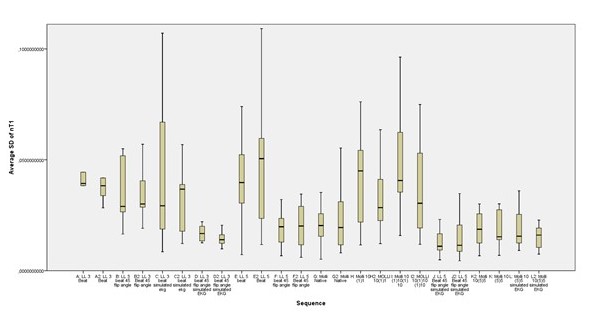
The lowest and highest T1 variations were found in sequence LL 5 Beat 45 flip sim “J” (0,013) and MOLLI 10(1)10(1)1 “I” (0,056) respectively.All results are shown in table 1, with figure 2+3 showing the boxplot of averaged variation and T1.
There was no difference between T1 stability with simulated- versus real-time EKG within the same sequence or in measured T1 of LL with 5 beat readout and 45o flip angle or the MOLLI 10(5)5 sequences. There was however a significantly higher measured T1 in the LL sequences using a three beat readout both with 7o flip angle (Bonferroni correction: p < 0,001) and 45o flip angle (Bonferroni correction: p = 0,001).
Method of analyzation did not significantly alter either measured T1 or variation in longitudinal T1.
Discussion
The lowest temporal variation was achieved using LL sequence with 5 beat readout and 45o flip angle and MOLLI 10(5)5. There was no significant difference in variation or T1 between these two sequences. In static tissue increasing the flip angle of Look-Locker images will result in a saturation of the stationary tissue, however, as previously shown, higher flip angles can be used when measuring blood in vivo due to inflow of non-saturated blood.(6) In this study LL with 3 beat readout resulted in significantly lower T1-values than for the other sequences, these values were also lower than those reported in previous studies. This indicates that 3 beats is an insufficient readout time for measurements in the blood, and should therefore not be used. While the measured T1 of LL with 3 beat readout increased with the use of simulated EKG this effect was not evident with the other sequences. Since the measured T1 and variation was not influenced by analysis approach 1 or 2, the choice between curve fit or parametric maps appears to be of little importance when performing T1 measurements.Conclusion
In conclusion, T1-measurements in the hepatic portal vein can be performed with very high reproducibility using standard, optimized sequences, the LL sequence with a minimum of 5 beat readout and 45o flip angle and the MOLLI 10(5)5 sequence being the most stable sequences.Acknowledgements
The study is founded by the Norwegian Research CouncilReferences
1. Messroghli DR, Radjenovic A, Kozerke S, Higgins DM, Sivananthan MU, Ridgway JP. Modified Look-Locker inversion recovery (MOLLI) for high-resolution T1 mapping of the heart. Magn Reson Med. 2004;52(1):141-6.
2. Aryal MP, Chenevert TL, Cao Y. Impact of uncertainty in longitudinal T1 measurements on quantification of dynamic contrast-enhanced MRI. NMR Biomed. 2016;29(4):411-9.
3. Li W, Liu P, Lu H, Strouse JJ, van Zijl PC, Qin Q. Fast measurement of blood T1 in the human carotid artery at 3T: Accuracy, precision, and reproducibility. Magn Reson Med. 2016.
4. Piechnik SK, Ferreira VM, Lewandowski AJ, Ntusi NA, Banerjee R, Holloway C, et al. Normal variation of magnetic resonance T1 relaxation times in the human population at 1.5 T using ShMOLLI. Journal of Cardiovascular Magnetic Resonance. 2013;15(1):13.
5. Zhang X, Petersen ET, Ghariq E, De Vis JB, Webb AG, Teeuwisse WM, et al. In vivo blood T(1) measurements at 1.5 T, 3 T, and 7 T. Magn Reson Med. 2013;70(4):1082-6.
6. Varela M, Hajnal JV, Petersen ET, Golay X, Merchant N, Larkman DJ. A method for rapid in vivo measurement of blood T1. NMR in Biomedicine. 2011;24(1):80-8.
Figures