2267
$$$R_2^*$$$ Correction for Gradient Echo with a Gaussian Excitation Pulse1Department of Neurology, Medical University of Graz, Graz, Austria, 2Neuroradiology, University Medical Center Hamburg-Eppendorf, Hamburg, Germany
Synopsis
Macroscopic field inhomogeneities increase the effective transverse relaxation rate R2*. In contrast to conventional models assuming ideal rectangular pulses, we developed an R2* correction model for Gaussian excitation pulses. After demonstrating the validity of the model in phantom measurements we measured 10 volunteers with 2mm and 4mm slice thickness, respectively. Uncorrected and corrected R2* values were assessed regionally and a significant effect of the correction was observed. An advantage of the proposed method is that it only requires two echoes, rendering it useful in clinical MRI.
Introduction
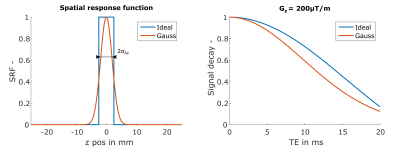
The effective transverse relaxation rate R2* is a sensitive measure for brain iron concentration1 and can be easily obtained by gradient echo (GRE) sequences. Besides its sensitivity for microscopic field variations R2* is also affected by macroscopic field variations causing an enhanced signal decay2, which increases with slice thickness Δz. This hampers the comparison of R2* rates measured with different Δz, which might be an issue in longitudinal studies. Correction methods that are assuming an ideal rectangular slice profile result in sinc-shaped signal decay2. However, when using a Gaussian excitation pulse for the GRE the signal decay deviates from the ideal one3 (Figure 1).
Therefore, this work presents a model describing the signal attenuation for a Gaussian excitation pulse, which in turn allows to correct for R2* estimation errors in the presence of macroscopic field variations.
Theory
The transverse magnetization over time t from a gradient echo, assuming a constant field gradient Gz within a voxel due to macroscopic field variations4, can be described along z as3:
$$S(t,z_0)=\int_{-\infty}^{\infty}\rho(z)e^{-R_2^*~t}e^{-i\gamma(\Delta B_0(z_0)+ G_z\cdot[z-z_o])t}SRF(z-zo)dz$$
with spin density ρ(z), the field offset ΔB0(z0) and the spatial response SRF(z-z0) for the center of the slice z0. For a Gaussian excitation pulse the SRF is modelled as a Gaussian function with standard deviation σΔz:
$$SRF(z-z_0)=e^{-\frac{(z-z_0)^2}{2~\sigma_{{\Delta}z}}}$$
Assuming a constant spin density along z the solution becomes:
$$S(t,z_0)=\hat{\rho}e^{-i\gamma\Delta B_0(z_0)t}e^{-R_2^*~t}e^{-\frac{(\gamma~G_z~\sigma_{\small\Delta_z})^2}{2}}$$
with scaled spin density $$$\hat{\rho}$$$.
Methods
Phantom and in-vivo measurements were performed on a clinical 3T scanner (Magnetom PRISMA, Siemens).
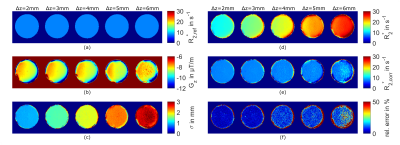
Phantom MRI: To determine σΔz of equation (3) a spherical agar-phantom (diameter=10cm, concentration=10g/l) was measured twice, first with standard shim and then with manually changed linear z-shim, with a 2D multi-echo gradient echo sequence (mGRE) with varying slice thickness Δz=2/3/4/5/6mm. Sequence settings: FA=20° (Gaussian excitation pulse); 32 echoes; TE1=3.1ms; ΔTE=9ms; TR=300ms; resolution=1x1xΔz mm3. From standard shim images (Δz=2mm) a reference R2*ref was determined from voxels with negligible small gradient magnitude (γ|G|< 2rad/(ms mm)). With R2*ref, and the images with changed shim, it was possible to determine σΔz with Gz derived from the field-map ΔB0. With σΔz and Gz corrected R2*corr maps were estimated by fitting equation (3) and then compared with R2*ref.
Gradients Gx,y,z were calculated by differentiation of the ΔB0-map obtained from a linear fit of the temporal unwrapped phase.
In-vivo MRI: Ten healthy volunteers (26-31 years) were scanned with an anatomical MPRAGE (1mm³) and twice with a mGRE sequence with Δz=2/4mm. (Gaussian FA=20°; 22 echoes; TE1=4ms; ΔTE=4.2ms; TR=2710ms; resolution=1x1x Δz mm3). Corrected R2*corr maps were obtained by fitting equation (3) using the previous estimated σΔz and Gz obtained from the ΔB0-map, which was calculated from the unwrapped phase of first and third echo.
Regional evaluation: Numerical differences were assessed by calculating uncorrected R2* and corrected R2*corr mean values in the basal ganglia, obtained from the segmentation of the MPRAGE with FSL FIRST5 and registration to mGRE-space with FSL FLIRT5. Mean values were regional compared with a Paired Student's t-test.
Results
Phantom measurements: Resulting σΔz –maps estimated from Gz -maps and R2*ref =7.6 s-1 are shown in Figure 2a-c and indicate that σΔz is differentiable and increasing with Δz (σΔz=0.88/1.34/1.76/2.25mm). Uncorrected R2* values are increasing with Δz (Figure 2d), whereas the corrected R2*corr values (Figure 2e) minimize differences to R2*ref (Figure 2a) with growing noise levels for larger Δz (Figure 2e).
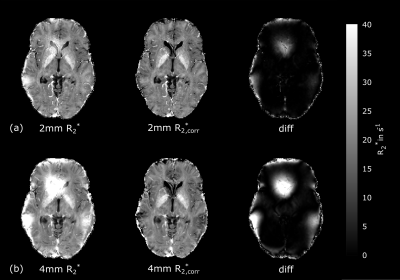
In-vivo measurements: Figure 3 shows the uncorrected R2*-map and corrected R2*corr -map with a strong correction effect adjacent to the sinuses and cavities for Δz=4mm. Estimated mean values between R2* and R2*corr were significant different (p<0.05) in all regions for each Δz. After
correction, R2*corr in the caudate nucleus and the pallidum
remained significantly different (p<0.05) between Δz=2mm and Δz=4mm.
Discussion
By changing the system’s linear z-shim we could estimate σΔz of a Gaussian excitation pulse to describe the influence of a macroscopic field gradient Gz on the measured signal. Besides the applied pulse and Δz it is expected that σΔz depends also on the flip angle. Our model assumes a constant gradient Gz along the slice selection, which might not hold in the caudate nucleus and pallidum. A possible approach for resolving this issue could be to model field variations within a voxel as a quadratic function6.Conclusion
We presented a closed-form solution to model the effect of macroscopic field gradients on the R2* estimation for a Gaussian excitation pulse. This model does not depend on the number of echoes since it is defined by the gradient Gz and a constant σΔz for the pulse, which allows to correct R2* even for a small number (at least two) of echoes.Acknowledgements
References
1. Ordidge, R. J., Gorell, J. M., Deniau, J. C., Knight, R. A. and Helpern, J. A. (1994), Assessment of relative brain iron concentrations using T2-weighted and T2*-weighted MRI at 3 Tesla. Magn. Reson. Med., 32: 335–341
2. Fernández-Seara, M.A. and Wehrli, F.W. (2000), Postprocessing technique to correct for background gradients in image-based R*2 measurements. Magn. Reson. Med., 44: 358–366.
3. Hernando, D., Vigen, K. K., Shimakawa, A. and Reeder, S. B. (2012), R2* mapping in the presence of macroscopic B0 field variations. Magn. Reson. Med., 68: 830–840.
4. Yablonskiy, D. A. (1998), Quantitation of intrinsic magnetic susceptibility-related effects in a tissue matrix. Phantom study. Magn. Reson. Med., 39: 417–428.
5. S.M. Smith, M. Jenkinson, M.W. Woolrich, C.F. Beckmann, T.E.J. Behrens, H. Johansen-Berg, P.R. Bannister, M. De Luca, I. Drobnjak, D.E. Flitney, R. Niazy, J. Saunders, J. Vickers, Y. Zhang, N. De Stefano, J.M. Brady, and P.M. Matthews. Advances in functional and structural MR image analysis and implementation as FSL. NeuroImage, 23(S1):208-19, 2004
6. Yang, X., Sammet, S., Schmalbrock, P. and Knopp, M. V. (2010), Postprocessing correction for distortions in T2* decay caused by quadratic cross-slice B0 inhomogeneity. Magn. Reson. Med., 63: 1258–1268.
Figures


