2266
Quantification of T1 and T2 from Standard MR Images1Physics, University of Alberta, Edmonton, AB, Canada, 2Biomedical Engineering, University of Alberta, Edmonton, AB, Canada
Synopsis
Exact sequence modelling using the Bloch equations is employed to directly extract quantitative T1 and T2 relaxation maps from standard MRI sequences. The need for excess specialized sequences was eliminated by measuring relaxation directly from T1, T2, and PD-weighted images, and a rapid B1 map. This approach enables wider use of quantitative MRI.
Introduction
Recently, sequence modelling methods for accurate quantification of T2 using only a Proton Density (PD) and T2-weighted turbo spin echo (TSE) image, and a B1 map have been reported1. Here, with the addition of a T1-weighted TSE image, we demonstrate that T1 may also be determined. We show that by using exact sequence modelling with Bloch equations, T1 and T2 maps can be extracted from standard MRI sequences. We demonstrate this approach at 3T using a protocol of TSE images with T1, PD and T2 weighting, and a rapid B1 map.Methods
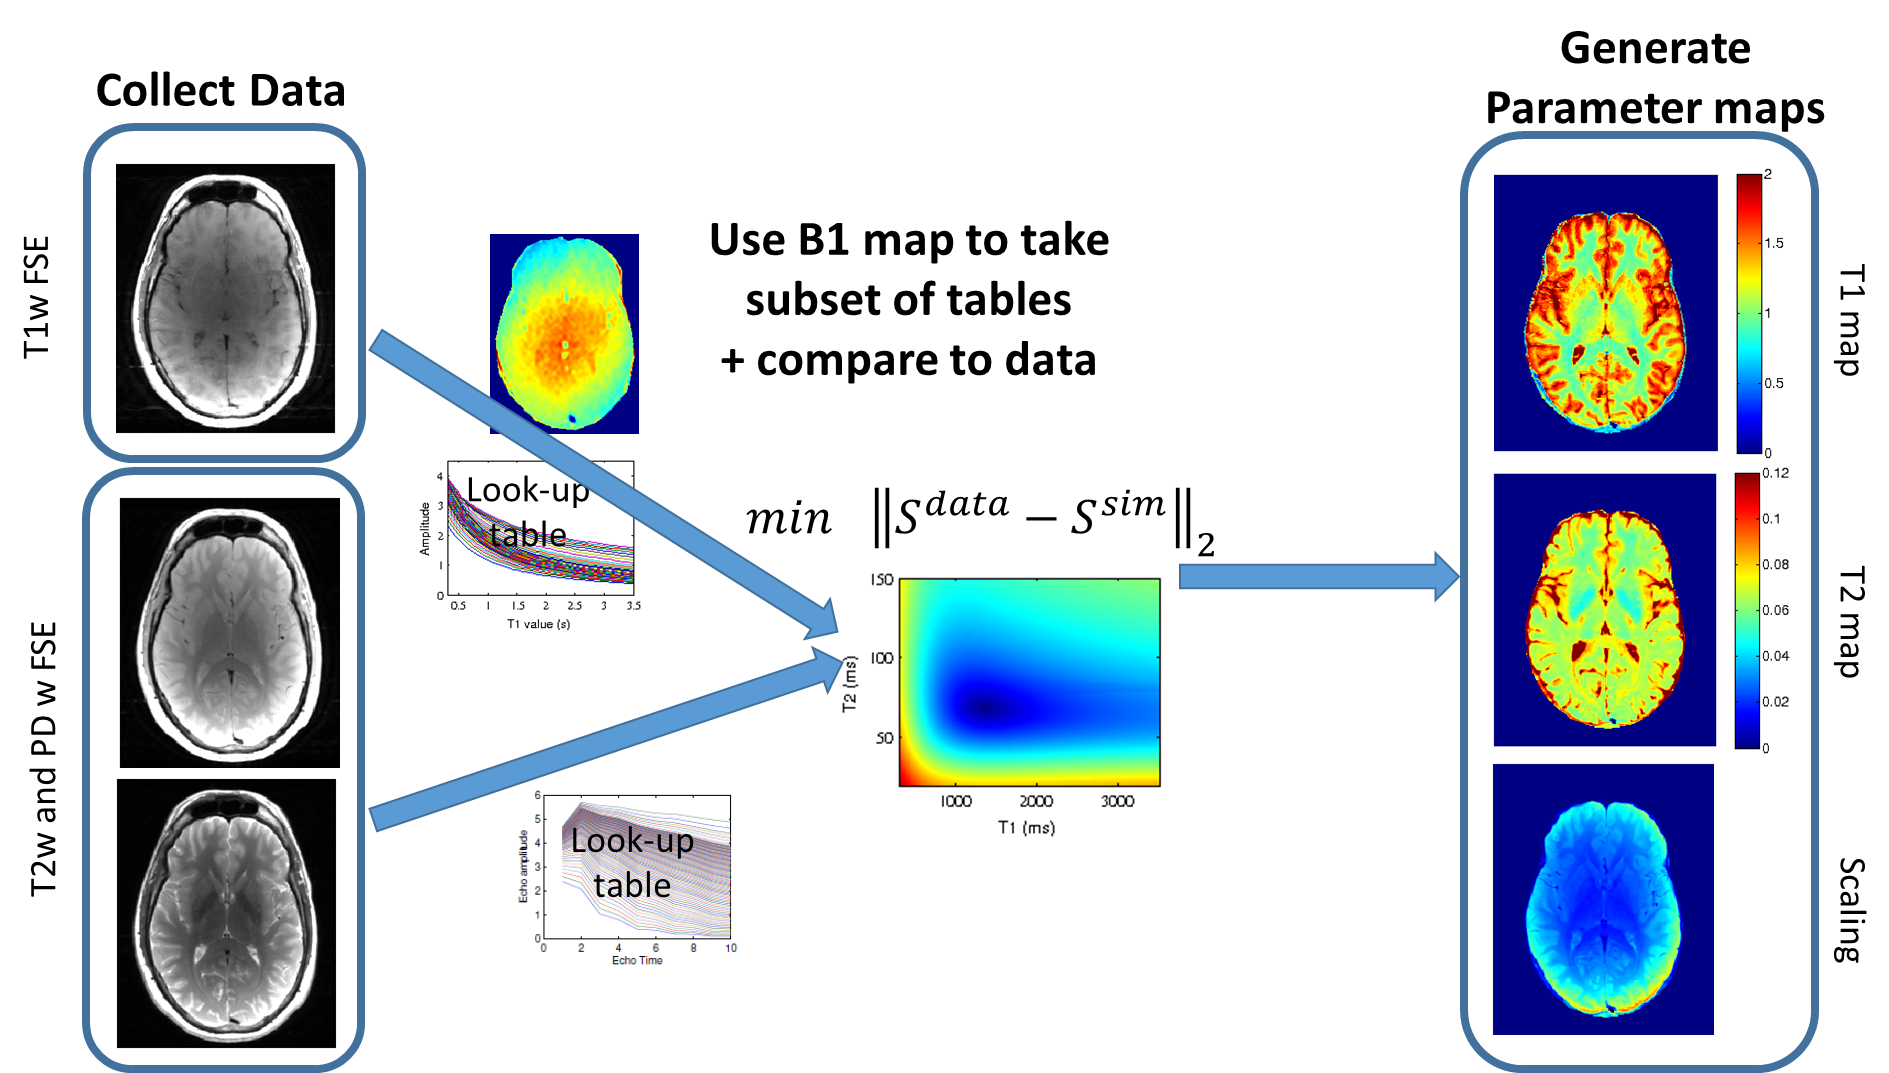
A flowchart of the image processing steps is shown in Figure 1.
MRI Acquisition: Eight volunteers (mean age 29, range 23-34 years, 4 male) were imaged on a 3T Siemens Prisma MRI system. Dual-Echo TSE (TE=10.3,92.7ms; TR=5s; turbo factor=8; refocussing angle=165⁰; 2 concatenations; TA=5:24), and T1-weighted TSE (TE=10.3; TR=600ms; turbo factor=8; refocussing angle=165⁰; 4 concatenations; TA=1:20) images were acquired in 2D interleaved multi-slice axial acquisitions with 30 contiguous slices with odd and even slices acquired on separate acquisitions to minimize incidental magnetization transfer (MT) (voxel size=0.86×0.86×3mm3; typical matrix=256×208). TSE sequences were repeated in a single-slice implementation.
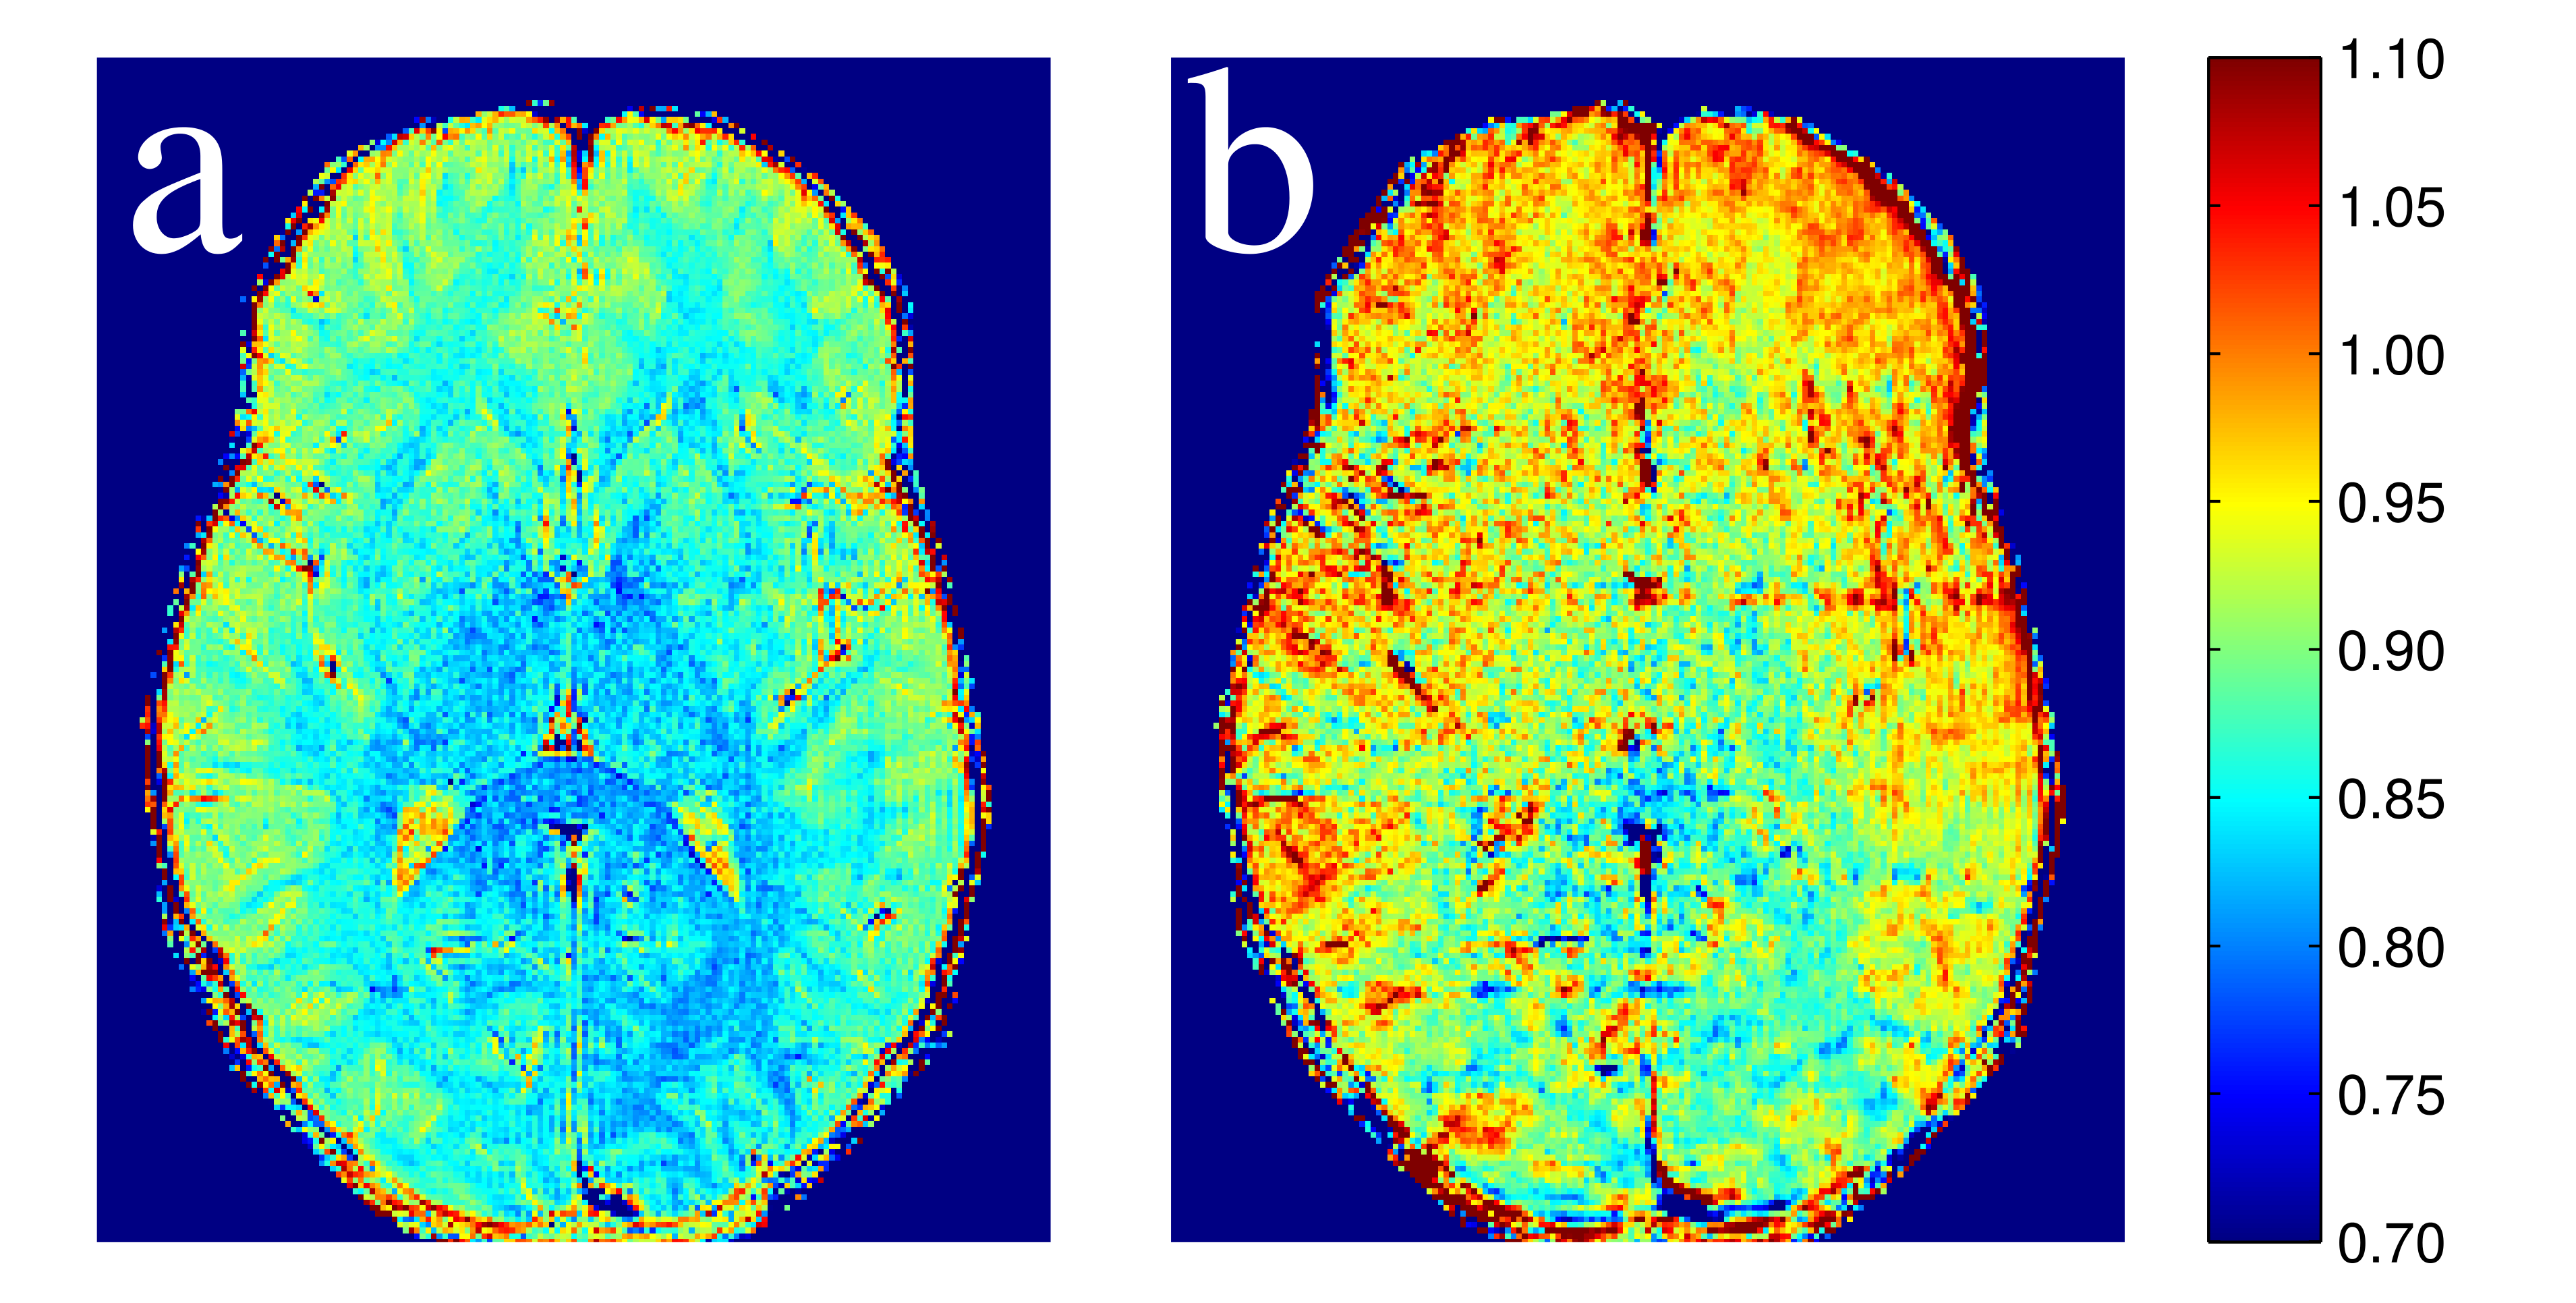
Flip angle maps (B1) were collected on all subjects using a Bloch-Seigert approach2 (TE=2.24ms; TR=16150ms, flip angle=80°; voxel size=1.1x1.1x3.0mm; TA=0:33). B1 maps were interpolated to match TSE data. B1 is expressed as a normalized parameter relating the actual and prescribed flip angle: α=B1αprescribed.
For traditional gold standard relaxation measurement, single-slice multi-echo spin echo (TE=10–200 ms with 10 ms spacing; TR=5 s; refocussing angle=180⁰), and an inversion recovery (IR) experiment (eight inversion-prepared TSE; inversion time (TI)=[50,100,200,500,1000,2200,3000,4500ms]; TE=10ms; TR= TI+5s) were performed.
T1 and T2 fitting of TSE data: Steady-state slice-selective TSE sequences were simulated using Bloch equations, similar to previously described1, including detailed sequence parameters (gradient and RF pulse shapes and timing). Lookup-tables of signal intensities were generated for both the dual-echo and T1 weighted sequences for a range of T1 (300-3500ms), T2 (20-200ms), and B1 (0.6-1.4), at each echo time in the readout train. Fitting for T1, T2 and amplitude is performed by comparing signal intensities to the lookup table cross-section corresponding to the measured B1.
Gold standard relaxation mapping: The IR data was fit pixel by pixel for T1 via S = S0(1-f exp(-TI/T1)), where f is inversion efficiency. MESE data was fit for T2 with indirect and stimulated echo compensation, as previously described3.
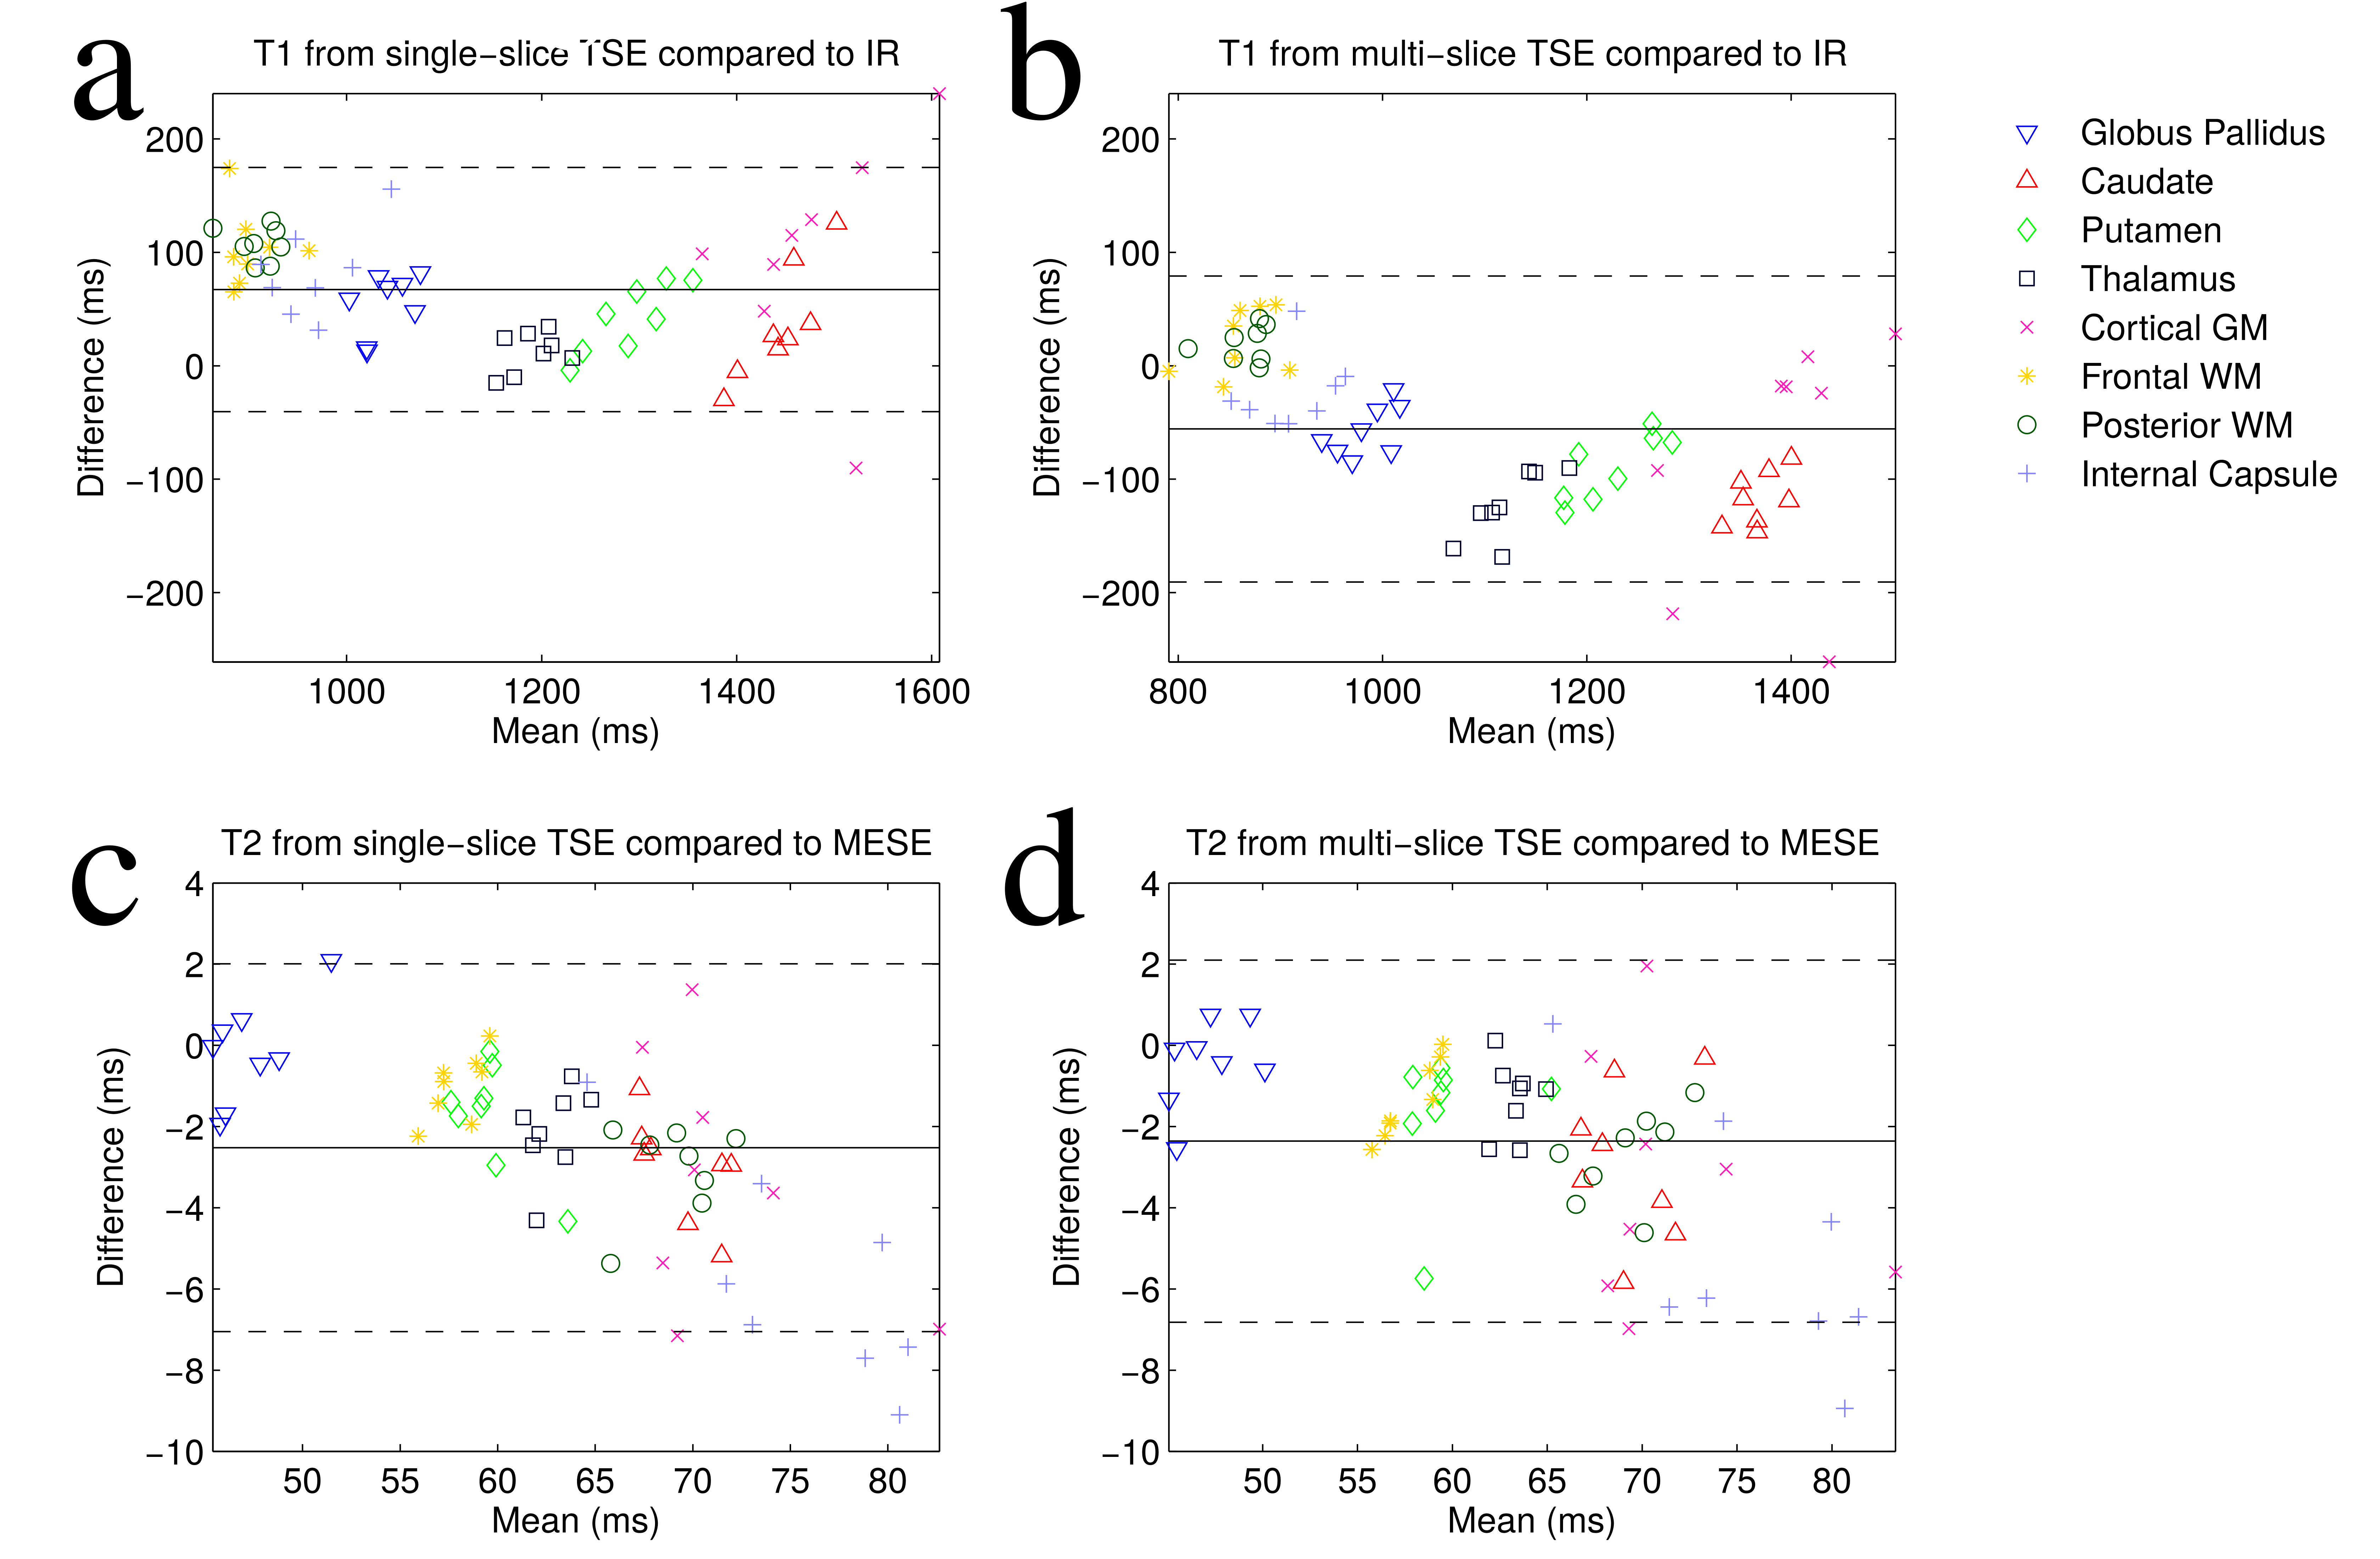
Statistics: Normality was checked with Q-Q plots and histograms. Wilcoxon rank sum test was used to compare fitting methods (α=0.05), with Bonferroni correction for multiple comparisons. Methods were also compared with Bland-Altman plots4.
Results
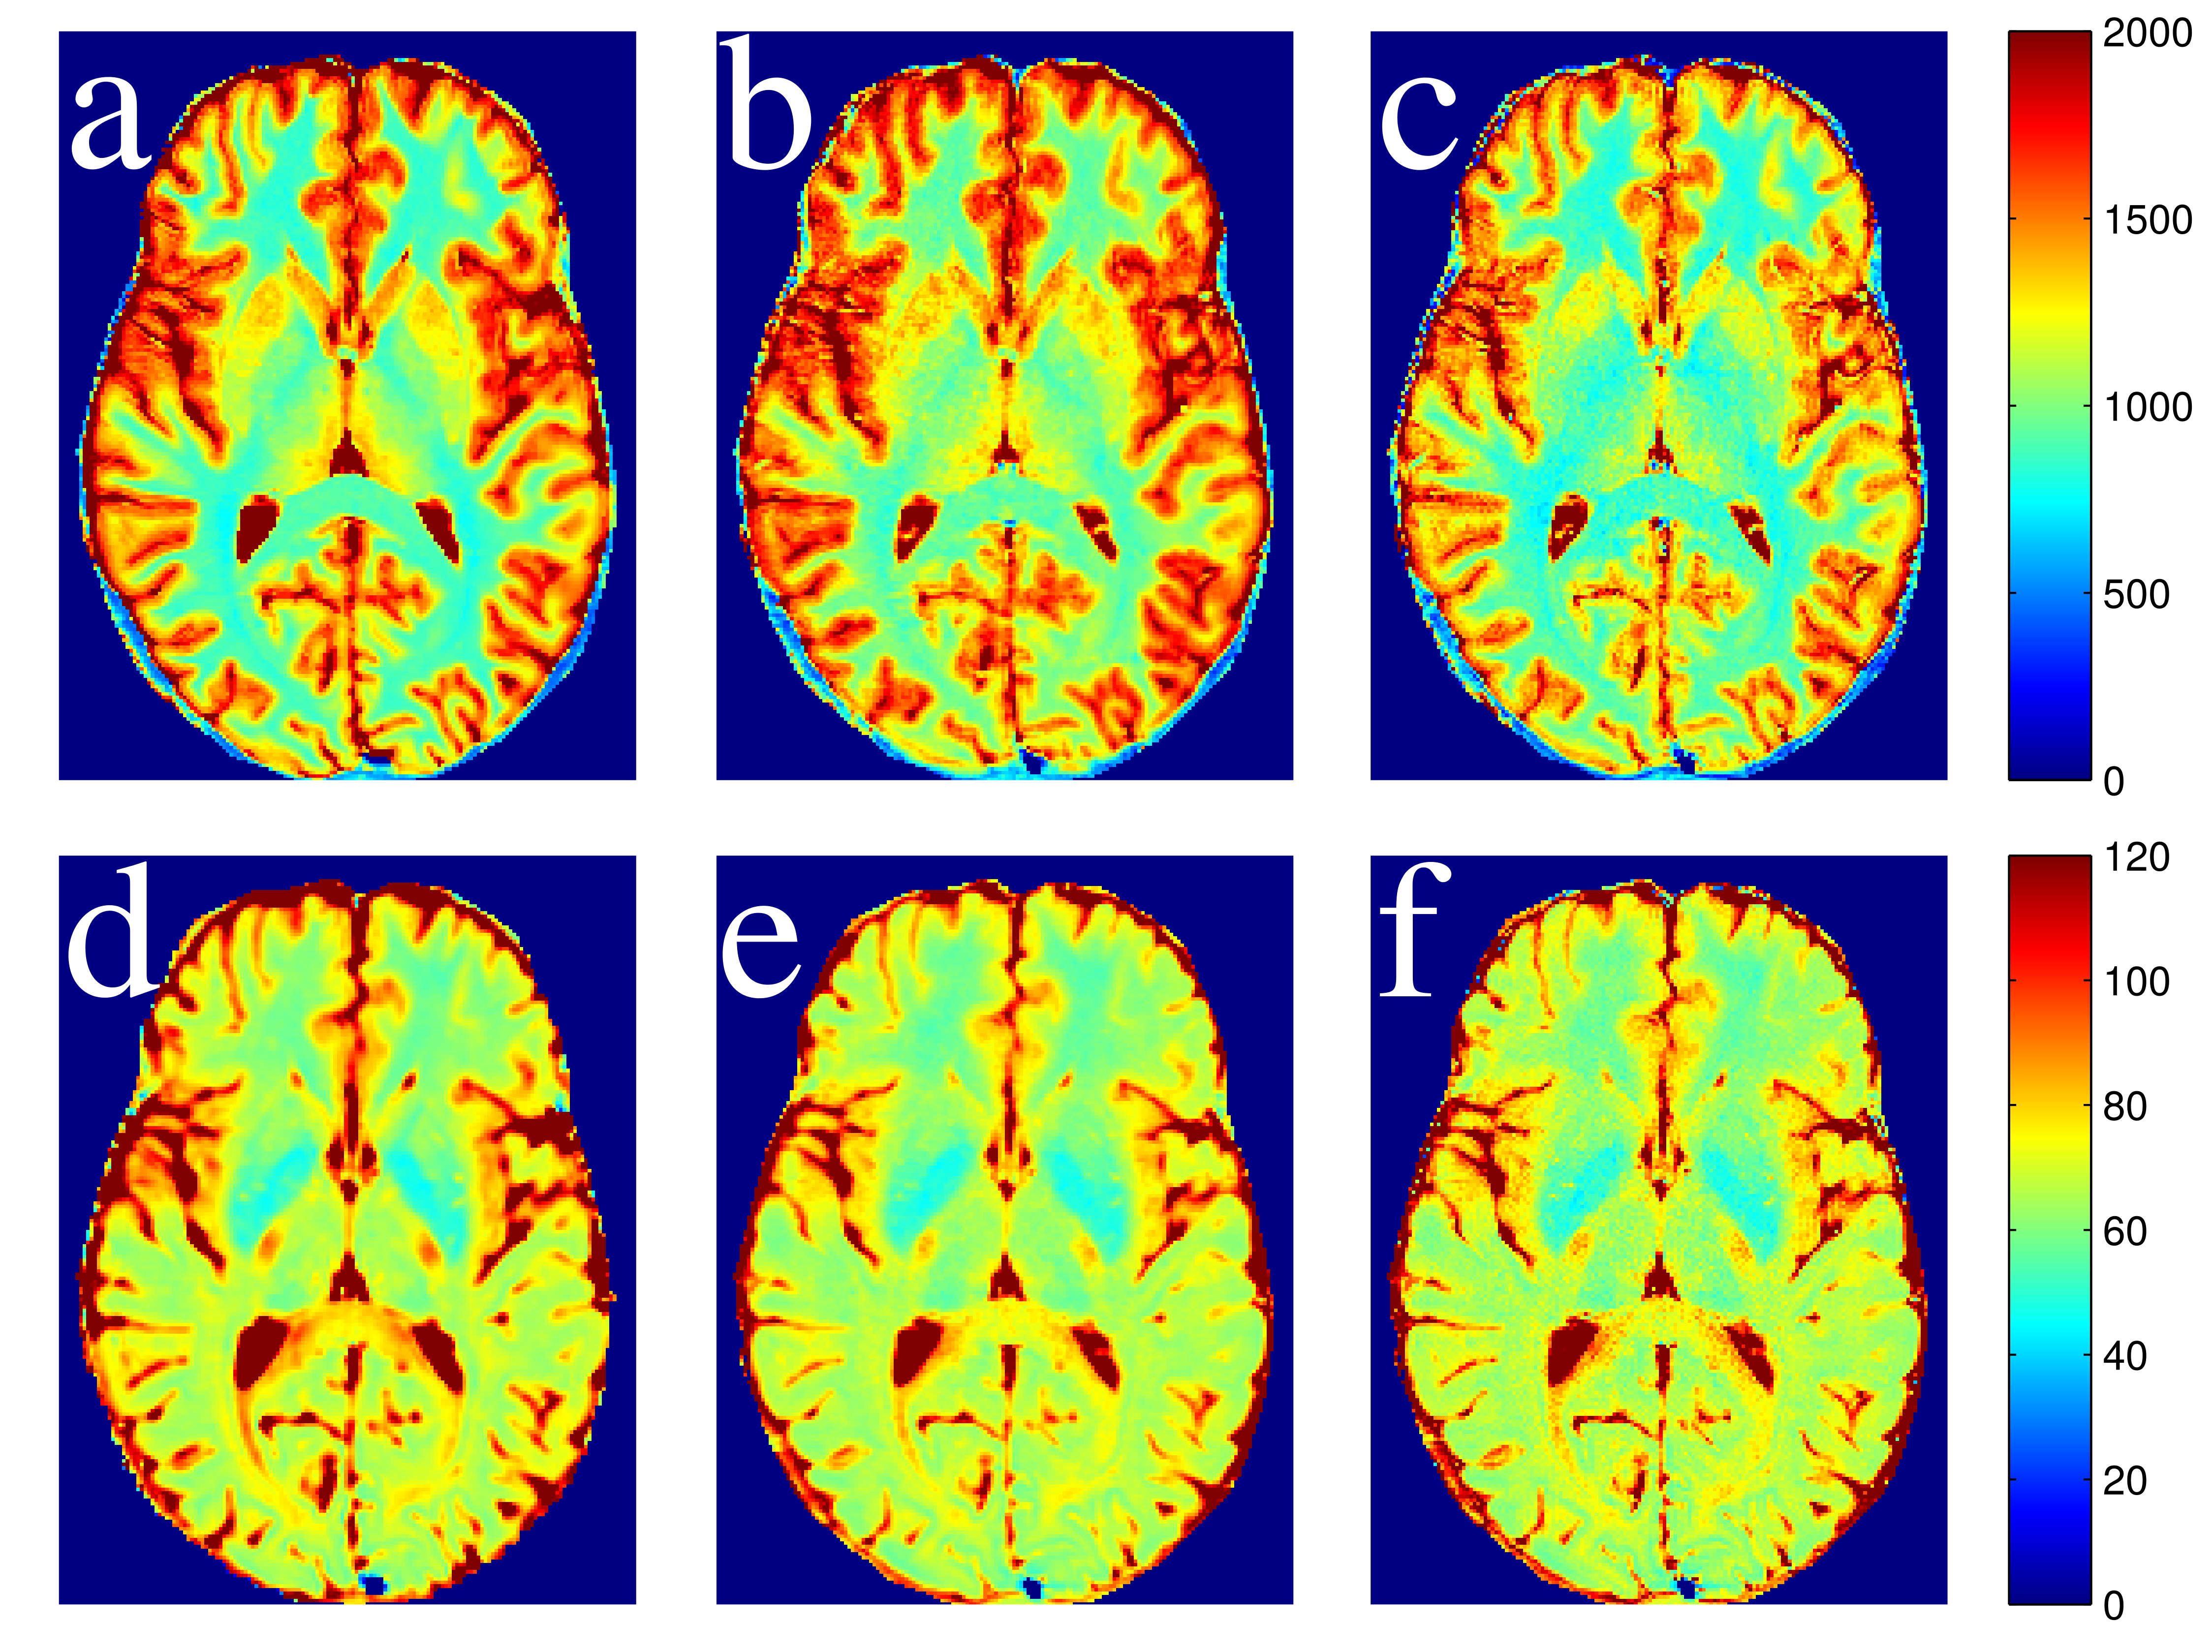
T1 and T2 maps calculated from the single-slice and multi-slice TSE data sets are compared to the gold standard maps (Figure 2). Greater signal reduction is observed in the multi-slice PDw image relative to single-slice than in the T1w image (Figure 3). Averages from each ROI are displayed in Table 1, and Bland-Altman plots comparing the corresponding values to gold standard are shown in Figure 4. T2 values from single and multi-slice protocols are not significantly different, and are generally within ~5% of the MESE derived value, though in most cases the values from TSE data underestimated T2. T1 values from TSE protocols are within 13% of IR values, but are significantly different from each other (p<0.007), with multi-slice tending to underestimate, and single-slice tending to overestimate T1 (~10% difference between single and multi-slice).Discussion
The described three-point TSE protocol provides T1 within 13%, and T2 within 5% of gold standard values with full-brain coverage in ~7 minutes. T1 values in the white matter are similar to those reported in literature5. T1 values from multi-slice TSE underestimate T1 relative to single-slice experiments, most likely due to incidental MT, and/or cross-talk between slices. Due to the very different TRs in dual-echo and T1w acquisitions, slice acquisition order differs between methods. While measures were taken to reduce these effects, optimization of slice acquisition order may reduce incidental MT in the dual-echo TSE without the current time penalty. Because the T2 contrast mainly comes from the dual-echo TSE experiment, the T2 results are largely unaffected by incidental MT. In general, the approach of using only available clinical sequences in existing protocols opens the doors to wider use of quantitative relaxation measurements.Conclusions
T1 and T2 are determined from only PDw, T2w and T1w images, and a B1 map. With the exception of the rapid B1 map, versions of each sequence are part of a standard brain protocol, therefore not requiring additional specialized sequences for acquisition of relaxation maps.Acknowledgements
We would like to thank Peter Šereš for assistance with data collection. Grant support was provided by Canadian Institutes of Health Research, and Natural Sciences and Engineering Council of Canada (NSERC). Salary support for KCM was provided by scholarships from NSERC, and Alberta Innovates Health Solutions.
References
1. McPhee KC, Wilman AH. T2 quantification from only proton density and T2-weighted MRI by modelling actual refocusing angles. NeuroImage. 2015 Sep;118:642–50.
2. Sacolick LI, Wiesinger F, Hancu I, Vogel MW. B1 mapping by Bloch-Siegert shift. Magn Reson Med. 2010;63(5):1315–1322.
3. McPhee KC, Wilman AH. Transverse relaxation and flip angle mapping: Evaluation of simultaneous and independent methods using multiple spin echoes. Magn Reson Med. 2017 May 1;77(5):2057–65.
4. Bland, Martin J, Altman D. Statistical Methods for Assessing Agreement Between Two Methods of Clinical Measurement. The Lancet. 1986 Feb 8;327(8476):307–10.
5. Wansapura JP, Holland SK, Dunn RS, Ball WS. NMR relaxation times in the human brain at 3.0 tesla. J Magn Reson Imaging JMRI. 1999 Apr;9(4):531–8.
Figures
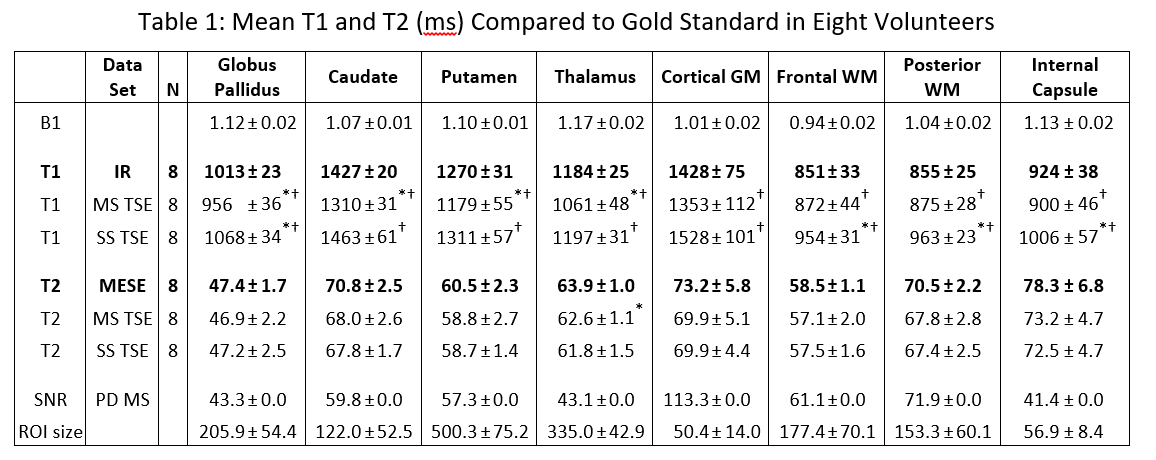
* indicates the value is significantly different compared to gold standard.
† indicates value derived from the multi-slice protocol is significantly different from the value derived from the single-slice protocol.