2265
Monte Carlo Modeling of Multiple Spin Echo Signals in the Presence of Liver Iron Overload1School of Automation Engineering, University of Electronic Science and Technology of China, Chengdu, China, 2School of Biomedical Engineering and Guangdong Provincial Key Laboratory of Medical Image Processing, Southern Medical University, Guangzhou, China, 3Radiology, University of Wisconsin-Madison, Madison, WI, United States, 4Medical Physics, University of Wisconsin-Madison, Madison, WI, United States, 5Biomedical Engineering, University of Wisconsin-Madison, Madison, WI, United States, 6Medicine, University of Wisconsin-Madison, Madison, WI, United States, 7Emergency Medicine, University of Wisconsin-Madison, Madison, WI, United States
Synopsis
Multiple spin echo (MSE) imaging may enable improved quantification and characterization of tissue iron deposition, with application for assessment of liver iron overload. However, iron deposition generally results in non-exponential signal decay in MSE imaging, and MSE-based R2 (1/T2) relaxometry can depend on the inter-echo time. Additionally, it is cumbersome and expensive to empirically calibrate the R2 relaxometry-iron concentration relationship. In this work, we investigate the effect of inter-echo time on MSE signal in the presence of liver iron overload using Monte Carlo simulations. This Monte Carlo approach may enable improved calibration of MSE-based measurements of iron concentration.
Introduction
Single spin echo (SSE)-based R2 (1/T2) has been calibrated to biopsy-measured liver iron concentration (LIC) at 1.5T1. Compared to SSE imaging, multiple spin echo (MSE) imaging enables faster data acquisition by acquiring an echo train in a single TR. Furthermore, MSE imaging has been proposed to separately quantify dispersed (ferritin-like) and aggregated (hemosiderin-like) iron deposition2. However, MSE-based relaxivity-iron calibration remains challenging for the following reasons: 1) MSE imaging may induce non-exponential signal decay in iron-loaded tissue2; 2) MSE-based R2 measurements can vary with inter-echo time3; 3) It is cumbersome and expensive to empirically calibrate the relaxation-iron relationship. Therefore, the purpose of this work was to investigate the effect of inter-echo time on MSE signals in the presence of liver iron overload using Monte Carlo simulations at both 1.5T and 3.0T.Methods
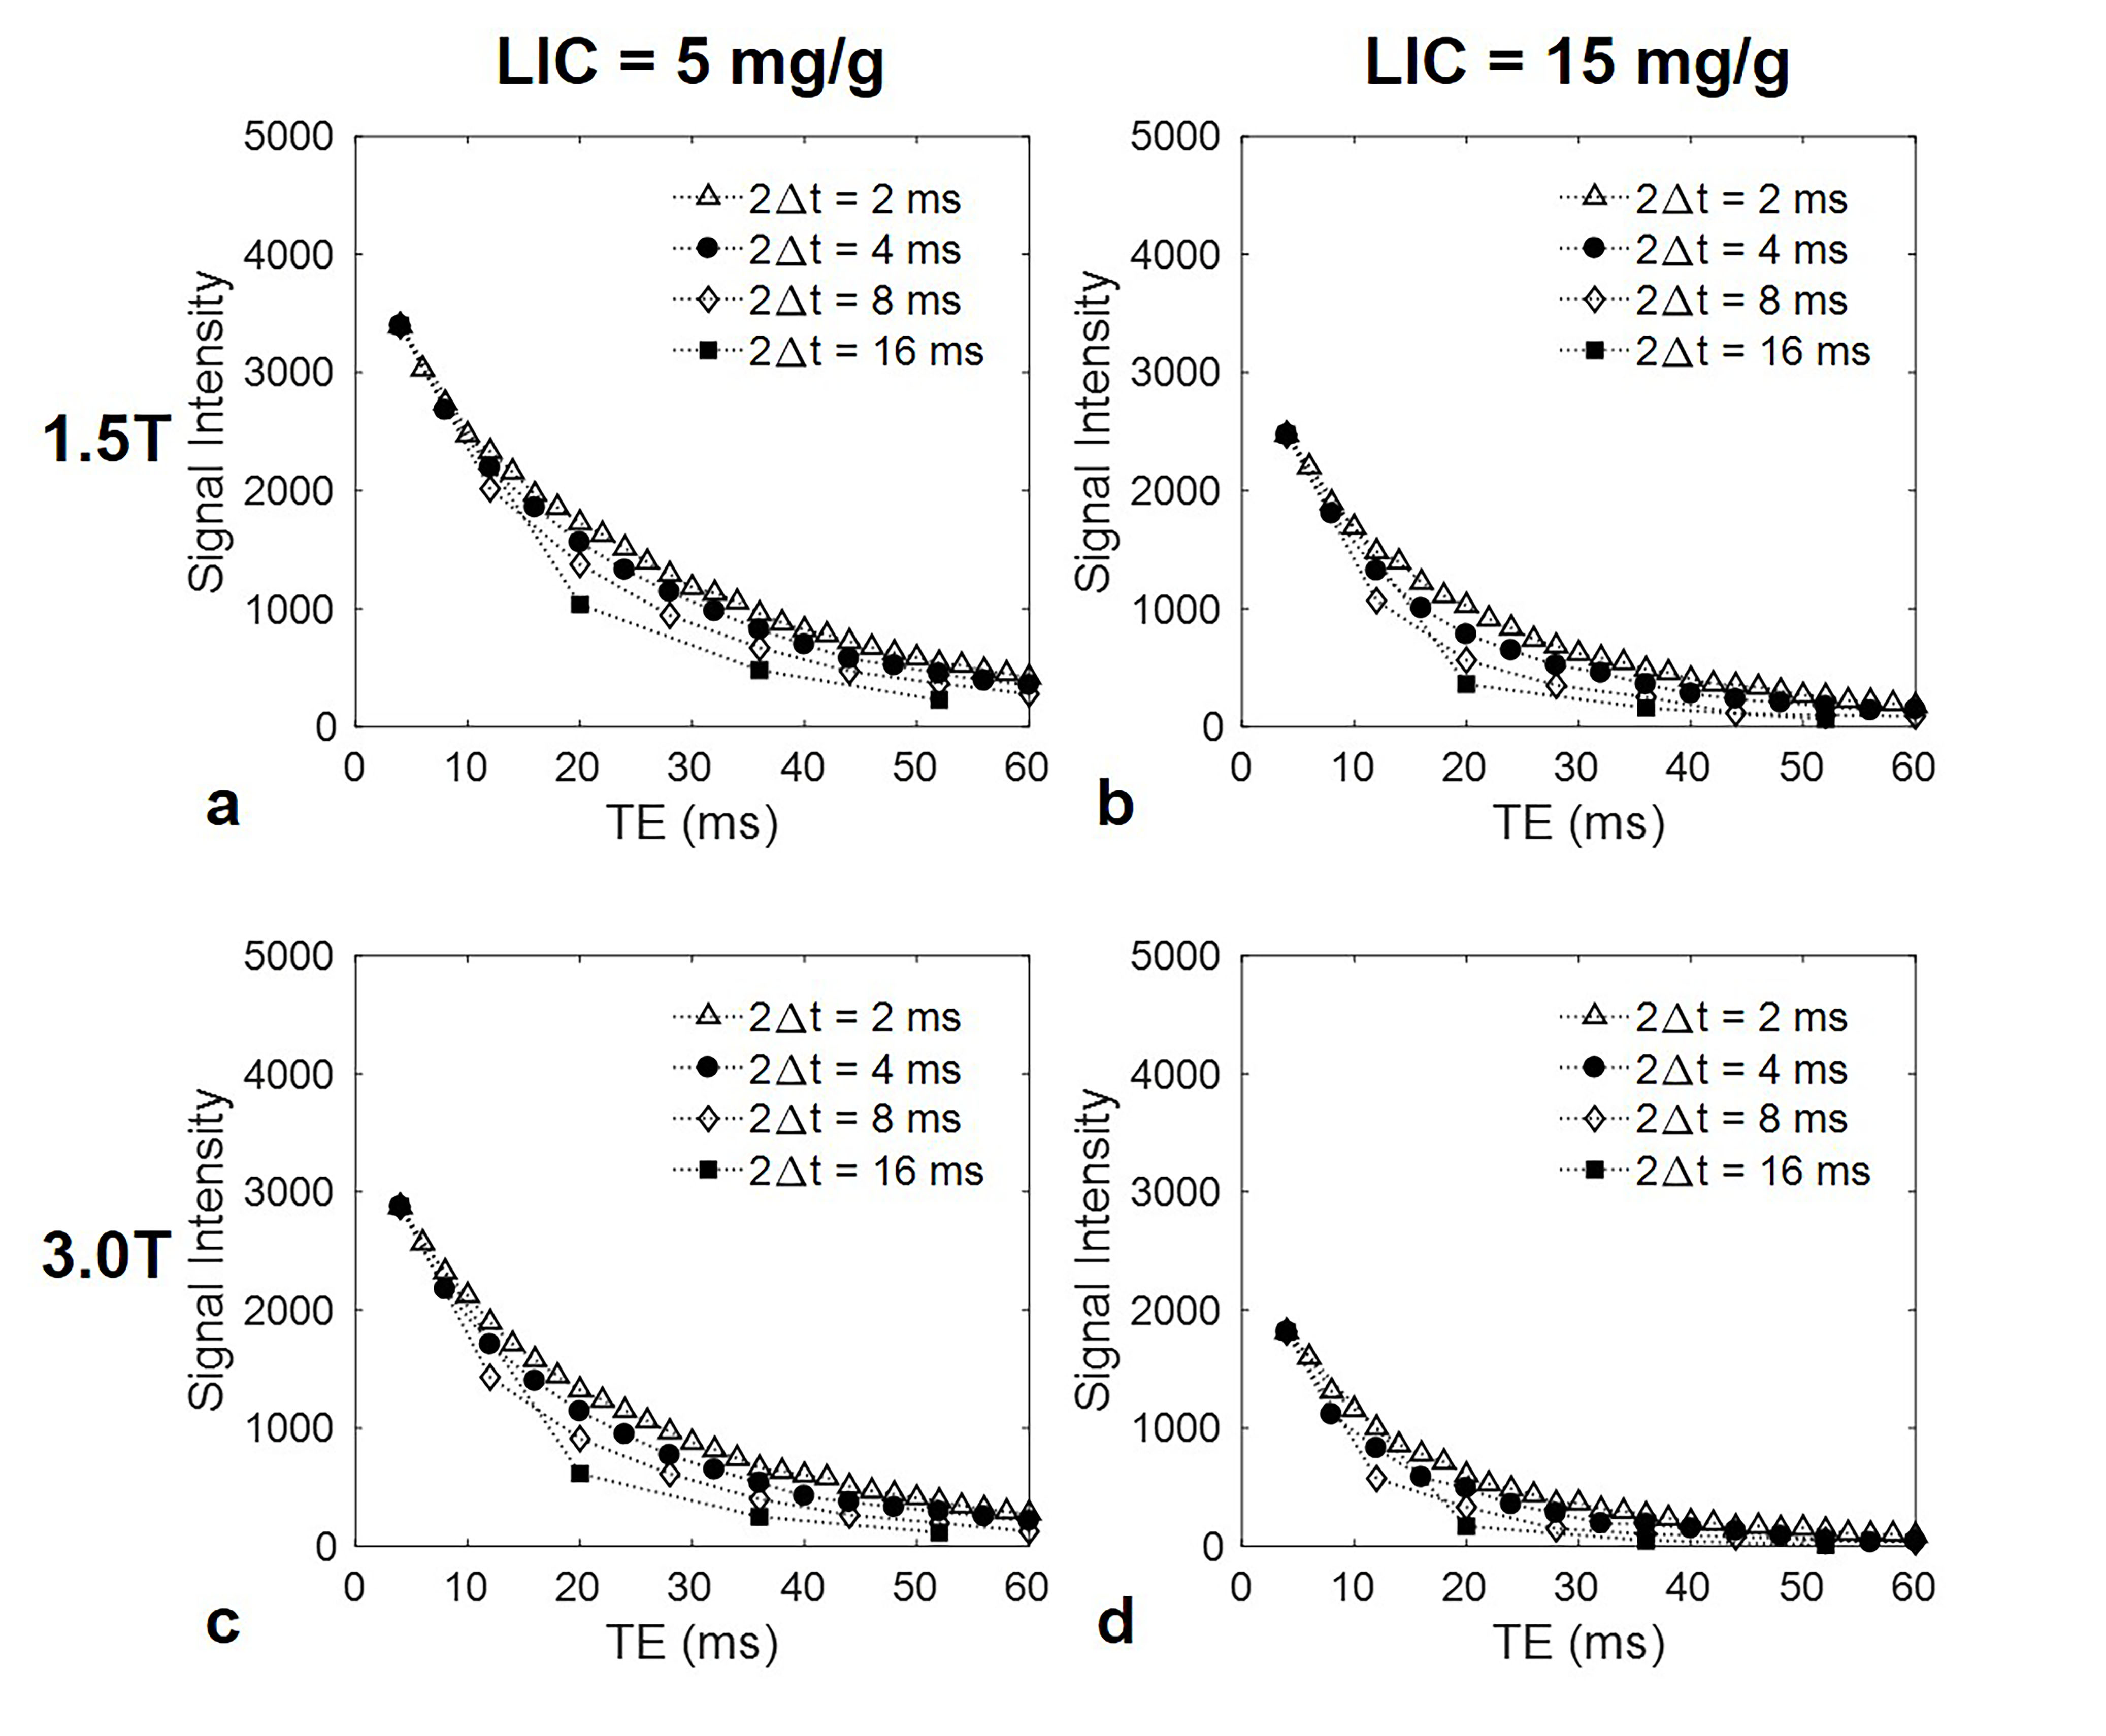
Signal generation: We extended a previously developed Monte Carlo model4, 5 for MSE imaging of liver iron overload. This model incorporates realistic liver structure, iron distribution (hemosiderin only, and no ferritin in the current model), and proton mobility. Specifically, hemosiderin iron spheres following a LIC-matched distribution were first distributed in a virtual liver volume to generate microscopic magnetic field disturbances. Phase accrual for individual protons was then calculated from the random motion of each proton through the magnetic disturbances. For a MSE sequence with multiple 180° refocusing pulses occurring at times $$$\tau$$$, 2$$$\tau$$$+∆t, 2$$$\tau$$$+3∆t, 2$$$\tau$$$+5∆t, etc., following an initial 90° pulse, spin echoes form at times 2$$$\tau$$$, 2$$$\tau$$$+2∆t, 2$$$\tau$$$+4∆t, 2$$$\tau$$$+6∆t, etc. The MSE sequences were simulated with the first echo time 2$$$\tau$$$=4ms and several inter-echo times (2∆t from 0.5 to 28ms) within a maximum echo time of 60ms. The synthesized MSE signal was subsequently obtained to predict the R2 relaxation for each LIC.
Signal fitting and analysis: Two models were adapted to fit the synthesized MSE signal:
1) Each set of MSE signals was fit to a monoexponential signal decay with a constant offset, to evaluate the effect of inter-echo time on MSE R2-iron calibration.
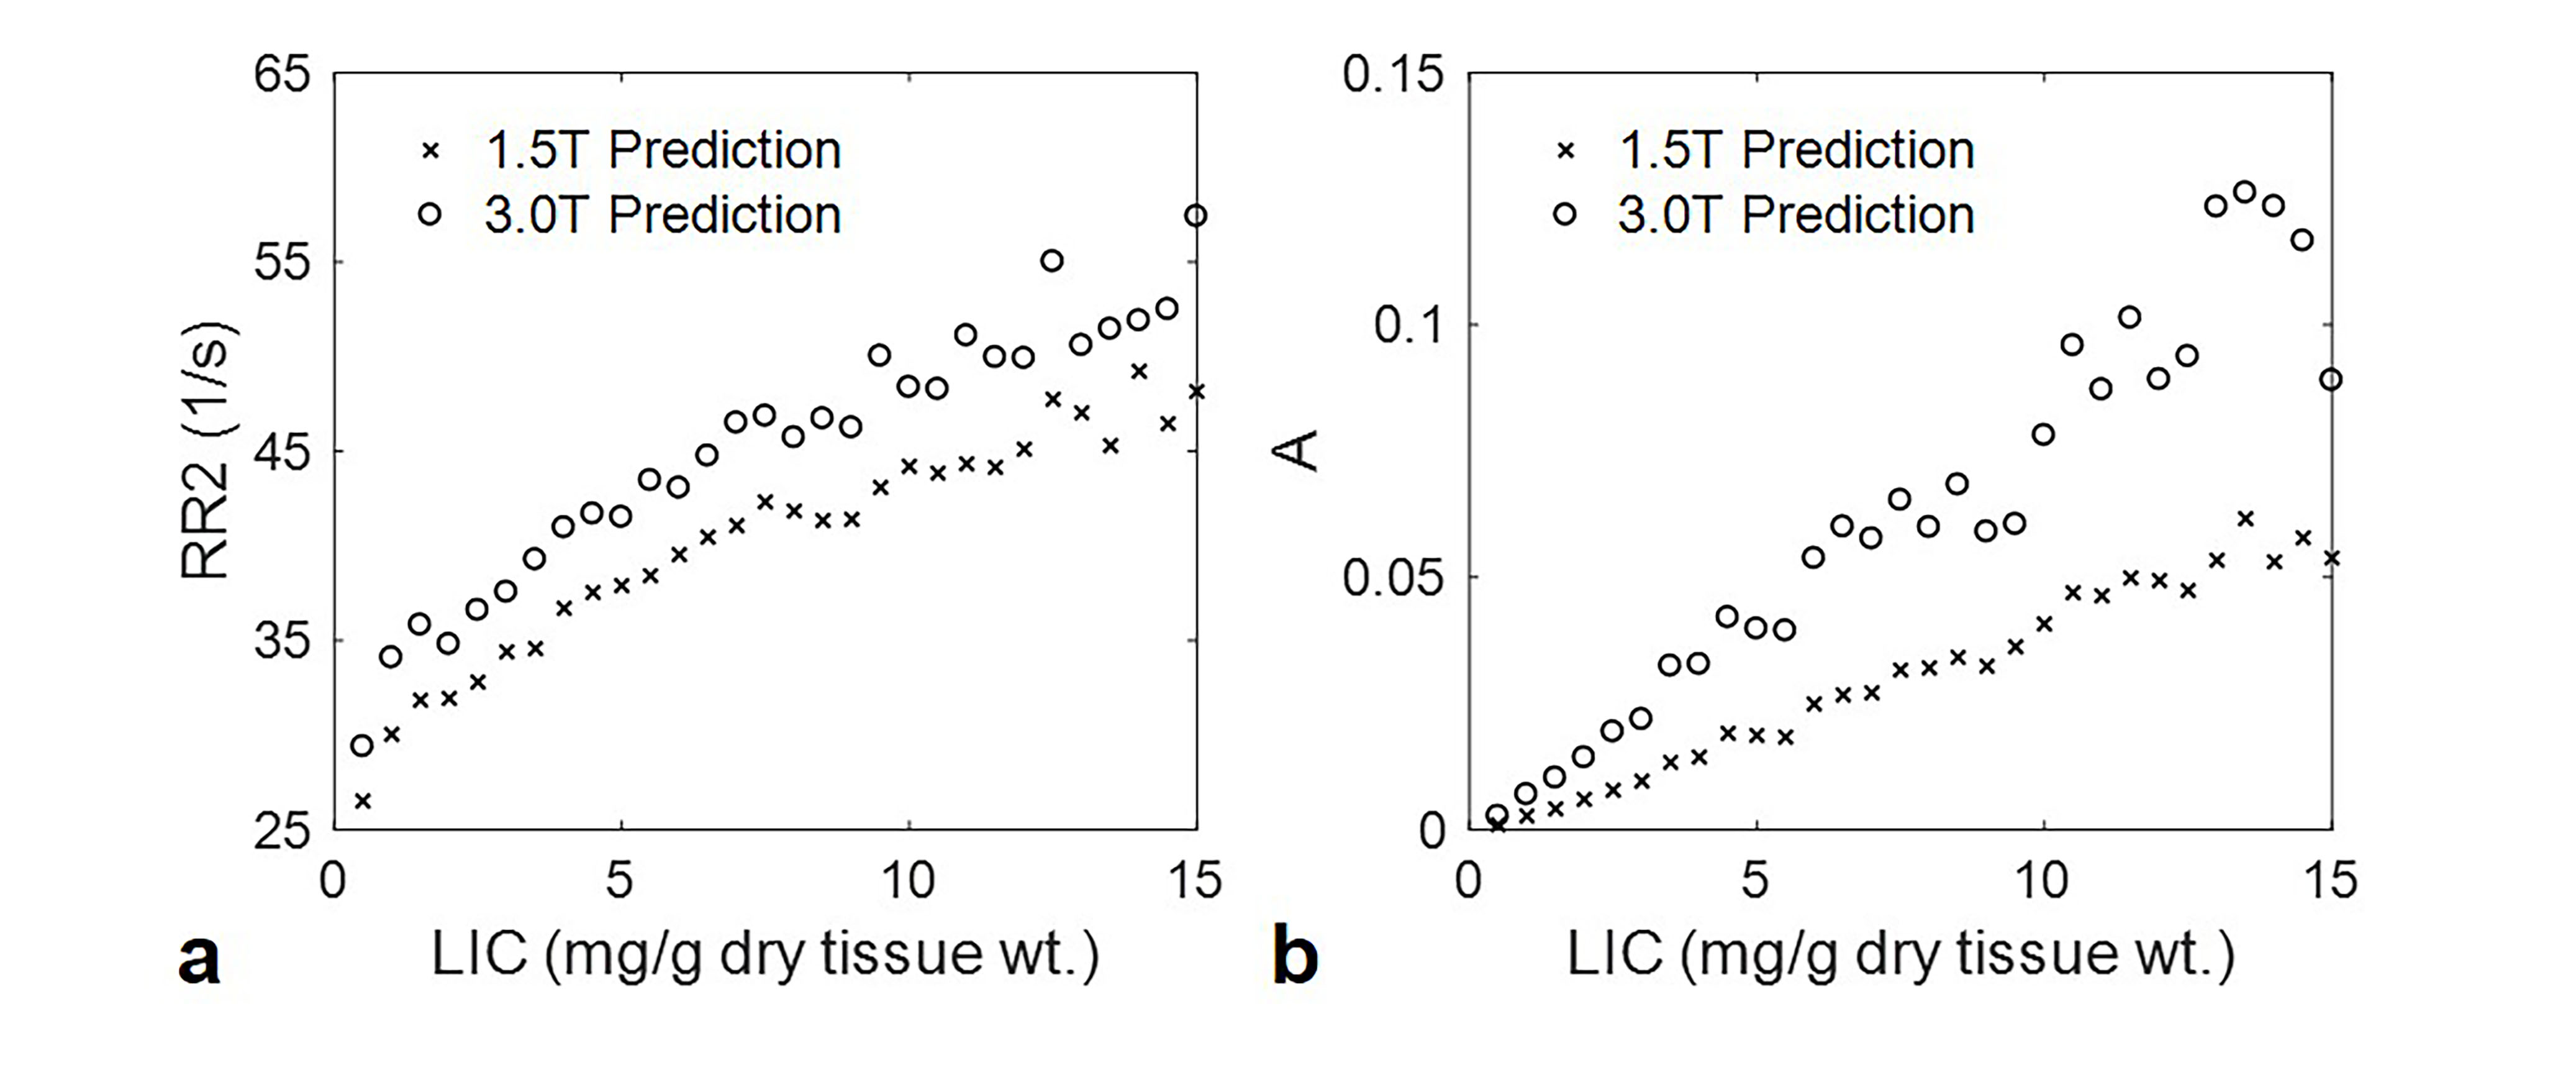
2) Multiple sets of MSE signals with different inter-echo times (2∆t from 2 to 28ms with spacing of 2ms) were jointly fit using a non-exponential model that separates dispersed versus aggregated iron deposition signal contributions2, 6:$$S=S_0e^{-RR2×TE}exp[-A^{3/4}(\Delta t)^{3/4}(TE-t_s)^{3/8}]$$ where S0 is the initial signal intensity, RR2 is the reduced transverse relaxation rate reflecting the effect of ferritin iron, A is the aggregation index reflecting the effect of hemosiderin iron, and ts is a time shift given by $$t_s=2\tau[1-(\tau/\Delta t)^2].$$ The unknown parameters (S0, RR2, A) are estimated by nonlinear least squares fitting using a Levenberg-Marquardt algorithm.
The Spearman rank order test was used to evaluate the correlation between MSE R2 and both LIC and inter-echo time, and the correlation between RR2 and LIC. Linear regression was performed between A and LIC.
Results
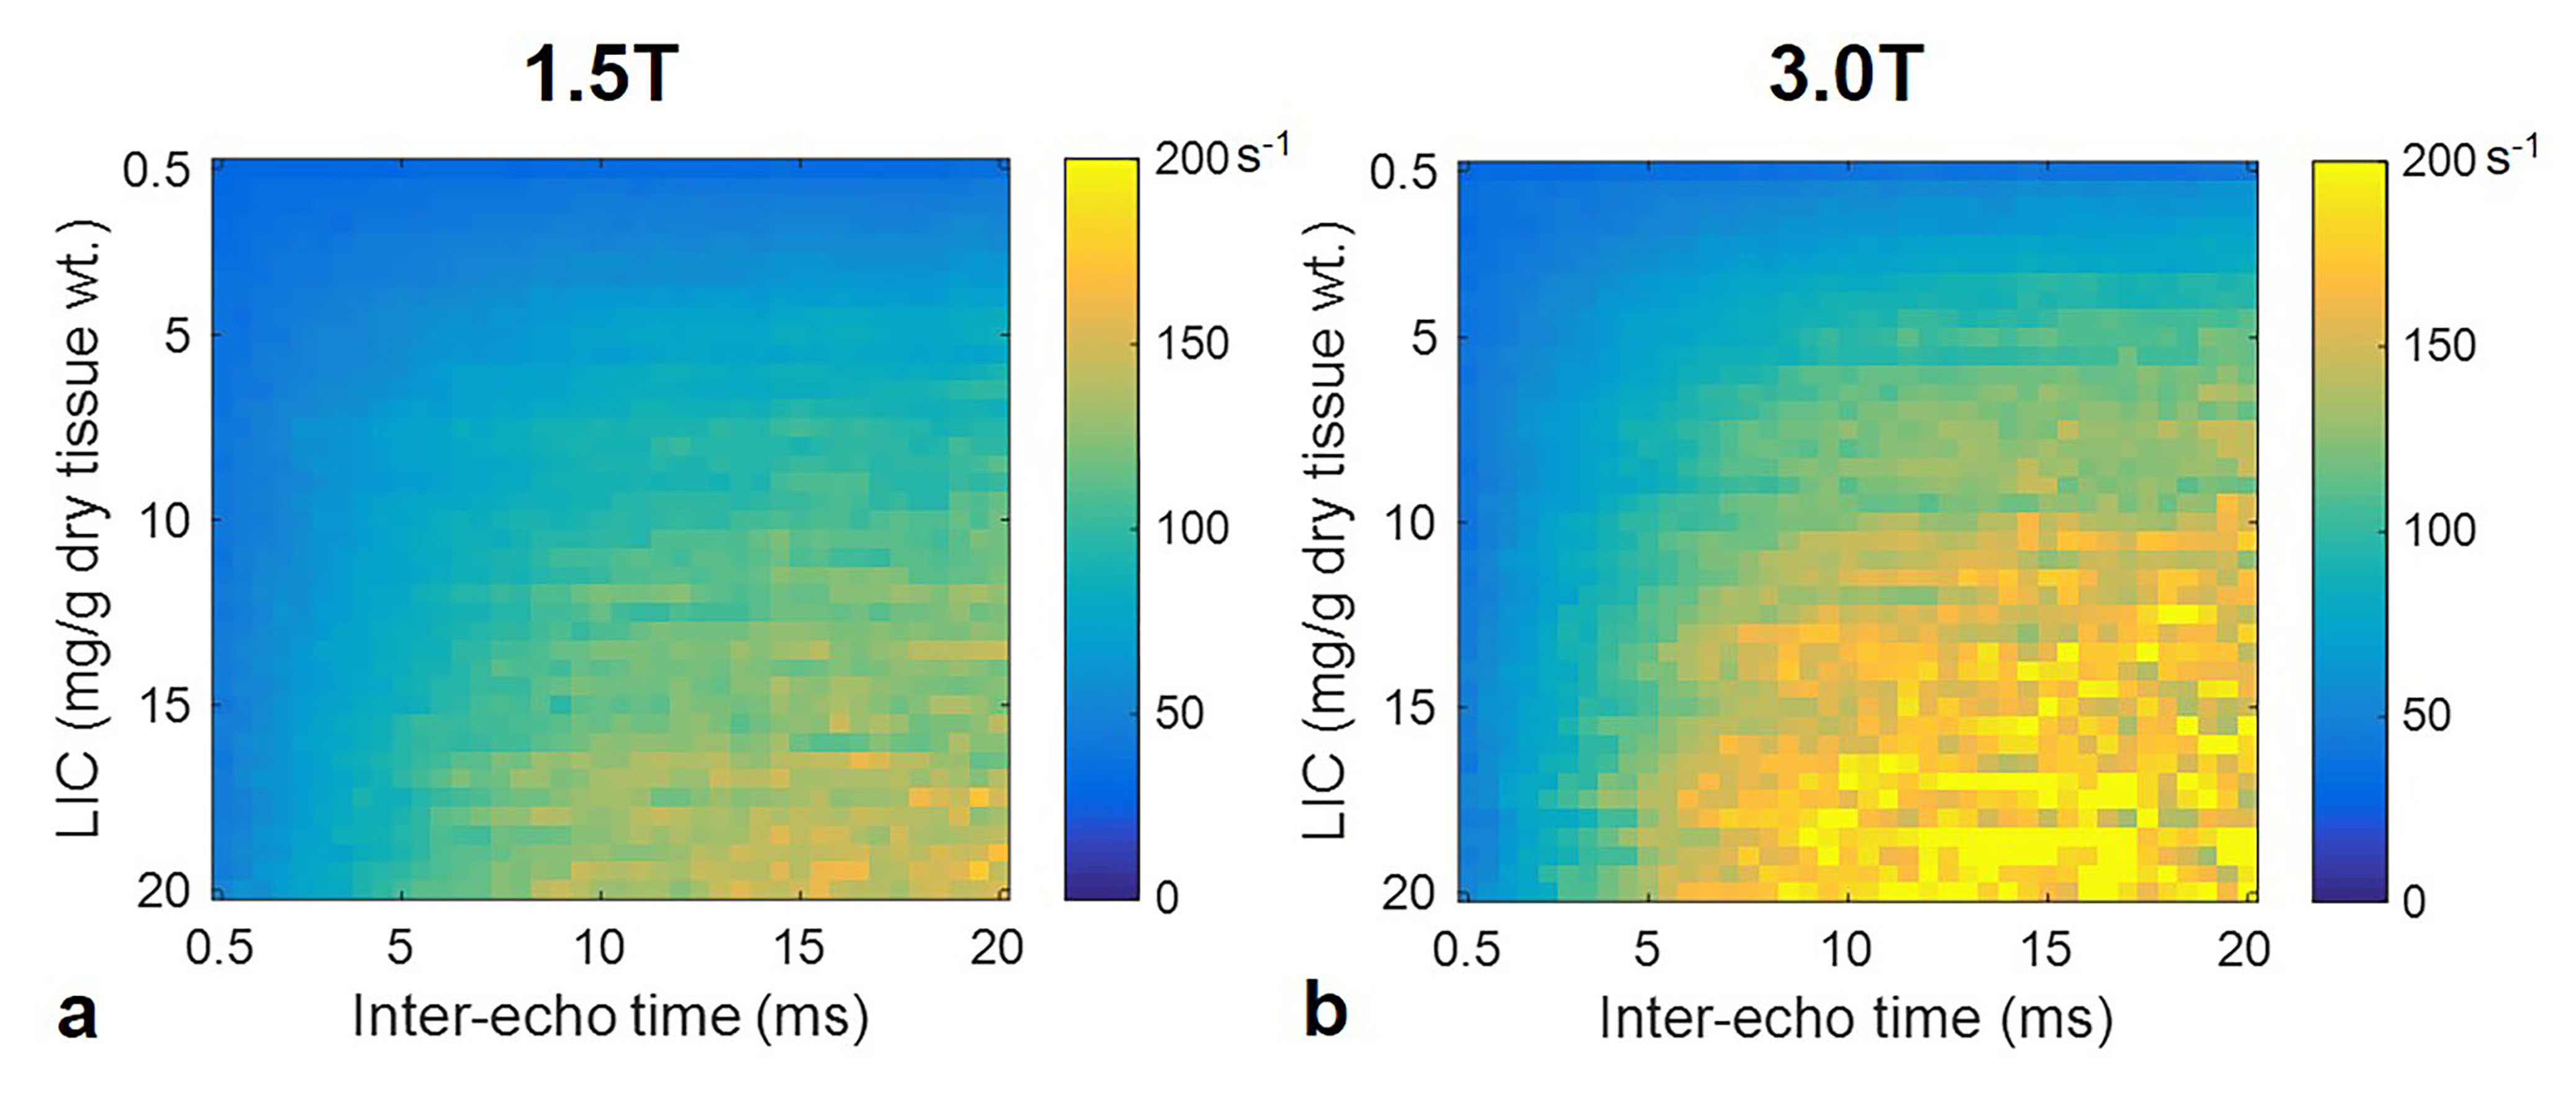
Examples of simulated MSE signal decays are shown in Figure 1. The signal decays showed a clear dependence on LIC, inter-echo time, and field strength. In addition, a departure from monoexponential signal decay was observed (not shown). A good signal fit of MSE R2 was obtained for LIC≤20 mg/g and 2∆t≤20ms with r2>0.990 (see Figure 2). Highly significant correlations were found between predicted MSE R2 and both LIC and inter-echo time, with Spearman rank order ranging from 0.716 to 0.994 (P<0.003). Similar results for different combinations of LIC and inter-echo time were also demonstrated in Figure 3. As shown in Figure 4, strong positive correlations were observed between RR2 and LIC, as well as between A and LIC.Discussion & Conclusions
This work extends a previously developed Monte Carlo model to demonstrate the effect of inter-echo time on MSE signals in the presence of liver iron overload. The predicted MSE R2 increases with LIC and inter-echo time in a curvilinear pattern, which is consistent with previous experimental studies3. Based on the non-exponential model, the parameter A reflecting the effect of hemosiderin iron, demonstrates a positive linear relationship with LIC, which also agrees well with previous studies7, 8. However, a curvilinear relationship is observed between RR2 with LIC even though no ferritin iron is included in the simulations. This result is discordant with the linear relationship found between RR2 and hemosiderin iron in a phantom study7 and no correlation between RR2 and LIC for an in vivo study8. This discordance may be due to differences between the simulations and previously analyzed phantoms, or a modeling error. Future work is needed to validate the Monte Carlo model using phantoms (with known iron components, susceptibility, and size), as well as in vivo experiments. In conclusion, the Monte Carlo simulations may enable an improved understanding of the effect of liver iron deposition on MSE imaging.Acknowledgements
We acknowledge the support of China Scholarship Council and the NIH (R01 DK083380, R01 DK088925, R01 DK100651 and K24 DK102595). The authors wish to acknowledge support from GE Healthcare who provides research support to UW-Madison.References
1. St Pierre TG, Clark PR, Chua-anusorn W, Fleming AJ, Jeffrey GP, Olynyk JK, Pootrakul P, Robins E, Lindeman R. Noninvasive measurement and imaging of liver iron concentrations using proton magnetic resonance. Blood 2005;105(2):855-861.
2. Jensen JH, Chandra R. Theory of nonexponential NMR signal decay in liver with iron overload or superparamagnetic iron oxide particles. Magn Reson Med 2002;47(6):1131-1138.
3. Wood JC, Fassler JD, Meade T. Mimicking liver iron overload using liposomal ferritin preparations. Magn Reson Med 2004;51(3):607-611.
4. Ghugre NR, Wood JC. Relaxivity-iron calibration in hepatic iron overload: probing underlying biophysical mechanisms using a Monte Carlo model. Magn Reson Med 2011;65(3):837-847.
5. Ghugre NR, Doyle EK, Storey P, Wood JC. Relaxivity-iron calibration in hepatic iron overload: Predictions of a Monte Carlo model. Magn Reson Med 2015;74(3):879-883.
6. Jensen JH, Tang H, Tosti CL, Swaminathan SV, Nunez A, Hultman K, Szulc KU, Wu EX, Kim D, Sheth S, Brown TR, Brittenham GM. Separate MRI quantification of dispersed (ferritin-like) and aggregated (hemosiderin-like) storage iron. Magn Reson Med 2010;63(5):1201-1209.
7. Sammet CL, Swaminathan SV, Tang H, Sheth S, Jensen JH, Nunez A, Hultman K, Kim D, Wu EX, Brittenham GM, Brown TR. Measurement and correction of stimulated echo contamination in T2-based iron quantification. Magn Reson Imaging 2013;31(5):664-668.
8. Wunderlich AP, Juchems M, Cario H, Weigel M, Beer M. MRI based noninvasively differentiation between aggregated and dispersed liver iron in vivo: a feasibility study. In Proceedings of the 22nd Annual Meeting of ISMRM, Milan, Italy, 2014. p. 3596.
Figures