2264
Monte Carlo Modeling of Liver MR Signal in the Presence of Fat1School of Automation Engineering, University of Electronic Science and Technology of China, Chengdu, China, 2School of Biomedical Engineering and Guangdong Provincial Key Laboratory of Medical Image Processing, Southern Medical University, Guangzhou, China, 3Radiology, University of Wisconsin-Madison, Madison, WI, United States, 4Biomedical Engineering, University of Wisconsin-Madison, Madison, WI, United States, 5Radiology, University of California, San Diego, San Diego, CA, United States, 6Medical Physics, University of Wisconsin-Madison, Madison, WI, United States, 7Medicine, University of Wisconsin-Madison, Madison, WI, United States, 8Emergency Medicine, University of Wisconsin-Madison, Madison, WI, United States
Synopsis
Recent studies using chemical shift-encoded MRI in patients with elevated liver fat content, but no iron overload, have shown a positive correlation between proton density fat fraction (PDFF) and R2*. In this work, we investigate the underlying biophysical mechanism of this observation using Monte Carlo simulations. Results from this Monte Carlo study show a positive correlation between PDFF and R2* consistent with previous in vivo observations. Based on the PDFF-R2* relationship, the Monte Carlo simulations may provide a new means to correct for the effect of fat on R2* quantification.
Introduction
Chemical shift-encoded MRI (CSE-MRI) based proton density fat fraction (PDFF) and R2* (1/T2*) quantification in the liver are promising biomarkers for triglyceride concentration1 and iron concentration2, respectively. In previous studies3, 4, a positive correlation has been observed between PDFF and R2* in the absence of iron overload. This observation suggests that fat deposition may affect R2*, even when the presence of fat has been included in the signal model, and thus may confound R2*-based iron quantification. However, the underlying mechanism is not understood. In this work, we hypothesize that the positive correlation between PDFF and R2* results from the microscopic susceptibility of fat droplets, which accelerates dephasing of water signal and increases R2*. Therefore, the purpose of this study was to determine the underlying mechanism of the effect of fat on R2* using Monte Carlo simulations at both 1.5T and 3.0T.Methods
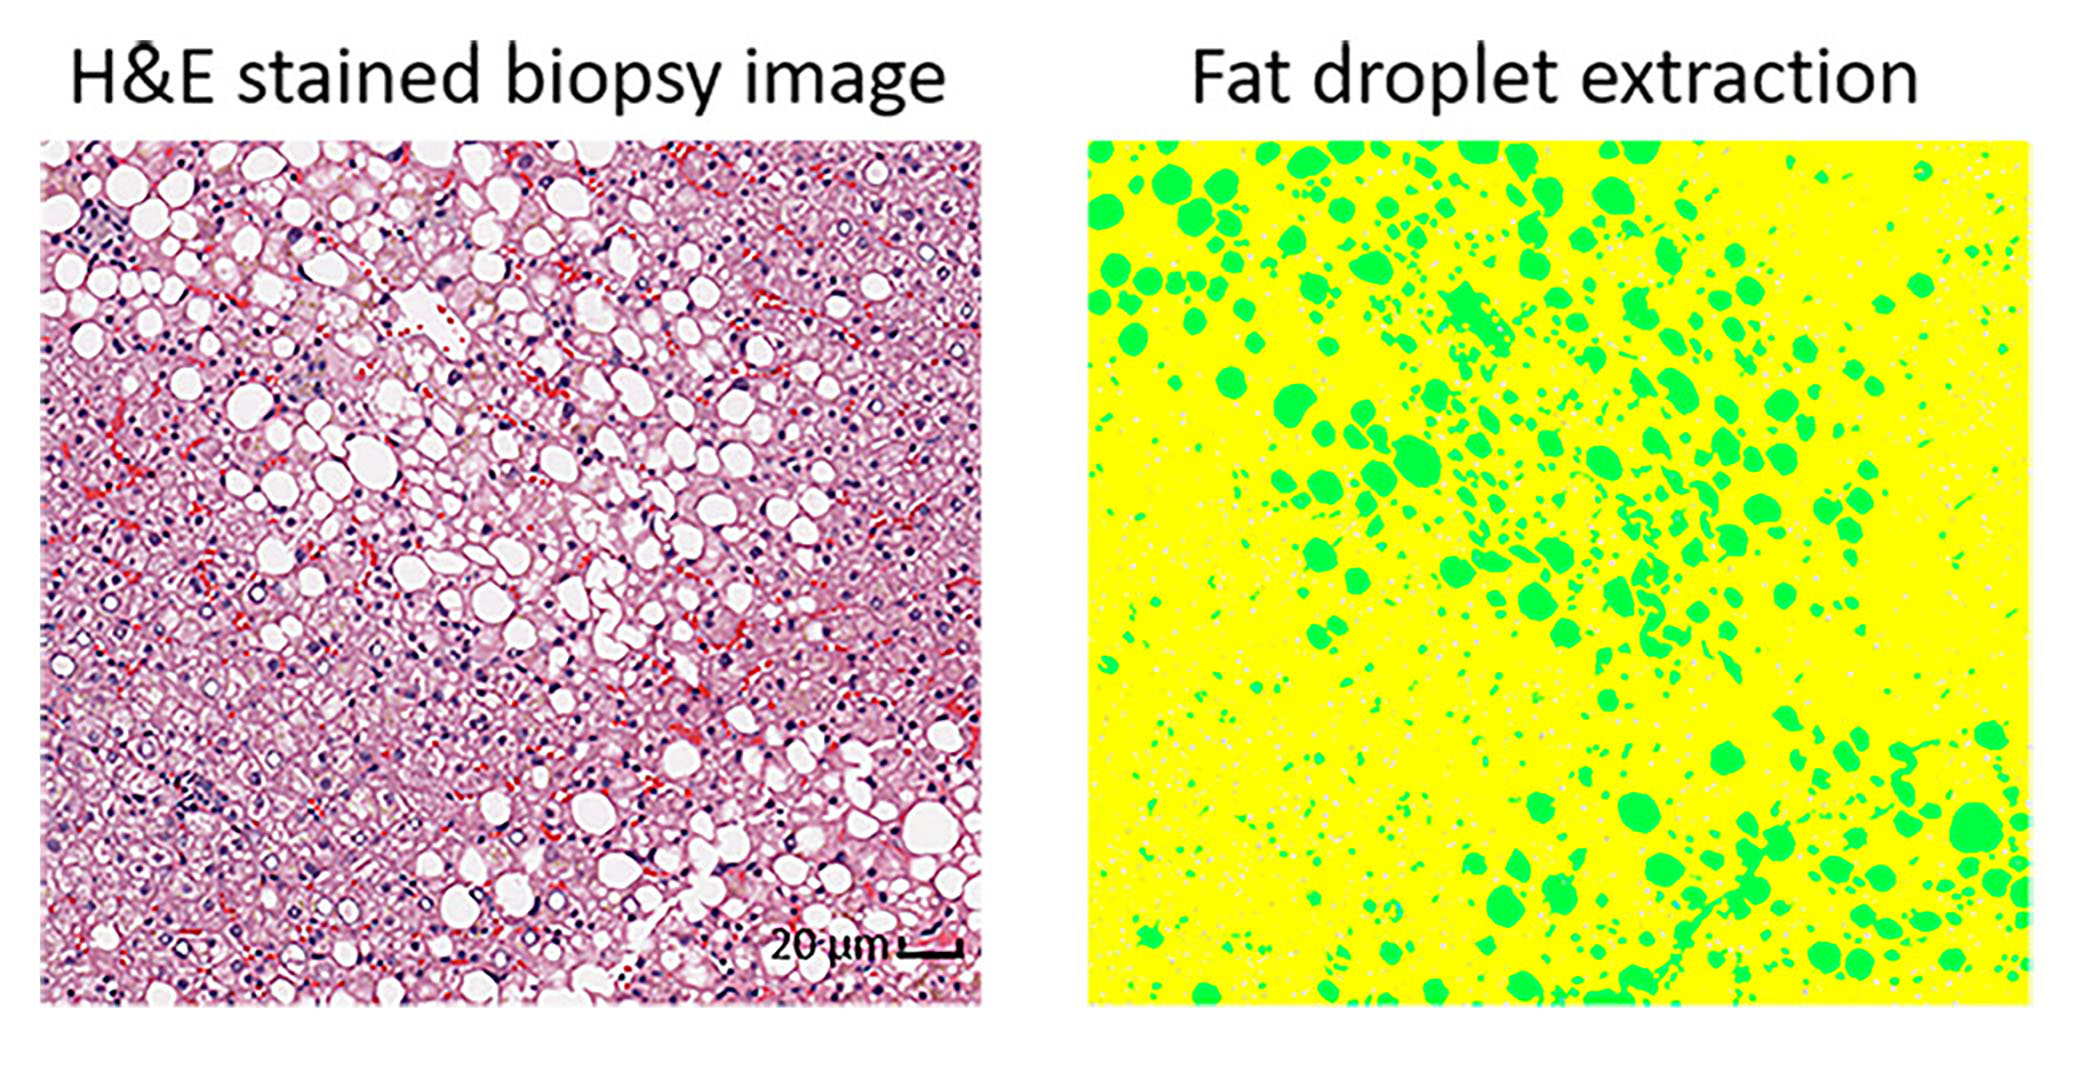
PDFF values between 0% and 35% were simulated in virtual 360×360×360µm3 cubic liver volume. This was achieved by distributing spherical fat droplets with constant radius R of 7.78µm (an empirical mean value from 18 liver biopsy specimens, an example is shown in Figure 1) randomly in the volume with no overlap until the specified fat fraction was attained.
Each fat droplet generated surrounding B0 field inhomogeneity, approximated by the magnetic dipole field equation: $$\Delta B(r,\theta)=\left\{\begin{matrix}0&r\leq R;\\\frac{B_0}{3}\chi\left(\frac{R}{r}\right)^3(3cos^2\theta -1)&r>R.\end{matrix}\right.$$where B0 is the applied magnetic field, r is the radial distance between the center and the observation point, $$$\theta$$$ is azimuthal angle to the magnetic axis, and $$$\chi$$$ represents the fat droplet susceptibility relative to the surrounding liver tissue.
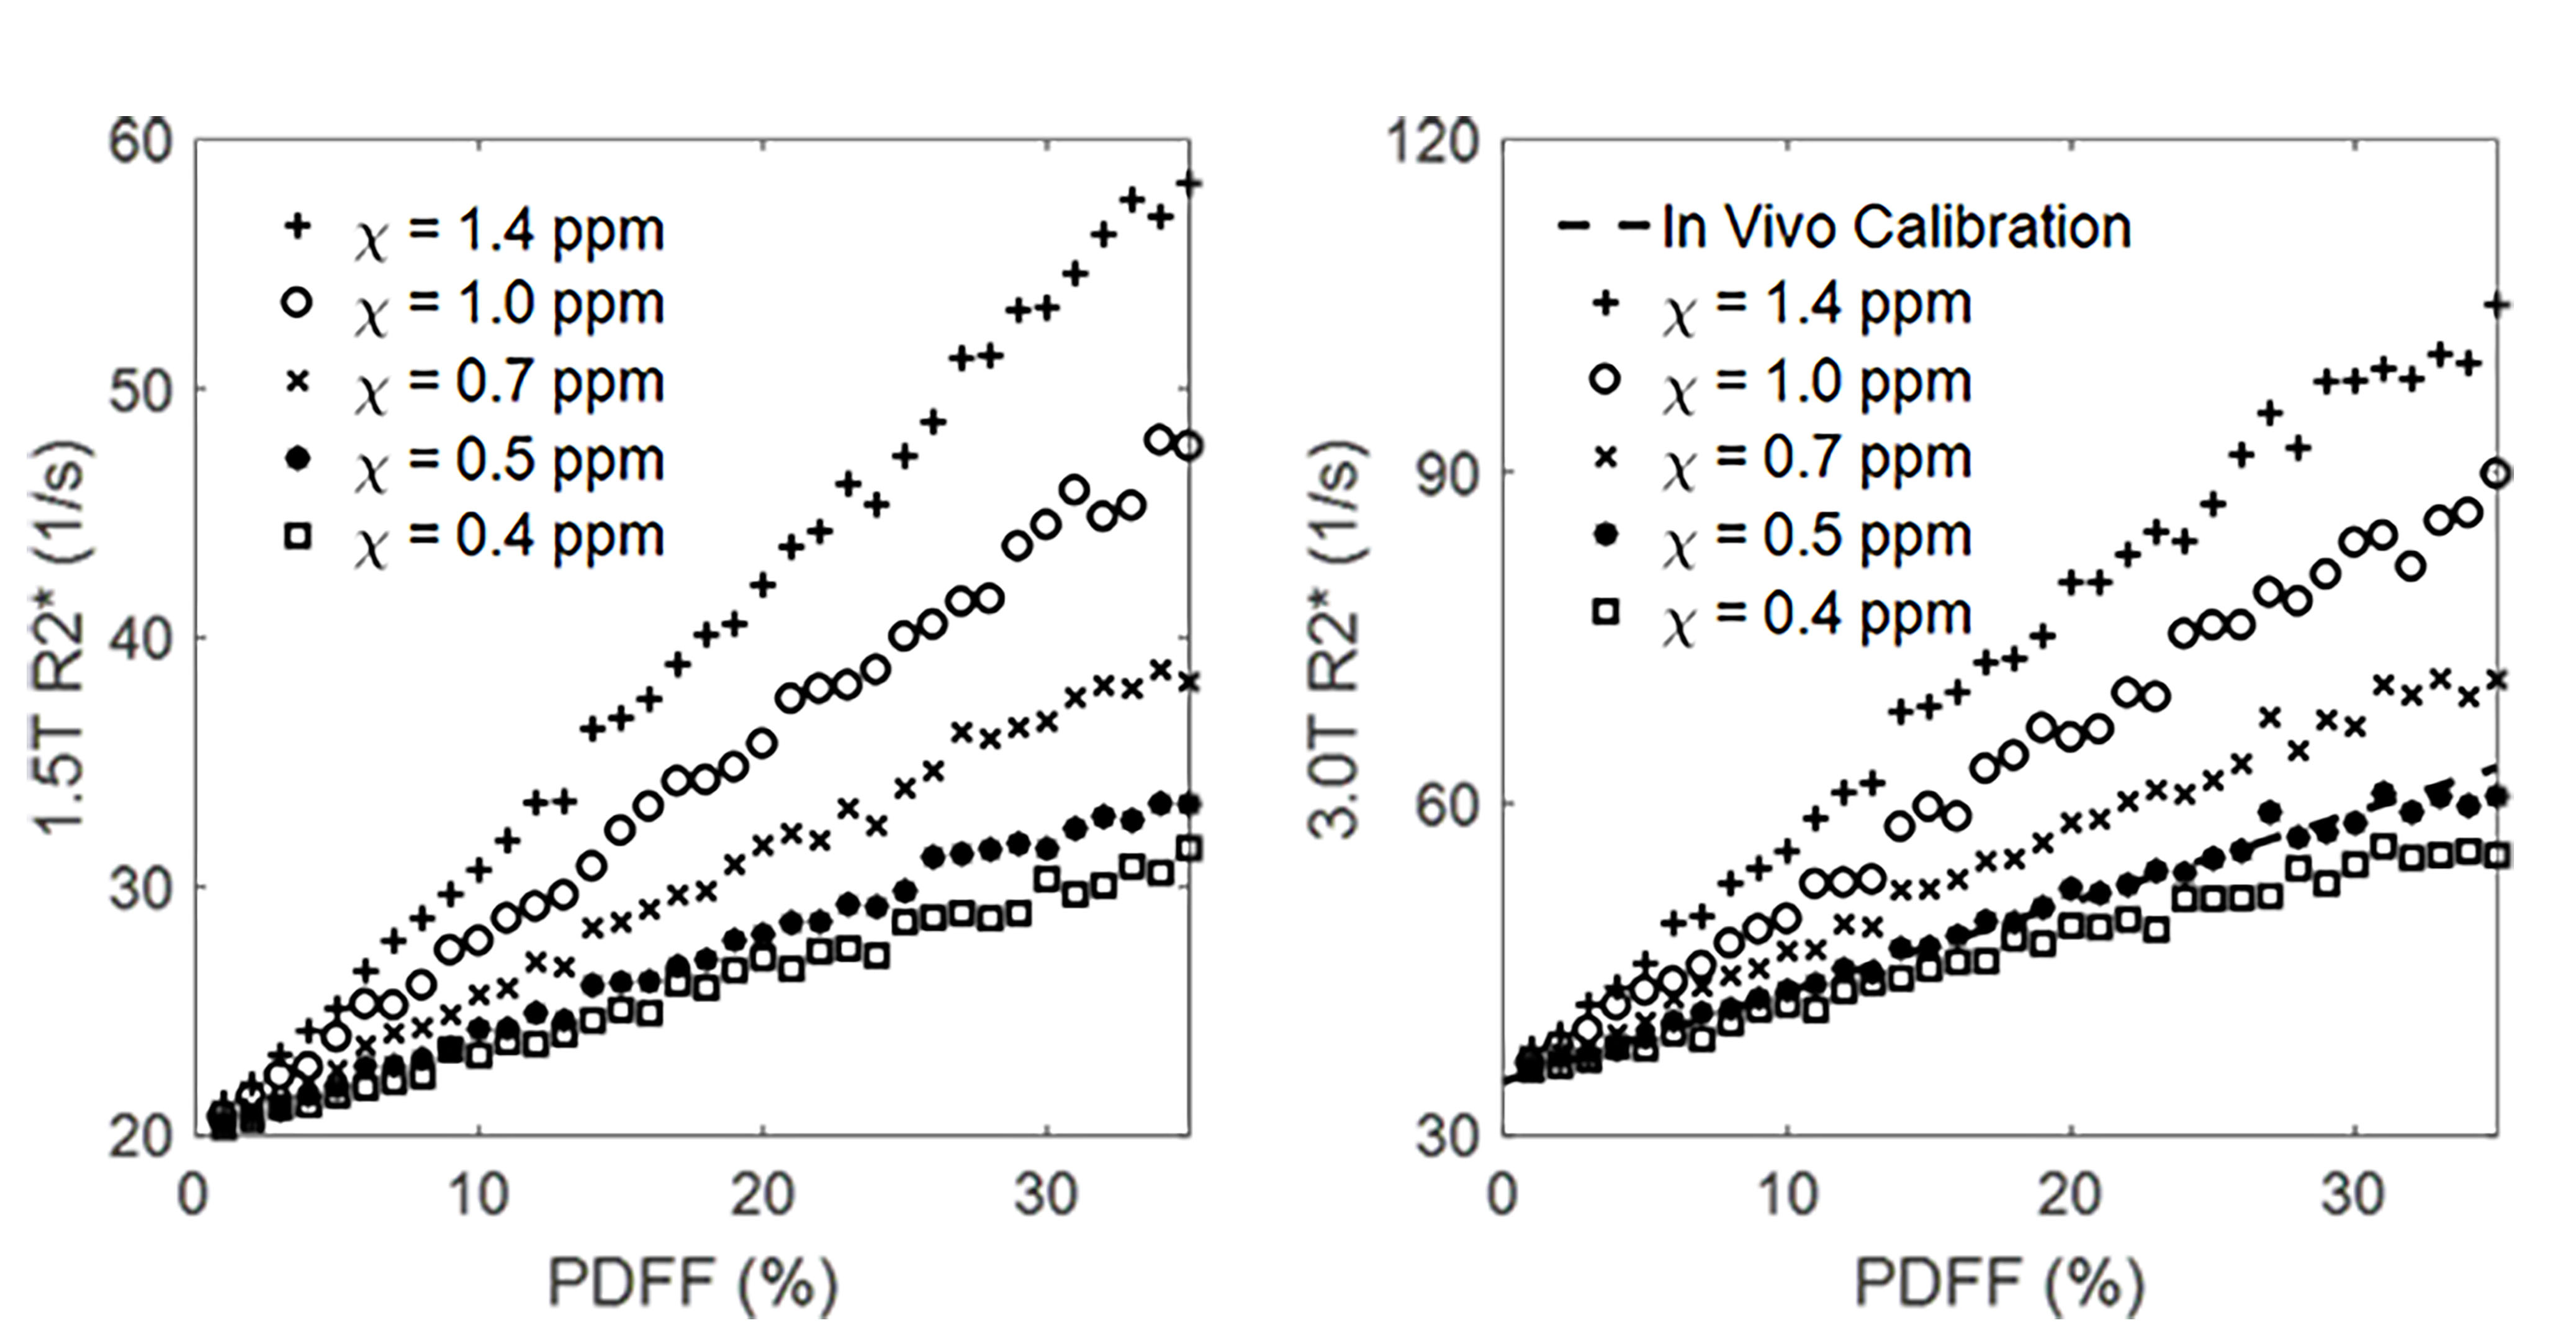
A total of 10,000 protons were randomly distributed in the volume. Protons performed a random walk over a time interval of 15ms with time step $$$\delta =0.5$$$µs; diffusion coefficients were 0.76µm2/ms for water molecules5 and 0µm2/ms for fat molecules. The phase accrual for each proton was then computed, reflecting local magnetic field inhomogeneity and the residence time in the field. Total phase accumulated at time step t was given by:$$\Phi(t)=\gamma\delta\sum_{i=1}^{t}(B_0+\Delta B(p(i)))$$where $$$\gamma$$$ is the gyromagnetic ratio (2.675×10⁸rad∙s−1∙T−1), and $$$p(i)$$$ is the proton's position at the $$$i$$$th step. The complex water signal SW and fat signal SF for a single proton were calculated as follows:$$S_W(t)=S(0)e^{-t\cdot R2_0+\Phi(t)}$$ $$S_F(t)=S(0)\left(\sum_{p=1}^{P}\alpha_pe^{i2\pi f_{F,p}t}\right)e^{-t\cdot R2_0+\Phi(t)}$$ where R20 represents baseline transverse relaxation in the liver, and was empirically assumed to be 20s−1 at 1.5T and 35s−1 at 3.0T, $$$f_{F,p}$$$ are the known frequencies for the multiple spectral peaks of the fat signal relative to the water peak, and $$$\alpha _p$$$ are the relative amplitudes of the fat signal6. Superposition of signals from all protons yielded the total synthesized signal:$$S(t)=S_W(t)+S_F(t)$$Then R2* was calculated using the validated signal model for CSE-MRI7: $$S(\rho_W,\rho_F,\phi_0,f_B,R_2^*,t)=\left(\rho_W+\rho_F\sum_{p=1}^{P}\alpha_pe^{i2\pi f_{F,p}t}\right)e^{i(\phi_0+2\pi f_Bt)}e^{-R_2^*t}$$ where $$$\rho_W$$$ and $$$\rho_F$$$ are the amplitudes of water and fat signals with initial phase $$$\phi_0$$$ , and $$$f_B$$$ is the frequency shift due to local magnetic field inhomogeneities. Note that TE$$$=[1.2,1.7,2.2,..., 11.2]$$$ms at 1.5T and TE$$$=[1.1,2.2,,3.2...,6.2]$$$ms at 3.0T. Additionally, simulations were repeated for $$$\chi$$$=0.4, 0.5, 0.7, 1.0, and 1.4ppm to assess the sensitivity of R2* to the susceptibility of fat.
Results
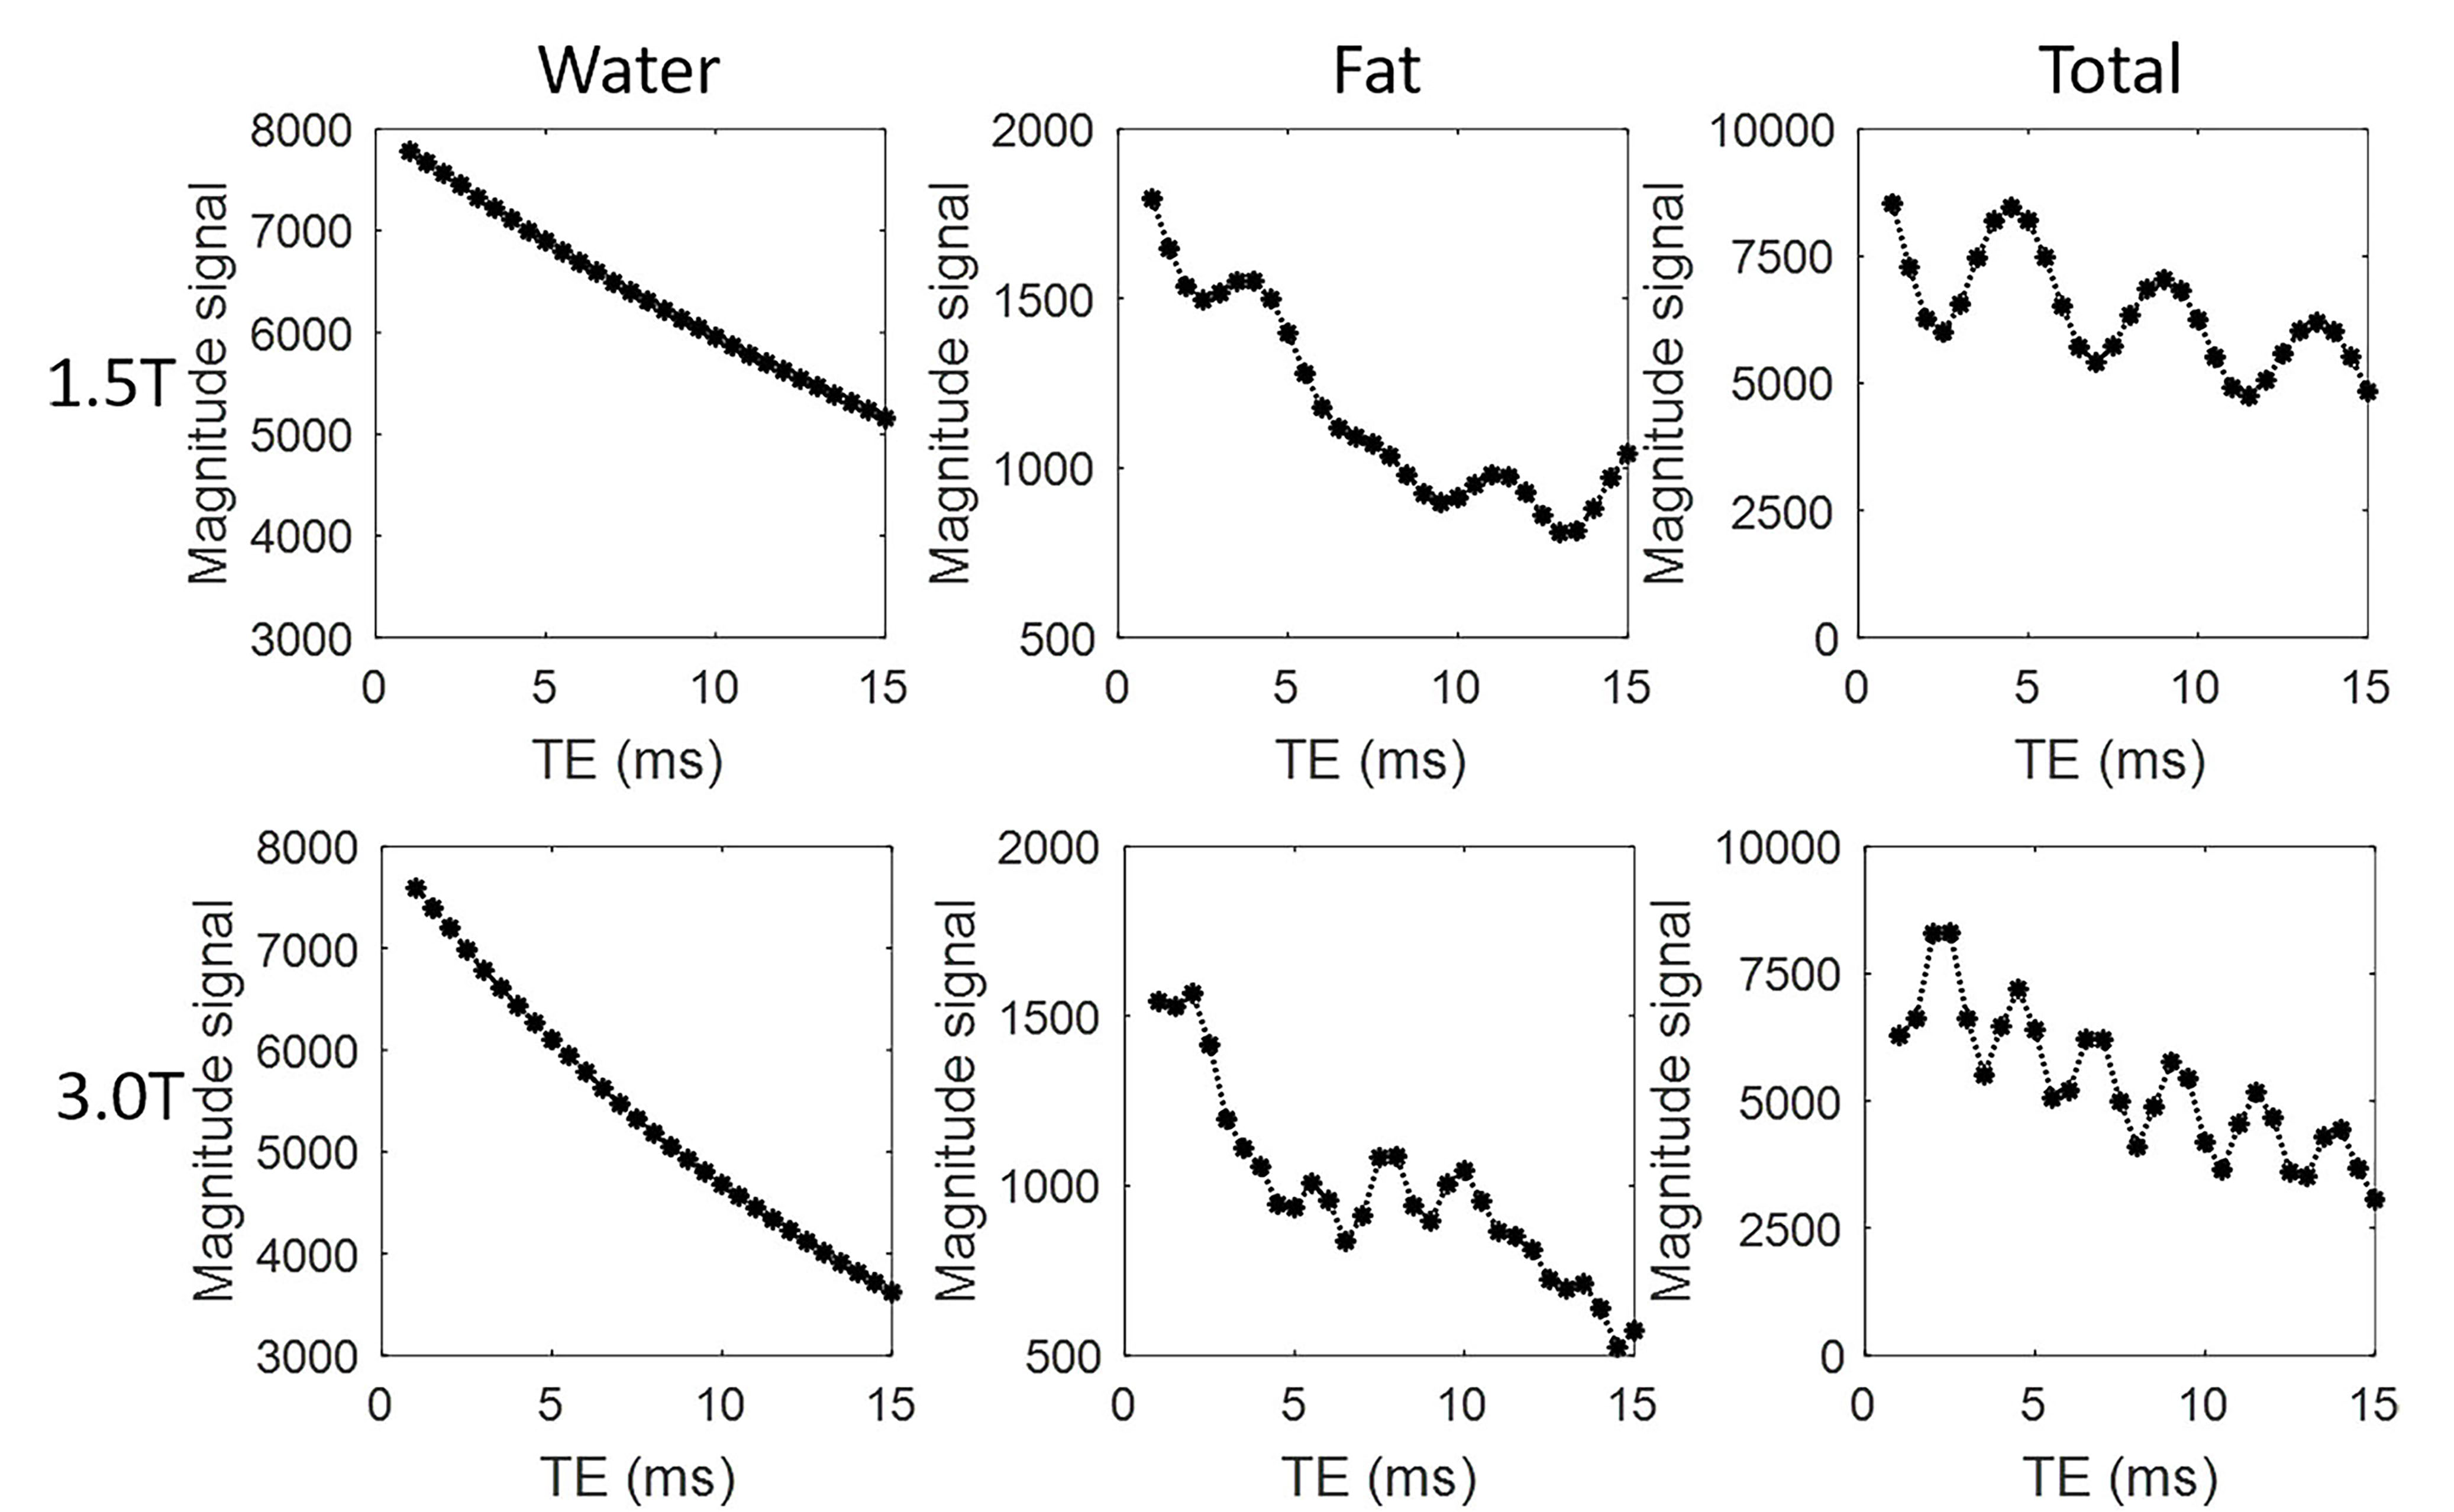
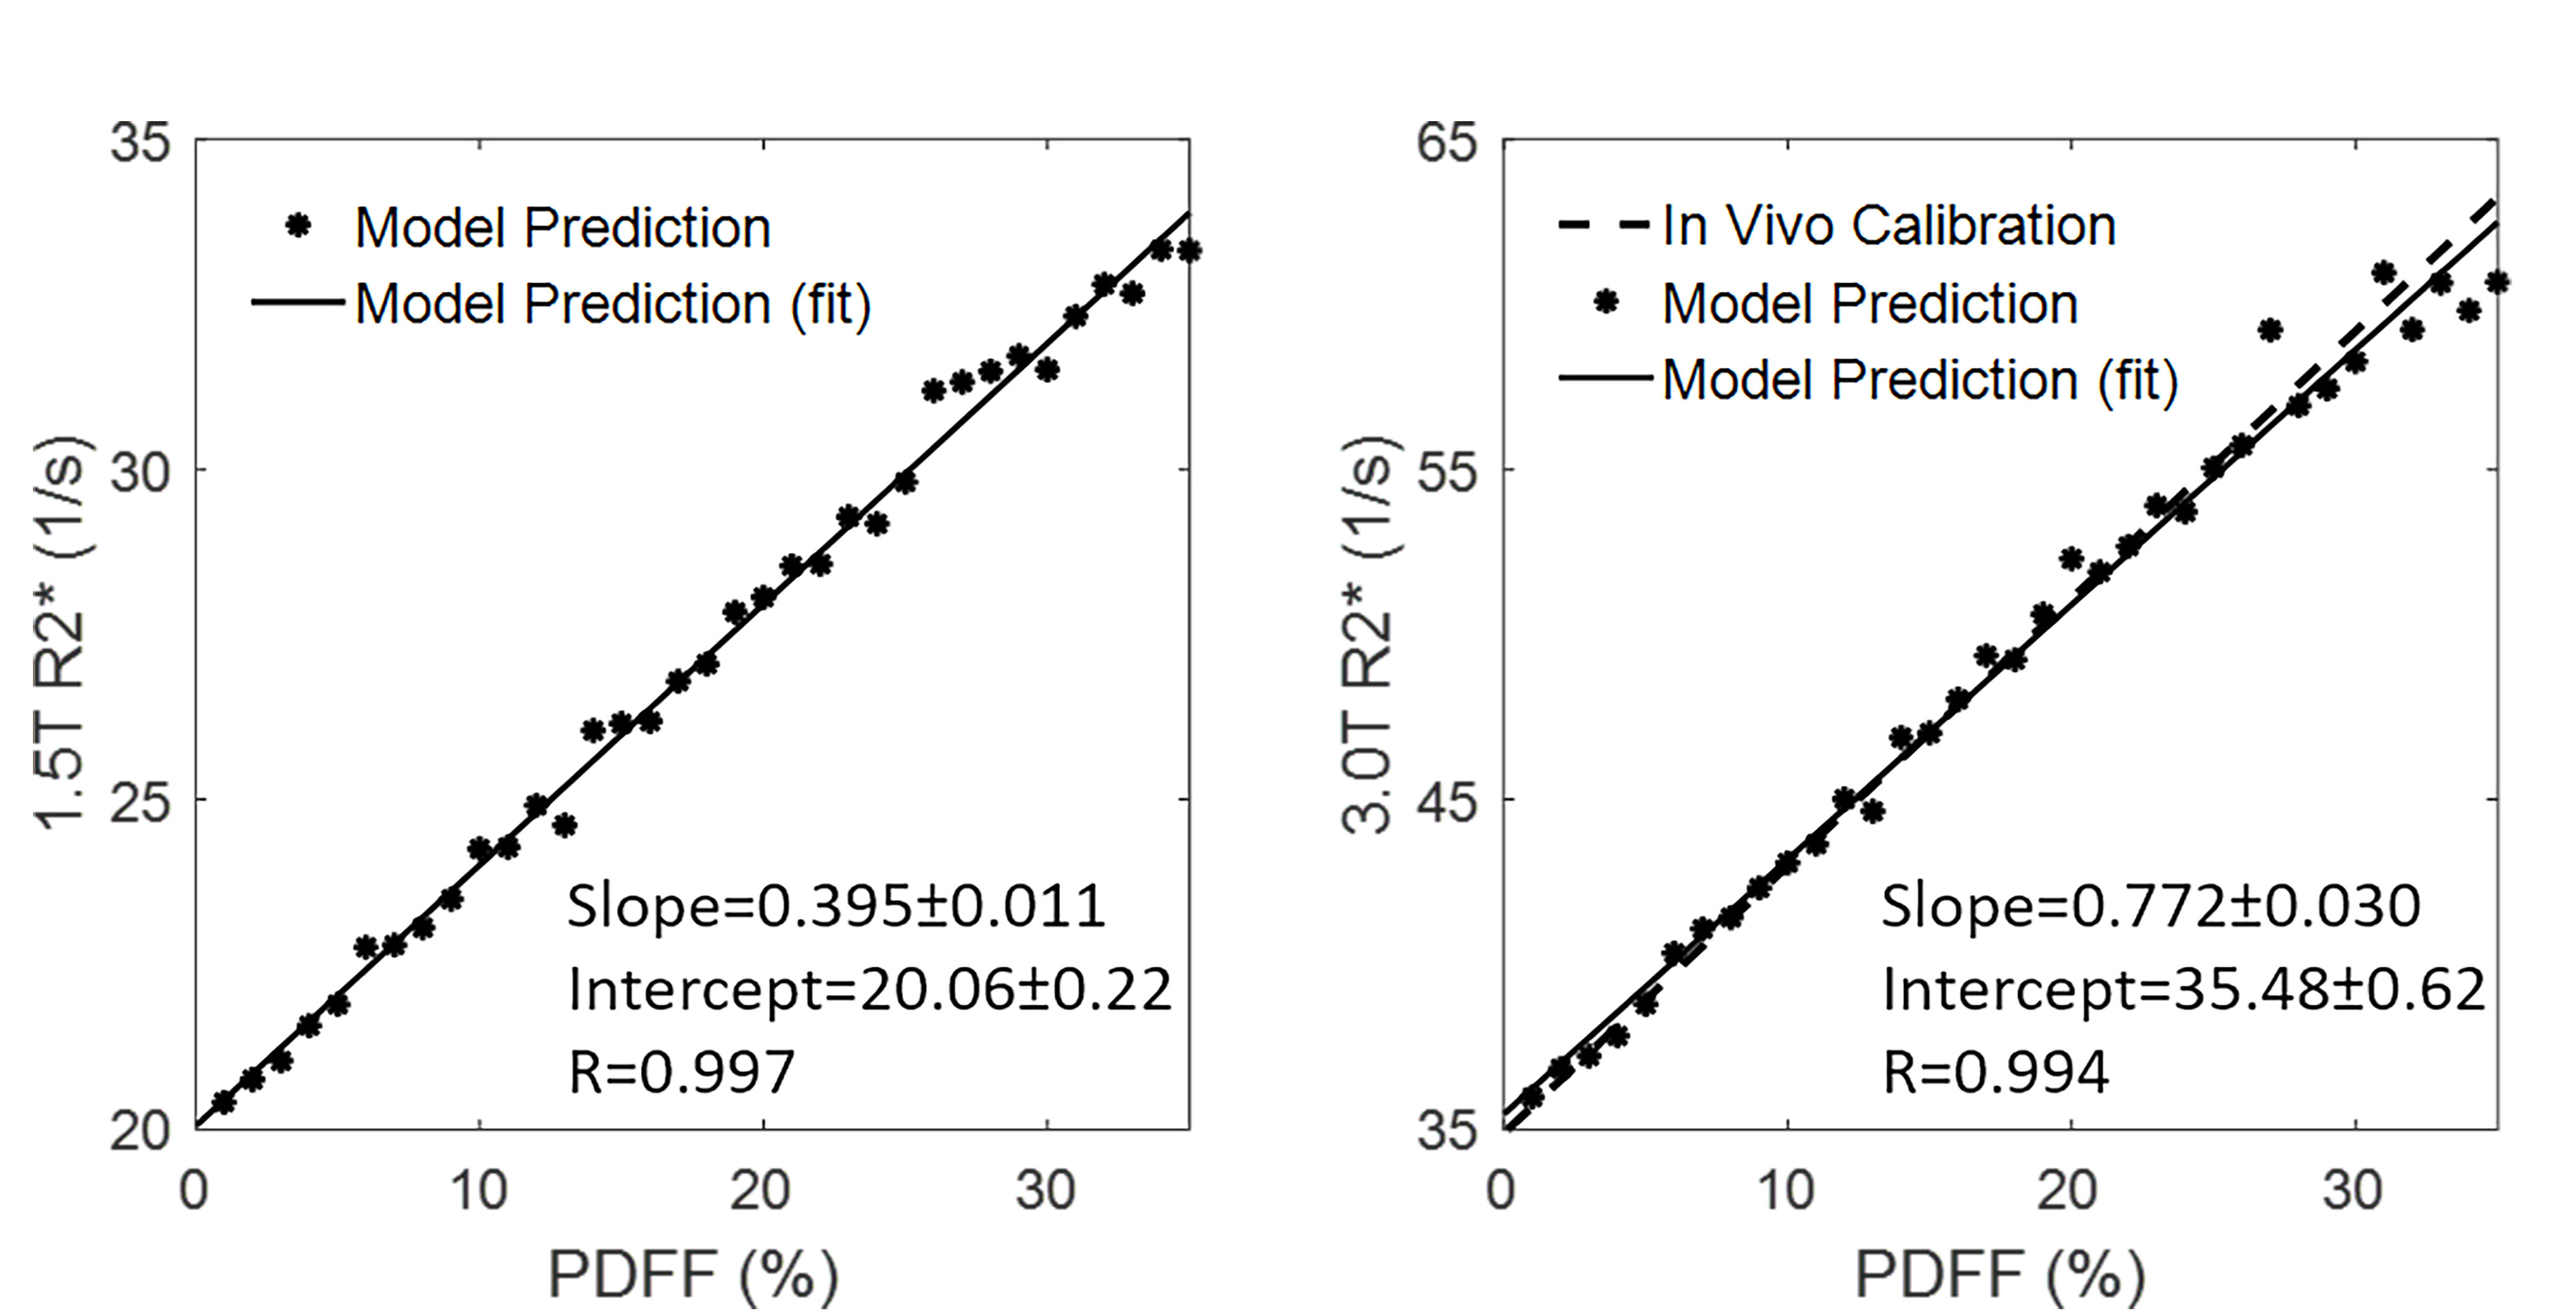
Figure 2 plots the magnitude water signals, fat signals, and total synthesized signals for a representative fat fraction of 20% at 1.5T and 3.0T. Figure 3 demonstrates the linear relationships between PDFF and R2* over a wide range of fat susceptibilities, with greater fat susceptibility $$$\chi$$$ producing a steeper PDFF-R2* relationship. As shown in Figure 4, when fat susceptibility $$$\chi=0.5$$$ppm, the PDFF-R2* relationships were shown, and result at 3.0T was very close to previously published in vivo studies3, 4.Discussion & Conclusions
In this study, we have successfully recapitulated the clinically observed correlation between PDFF and R2*, using Monte Carlo simulations with realistic physical parameters. These results are consistent with previous in vivo studies3, 4, in which the slope of R2* relative to PDFF ranges from 0.77 to 0.87 at 3.0T. Although the impact of fat on R2* is relatively small in comparison with iron overload, the best possible accuracy is important for R2*-based iron quantification, particularly in patients with mild-moderate liver iron concentration and high PDFF. This may be relevant in non-alcoholic steatohepatitis where iron has been implicated as a co-factor in the progression of inflammation and fibrosis8. This work demonstrates that Monte Carlo simulations may provide a new means to characterize the effect of fat on R2* quantification. This study has several limitations, including the simplifying assumption of a constant fat droplet size and random distribution, a single diffusion rate for water, and no consideration of the effect of echo times. Future work will apply a statistical model of fat droplet size, shape, and location, and perform simulations with different diffusion rates for water and validation with patients at 1.5T.Acknowledgements
We acknowledge the support of China Scholarship Council and the NIH (R01 DK083380, R01 DK088925, R01 DK100651 and K24 DK102595). The authors wish to acknowledge support from GE Healthcare who provides research support to UW-Madison and UCSD.References
1. Reeder SB, Sirlin CB. Quantification of liver fat with magnetic resonance imaging. Magn Reson Imaging Clin N Am 2010;18(3):337-357, ix.
2. Sirlin CB, Reeder SB. Magnetic resonance imaging quantification of liver iron. Magn Reson Imaging Clin N Am 2010;18(3):359-381, ix.
3. Hernando D, Haufe WM, Hooker CA, Schlein A, Wolfson T, Artz NS, Reeder SB, Sirlin CB. Relationship between liver proton density fat fraction and R2* in the absence of iron overload. In Proceedings of the 23st Annual Meeting of ISMRM, Toronto, Ontario, Canada, 2015. p. 4118.
4. Mamidipalli A, Hamilton G, Manning P, et al. Cross-sectional correlation between hepatic R2* and proton density fat fraction (PDFF) in children with hepatic steatosis. J Magn Reson Imaging 2017. doi: 10.1002/jmri.25748.
5. Yamada I, Aung W, Himeno Y, Nakagawa T, Shibuya H. Diffusion coefficients in abdominal organs and hepatic lesions: evaluation with intravoxel incoherent motion echo-planar MR imaging. Radiology 1999;210(3):617-623.
6. Hamilton G, Yokoo T, Bydder M, Cruite I, Schroeder ME, Sirlin CB, Middleton MS. In vivo characterization of the liver fat 1H MR spectrum. NMR Biomed 2011;24(7):784-790.
7. Hernando D, Kramer JH, Reeder SB. Multipeak fat-corrected complex R2* relaxometry: theory, optimization, and clinical validation. Magn Reson Med 2013;70(5):1319-1331.
8. George DK, Goldwurm S, Macdonald GA, Cowley LL, Walker NI, Ward PJ, Jazwinska EC, Powell LW. Increased hepatic iron concentration in nonalcoholic steatohepatitis is associated with increased fibrosis. Gastroenterology 1998;114(2):311-318.
Figures