2263
MR Elastography of Kidneys Using SE-EPI: A Reproducibility Study and Comparison to ADC and FA Measurements1Biomedical Engineering, Ohio State University, Columbus, OH, United States, 2Radiology, Ohio State University Wexner Medical Center, Columbus, OH, United States
Synopsis
Stiffness change has been associated with progress of disease. Magnetic resonance elastography(MRE) is an imaging-based alternative that can measure stiffness. Diffusion Tensor Imaging(DTI) provides apparent diffusion coefficient(ADC) and fractional anisotropy(FA) of the tissue. Previous studies have investigated stiffness and diffusion in kidneys individually. However, none of the studies have investigated the two together. Aim of this study is to show reproducibility of spin-echo echo-planar imaging(SE-EPI) MRE and correlate it with ADC and FA measurements obtained from DTI. Preliminary results showed good reproducibility in stiffness measurements and moderate correlation between MRE stiffness and ADC and FA values from DTI.
Introduction
There are a wide variety of kidney diseases, many of which are life threatening and could result in death. The current non-invasive methods used for diagnosing kidney diseases such as Ultrasound, CT and MRI are based on observing structural changes in kidneys which occurs after the disease has progressed. Magnetic Resonance Elastography(MRE) is an imaging-based alternative to palpation[1] which can show the change in stiffness when the disease is still progressing. Diffusion Tensor Imaging(DTI) provides information about diffusion of water molecules, which is useful in diagnosing different diseases based on diffusion coefficient and anisotropy of the tissue. It also provides us information about the tissue anisotropy by the Fractional Anisotropy value. The kidney function changes during pathological states and this is reflected by changes in the apparent diffusion co-efficient(ADC) and fractional anisotropy (FA) values[2]. The aim of this study is to show the reproducibility of SE-EPI MRE and also to correlate the stiffness obtained from SE-EPI MRE to ADC, FA values obtained from DTI as none of the previous studies have investigated it.Methods
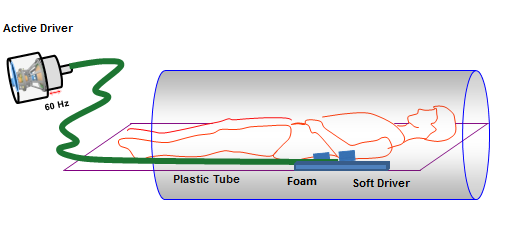
All imaging was performed using a 3T MRI scanner (Tim Trio, Siemens Healthcare). Written informed consent was obtained from all healthy volunteers (n=4, age range:22-29 years). Coronal slices were obtained using SE-EPI MRE pulse sequences. Volunteers were laid supine with head first in the MR scanner as shown in figure 1. 60 Hz external vibrations were introduced through a soft driver with one pad for each kidney [3]. The driver pads were placed on the posterior side between the sternum and the umbilicus. For reproducibility study after the first scan the volunteers were asked to leave the scan room and repositioned for a repeat scan with the same imaging parameters Imaging parameters for SE-EPI MRE included:FOV=500x500mm2, TR=750ms, TE=40.7ms, EPI-factor=63 matrix size=128x128 reconstructed to 256x256, slice thickness=6mm, number of slices=5, MRE phase offsets=4. All slices were acquired in a 18 sec breath hold. Motion encoding gradient of 60Hz was applied separately in the x, y and z directions to encode in-plane and through plane displacement fields for SE-EPI MRE. MRE images were masked to obtain the kidney region and a 4th order Butterworth bandpass directional filter(10-40 waves/FOV) was applied to remove longitudinal component of motion and reflected waves. Finally, 3D local frequency estimation(LFE) was performed to obtain weighted stiffness map using MRE-Lab(Mayo Clinic, Rochester, MN). Imaging parameters for DTI included:FOV=500x500mm2, TR=1000 ms, TE=67ms, slice thickness=6mm, number of averages=1, b-value=50,400 and 1000s/mm2, matrix size=128x128 reconstructed to 256x256, number of slice=5 and diffusion directions=6. All slices were acquired in a 21 sec breath hold. The ADC and FA maps obtained from the scanner were then used to draw ROI on both kidneys individually to get ADC and FA values for cortex and medulla for all 4 healthy volunteers.Results
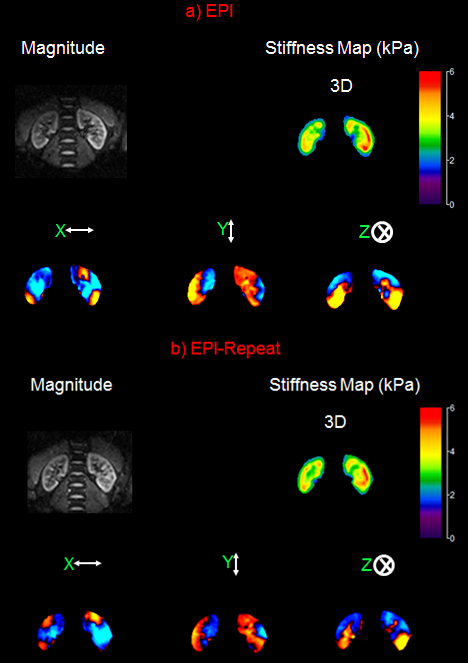
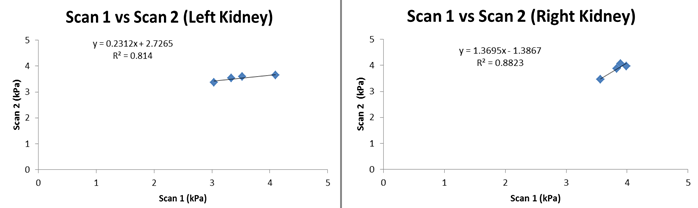
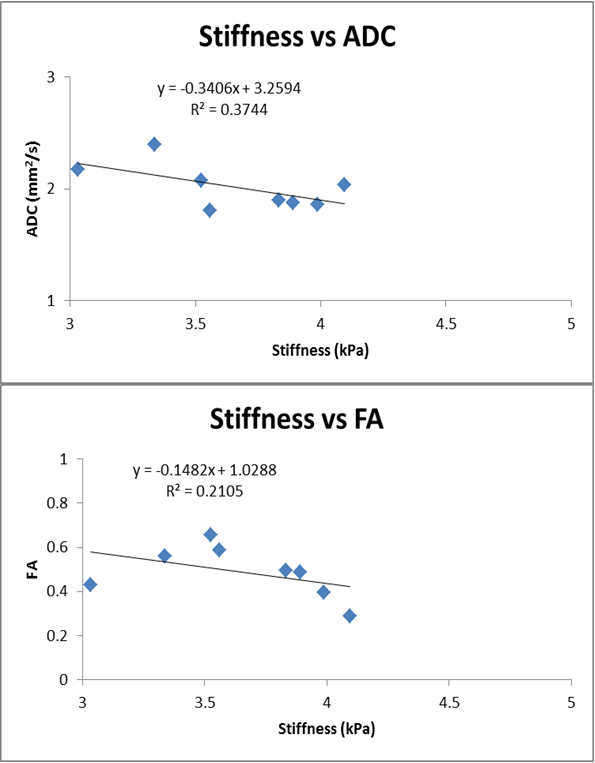
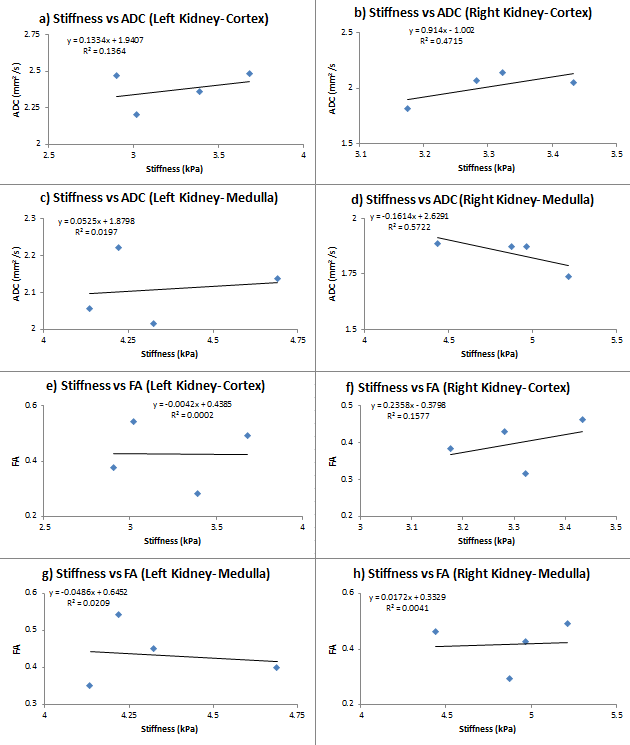
Figure 2 displays the magnitude image in one of the volunteers, and snapshot of one of the time points of wave propagation in three spatial directions x, y and z and the corresponding 3D weighted stiffness map for initial and the repeat scan respectively. Mean stiffness of kidneys across all 4 healthy volunteers was found to be 3.497±0.66 kPa for left kidney and 3.817±0.71 kPa for the right kidney for initial scan and 3.535±0.71 kPa for left kidney and 3.841 ± 0.77 kPa for the right kidney for the repeat scan. Figure 3 shows the correlation between SE-EPI MRE scan 1 and scan 2 for left and right kidneys. The mean ADC value was observed to be 2.17±0.26x10⁻³ mm2/s for left kidney and 1.857±0.15x10⁻³ mm2/s for right kidney. Similarly, mean FA value was observed to be 0.482±0.13 for left kidney and 0.49±0.12 for right kidney. These values fall within the range of values reported earlier [4] .Figure 4 shows the correlation between stiffness observed using SE-EPI MRE sequence and ADC value as well as SE-EPI MRE sequence and FA value obtained from the DTI scan. Figure 5 shows correlation of stiffness with ADC and FA values of cortex and medulla for both kidneys.Discussion and Conclusion
Preliminary results demonstrated good correlation between the stiffness values obtained using the initial and repeat scan for left kidney(R2=0.81) and right kidney(R2=0.88). A moderate correlation was found between kidney stiffness and ADC values (R2=0.37) as well as between kidney stiffness and FA values(R2=0.21) shown in Figure 4. We expect the correlation between stiffness and ADC as well as stiffness and FA to be improved with increase in sample size.
Acknowledgements
NIH-NHLBI: R01HL124096References
[1] Mariappan et al. Clin Anat. 2010 Jul; 23(5): 497–511.
[2] Takahashi et. al. Curr Opin Nephrol Hypertens. 2015 May ; 24(3): 217–223.
[3] Gavin Low et al. J Magn Reson Imaging. 2015 Sep; 42(3): 844–850.
[4] Aki Kido et. al Diffusion tensor MRI of the kidney at 3.0 and 1.5 Tesla, Acta Radiologica, 51:9, 1059-1063
Figures