2259
Lipid nanocapsules for tissue oxygenation determination using MRI1Micro et Nanomedecines translationnelles, MINT, Université d'Angers, Angers, France, 2Biomedical Magnetic Resonance Unit (REMA), Université catholique de Louvain, Woluwe-Saint-Lambert, Belgium, 3PRISM, Université d'Angers, Angers, France
Synopsis
To determine tissue pO2, lipid nanocapsules (LNCs) were used in conjunction with the rapid mapping of changes in tissue oxygenation, based on the higher solubility of O2 in lipids than in water, (MOBILE) MR sequence. LNCs were injected into the femoral muscle (n = 5) of C3H mice and T1 relaxation was measured whilst the animal was breathing air or carbogen (95 % O2, 5 % CO2) gas . In all explored mice a shortening in T1 relaxation was observed following the carbogen challenge, and T1 relaxation maps were produced indicating a response of the LNCs to the tissue O2 environment.
Introduction.
The chemical and physical properties of O2 facilitate a wide variety of methods for monitoring partial pressure of O2 (pO2), and include magnetic resonance (MR) based techniques. Changes in tissue O2 concentrations produce changes in the relaxation rate R1 (= 1/T1) of water thus T1 demonstrates a sensitivity to dissolved O2 (which acts as a T1-shortening paramagnetic probe). An O2-induced increase in R1 has the potential to provide measurements in fluctuations in the O2 level of tissue. Jordan et al 1 describes an MR method allowing for the rapid mapping of changes in tissue oxygenation based on the higher solubility of O2 in lipids than in water (MOBILE). Lipid nanocapsules (LNCs) are core-shell based nanoparticles wherein an oil-filled core, capable of encapsulating hydrophobic drugs, is surrounded by a polyethylene glycol (PEG) layer, and used in therapeutic cancer treatments 2. In this study, we used the MOBILE MR sequence to determine tissue hypoxia using lipids in the form of LNCs.Methods.
LNCs were synthesized via the phase-inversion temperature method 3 and osmotically adjusted for in vivo use. Size and polydispersity (PDI) were determined by dynamic light scattering analysis. MR imaging was performed using a 7T scanner (Biospec 70/20 Avance III, Bruker Wissembourg, France) equipped with BGA12S gradient system (675mT/m). Prior to in vivo experimentation, the ability of the LNCs to respond to change in pO2 was assessed in vitro using distinct samples with differing O2 levels, namely 0 % (100 % argon), 21 %, and 100 % (corresponding to 0, 0.2, and 1 atm, respectively), and differing temperatures, from which lipid T1 was measured using the MOBILE MR sequence 1. For in vivo validation, LNCs were injected into the right hind femoral muscle (n = 5) of C3H mice and T1 relaxation rates were measured whilst the animal was breathing air or undergoing a carbogen gas (95 % O2, 5 % CO2) challenge to induce a change in muscle pO2. T1 relaxation was determined by drawing a ROI around the lipid hypersignal and analyzing the T1 relaxation rates' pixel-by-pixel using a home-made program written in MatLab (The MathWorks, Inc., Natick, MA) to discern a T1 mean value and map of the muscle pO2.Results.
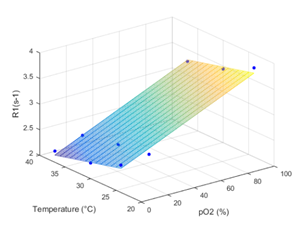
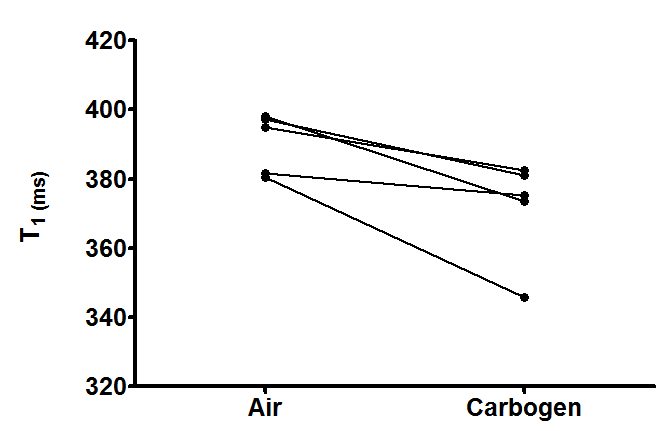
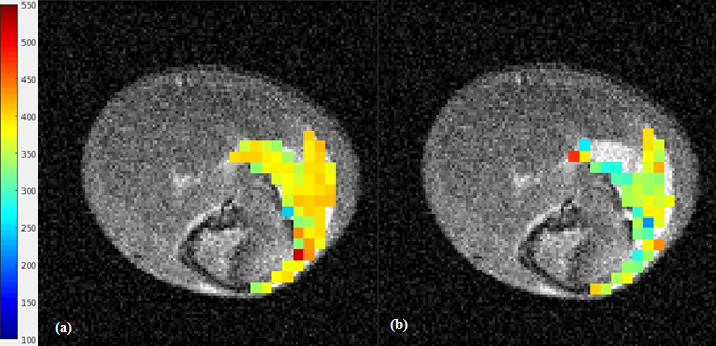
LNCs were synthesized with an average hydrodynamic size of 53.9 nm ±0.7 (PDI 0.04 ±0.01). For in vitro validation T1 values of 306 ms, 420 ms and 450 ms were measured after bubbling in 100% O2, air or argon, respectively at 37 °C. The pO2 calibration curve was calculated from the values using the equation: R1 = 3.0952 + 0.0115 * PO2 - 0.0258 * T (°C) (Fig. 1). For in vivo validation, the osmotically adjusted LNC preparation was injected into femoral mouse muscle. In all explored animals a decrease in T1 was observed following the carbogen challenge (mean T1 Air = 390 ±4 ms and mean T1 Carbogen = 372 ±7 ms, p = 0.04) (Fig. 2), and T1 maps demonstrating the T1 values of air and carbogen breathing were composed (Fig. 3).Conclusion.
Preliminary results indicate that tissue pO2 can be mapped using the MOBILE MR sequence after a single introduction of LNCs. The lipid T1 map was sensitive to variations in oxygenation induced by a carbogen challenge.Acknowledgements
The authors would like to thank the NanoFar Erasmus Mundus program and the ‘Comité Inter-Regional Grand Ouest de La Ligue Contre le Cancer’ (CIRGO) for providing funding for this project.References
1. Jordan BF, et al. 2013. Mapping of oxygen by imaging lipids relaxation enhancement: a potential sensitive endogenous MRI contrast to map variations in tissue oxygenation. Magn Reson Med. 70, 732-744.
2. Huynh, et al. 2012. Administration-dependent efficacy of ferrociphenol lipid nanocapsules for the treatment of intracranial 9L rat gliosarcoma. Int J Pharma. 423, 55-62.
3. Heurtault B, et al. 2002. A novel phase inversion-based process for the preparation of lipid nanocarriers. Pharm Res. 19, 875-880.
Figures