2257
Robust chemical exchange spin-lock (CESL) using adiabatic pulses1Imaging and Interventional Radiology, The Chinese University of Hong Kong, Shatin, Hong Kong, 2Medical physics and research department, Hong Kong, Hong Kong, 3Philips Healthcare, Hong Kong, Hong Kong
Synopsis
Chemical exchange spin-lock (CESL) is a recently reported technology for probing metabolites which have intermediate to fast chemical exchange with bulk water. However, the conventional CESL is susceptible to B1 radiofrequency (RF) and B0 field inhomogeneity. The presence of these system imperfections leads to signal distortions and errors in contrast map. In this work, we report an approach to address this problem. We used simulation and in vivo experiments to demonstrate our proposed method.
Introduction
Chemical exchange saturation transfer (CEST) has been applied to study the endogenous hydroxyl-water exchange from glycosaminoglycan (GAG).1,2 Under 3.0T field strength, this exchange process falls into the intermediate to fast exchange regime. It was reported that chemical exchange spin-lock (CESL) may be more sensitive to probe intermediate to fast chemical exchange process compared to CEST;3,4 therefore, it may have advantages for probing GAG at 3.0T field strength. CESL is performed with spin-lock RF pulses at a range of resonance frequency offsets. During the spin-lock process, the spins are locked along the effective spin-lock field; however, spin-lock will fail with the influence of B1 RF and B0 field inhomogeneity, introducing a considerable amount of error to further analysis. In this work, we present a method to improve the robustness of CESL. Simulations and in vivo data were used to demonstrate the performance of our proposed method.Methods
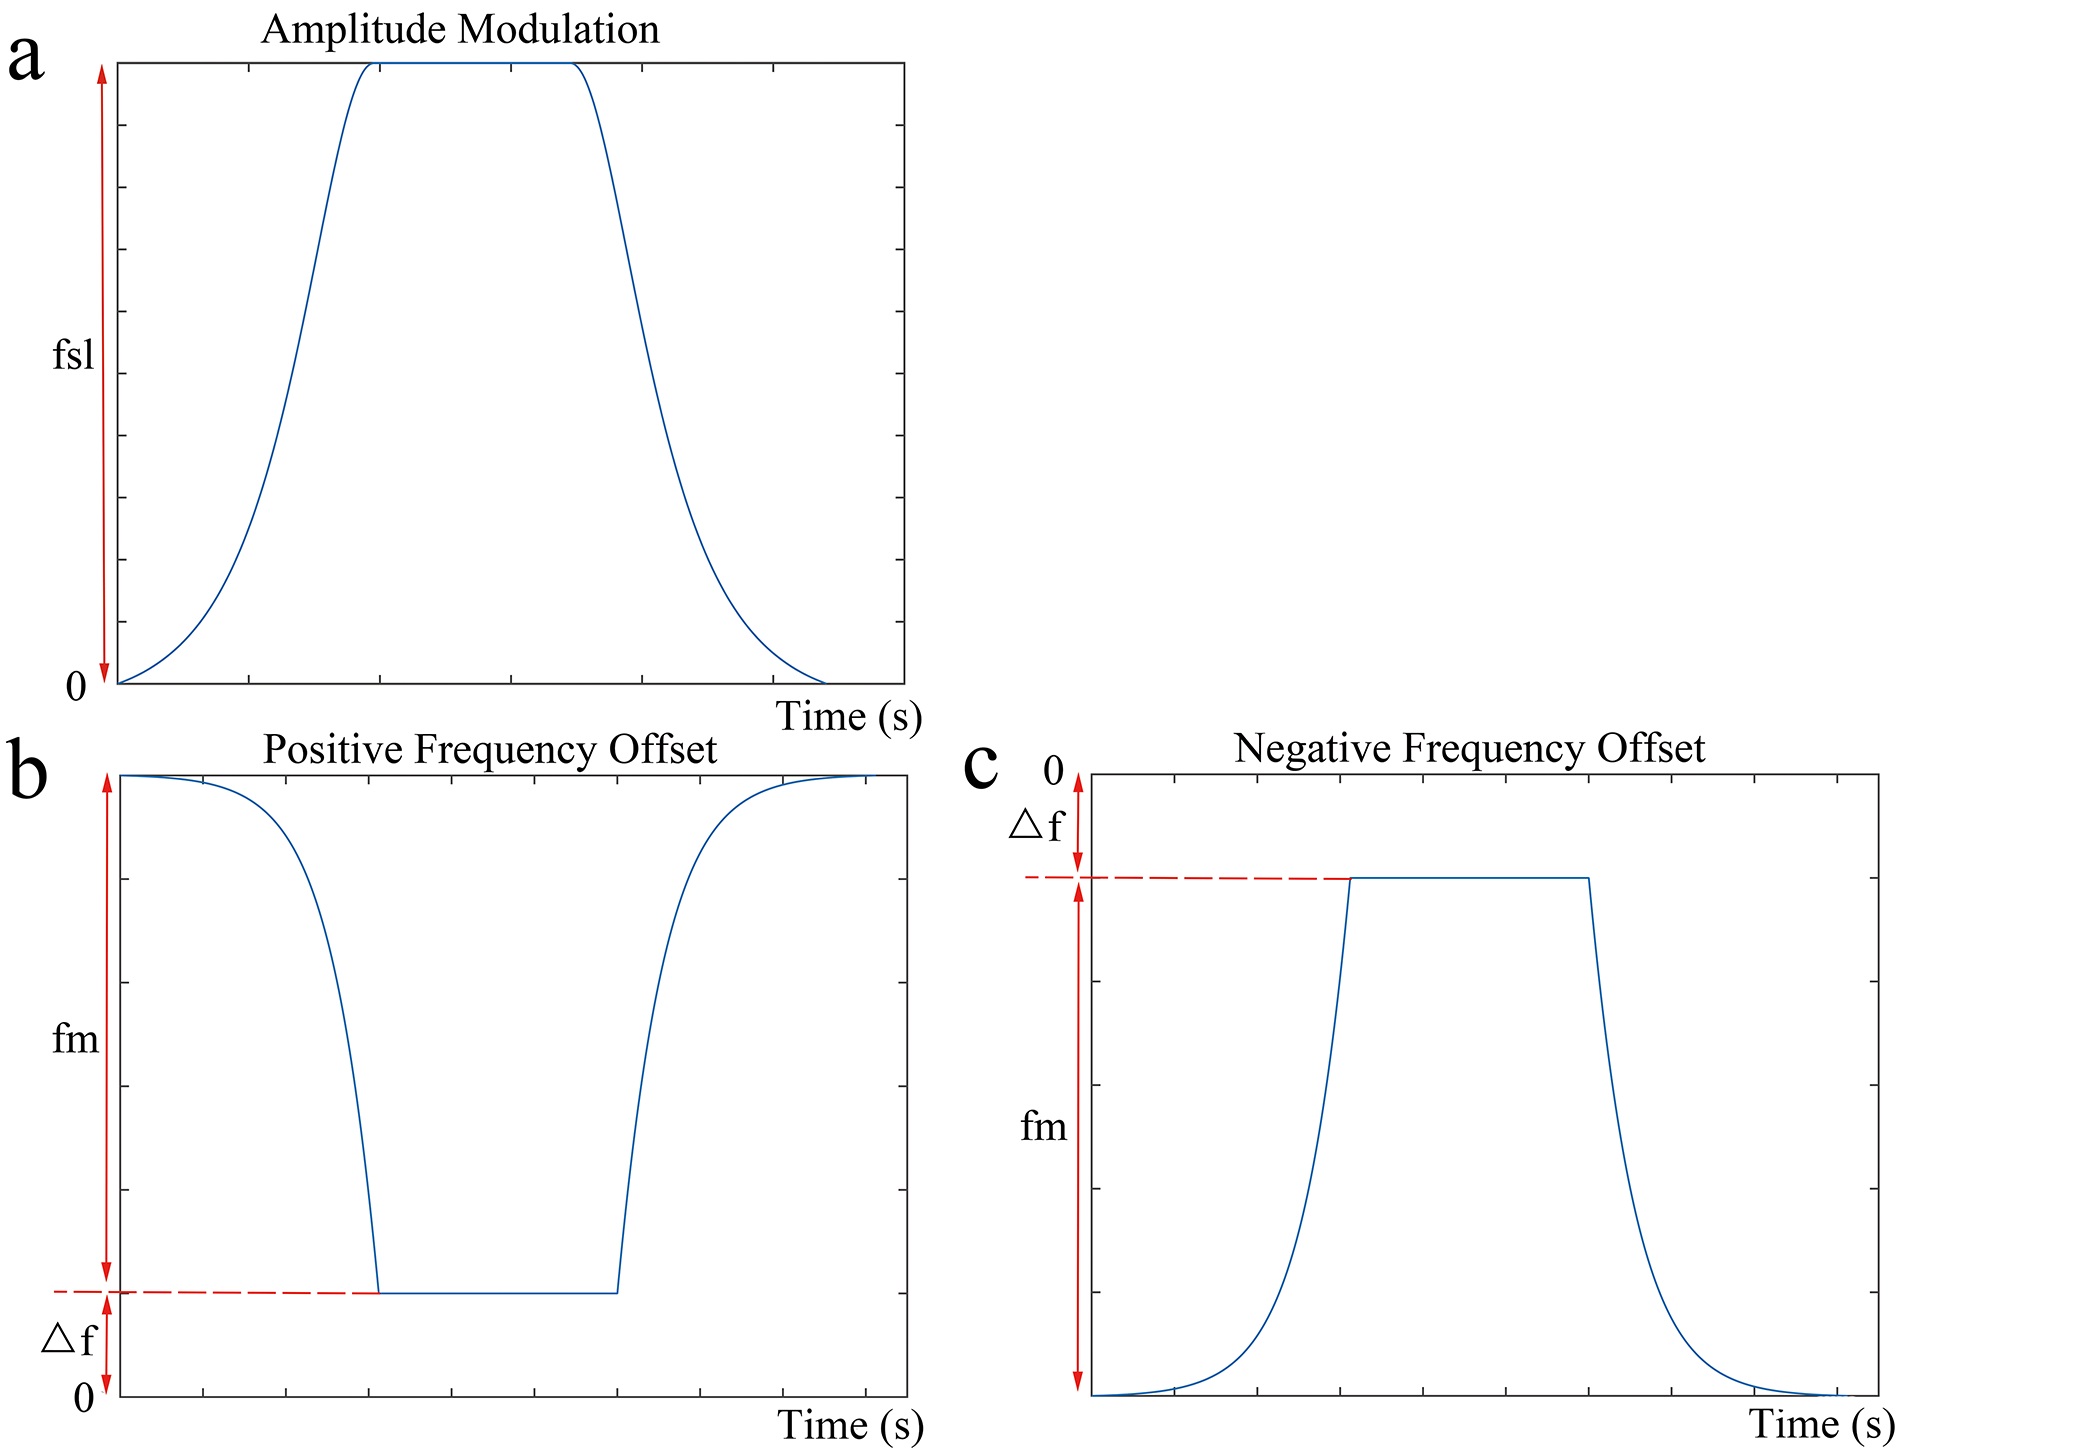
The proposed RF pulse cluster for CESL is shown in Figure 1. We placed adiabatic half passage (AHP) and reverse AHP pulses at the two sides of a constant amplitude spin-lock. It can be shown that if the following condition is satisfied:$$\omega_{1,max}=\omega_{sl}, [1]$$where $$$\omega_{1,max}$$$ is the maximum B1 amplitude of the AHP and the reverse AHP pulse, and $$$\omega_{sl}$$$ is the frequency of spin-lock (FSL), the spins will be effectively locked by the effective spin-lock field at the following orientation: $$\theta(r)=\begin{cases}\arctan(\frac{\tilde{\omega}_{sl}\left(r\right)}{\triangle\omega_{c}+\triangle\omega_{0}(r)})+\pi, & if\quad \triangle\omega_{c}>0\quad and\quad\triangle\omega_{c}+\triangle\omega_{0}(r)\leq0 \\\arctan(\frac{\tilde{\omega}_{sl}\left(r\right)}{\triangle\omega_{c}+\triangle\omega_{0}(r)})-\pi, & if\quad \triangle\omega_{c}<0\quad and\quad\triangle\omega_{c}+\triangle\omega_{0}(r)\geq0\\\arctan(\frac{\tilde{\omega}_{sl}\left(r\right)}{\triangle\omega_{c}+\triangle\omega_{0}(r)}), &otherwise\end{cases}, [2]$$where $$$\triangle\omega_{c}$$$ is the resonance frequency offset (FO), $$$\triangle\omega_{0}(r)$$$ is the B0 field inhomogeneity, and $$$\tilde{\omega}_{sl}$$$ is the actual spin-lock B1 amplitude, which is the expected spin-lock amplitude under the influence of B1 RF inhomogeneity. We measured R1rho at different resonance frequency offsets with the following relaxation model5-7:$${M}_{e}(TSL)=A\cdot{e}^{-R_{1rho}\cdot{TSL}}+B, [3]$$where $$${M}_{e}(TSL)$$$ is the longitudinal magnetization at the end of the reverse AHP at different time of spin-lock (TSL), and A and B are terms independent of TSL. R1rho can be understood as superposition of three terms, including the water relaxation, relaxation due to the magnetization transfer effect (MT), and relaxation due to the chemical exchange effect.8 Assuming symmetrical MT effect with respect to the reference water point accross a range of FO, performing R1rho asymmetry analysis, i.e. R1rhoasym=R1rho(-FO)-R1rho(+FO) can theoretically removes water relaxation and MT effects, leaving only the chemical exchange term that is specific to the metabolite of interest.
We performed CEST, conventional CESL and our proposed method (adiCESL) using simulation and in vivo experiments. Simulations were performed using cartilage parameters, firstly without and then with 90% B1 and 50Hz B0 field inhomogeneity. In vivo knee data sets were acquired from a Philips Achieva TX 3.0T system using an eight channel T/R knee coil (Invivo Corp, Gainesville, USA). 2D Fast Spin Echo was used for imaging data acquisition. CEST, CESL and adiCESL were performed at resonance frequency offset same as the simulations. The CEST pulse waveform consists of 4 repeated 200ms constant amplitude B1 RF pulses. The acquisition parameters include: resolution 1mm x 1mm, slice thickness 5mm, TR/TE 2000/16ms, B1 of CEST 85Hz, CESL FSL 200Hz, and adiCESL FSL 300Hz. The region of interest (ROI) was drawn on patella cartilage and muscle. For both simulation and in vivo experiments, an order of 12 polynomial fitting was used to fit the z-spectrum or R1rho-spectrum to perform asymmetry analysis. For CEST, the lowest signal intensity of the interpolated fitted curve at each pixel was used to calculate B0 field inhomogeneity and the Z-spectrum was shifted along the frequency offset axis correspondingly to correct the field inhomogeneity effect.
Results and Discussion
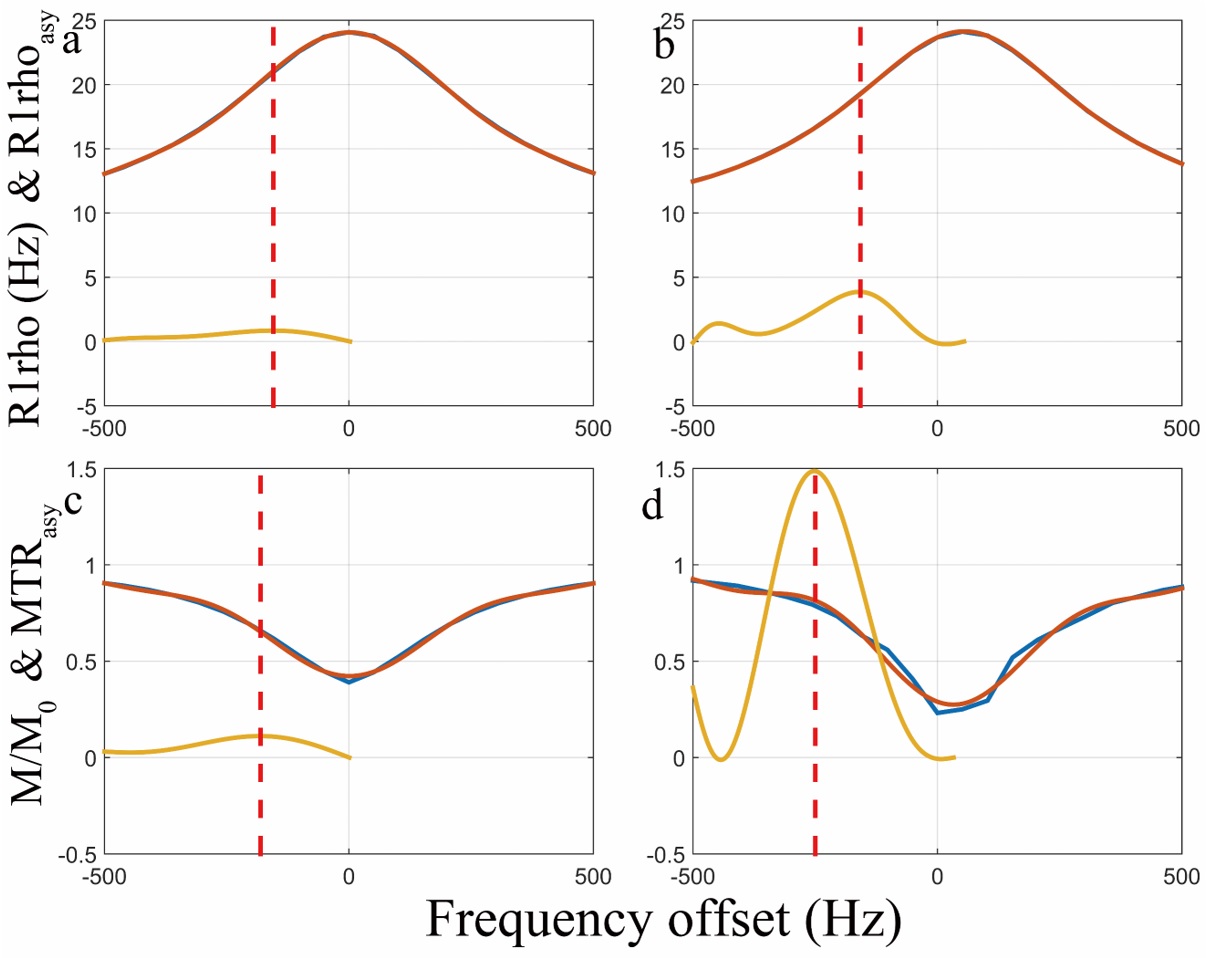
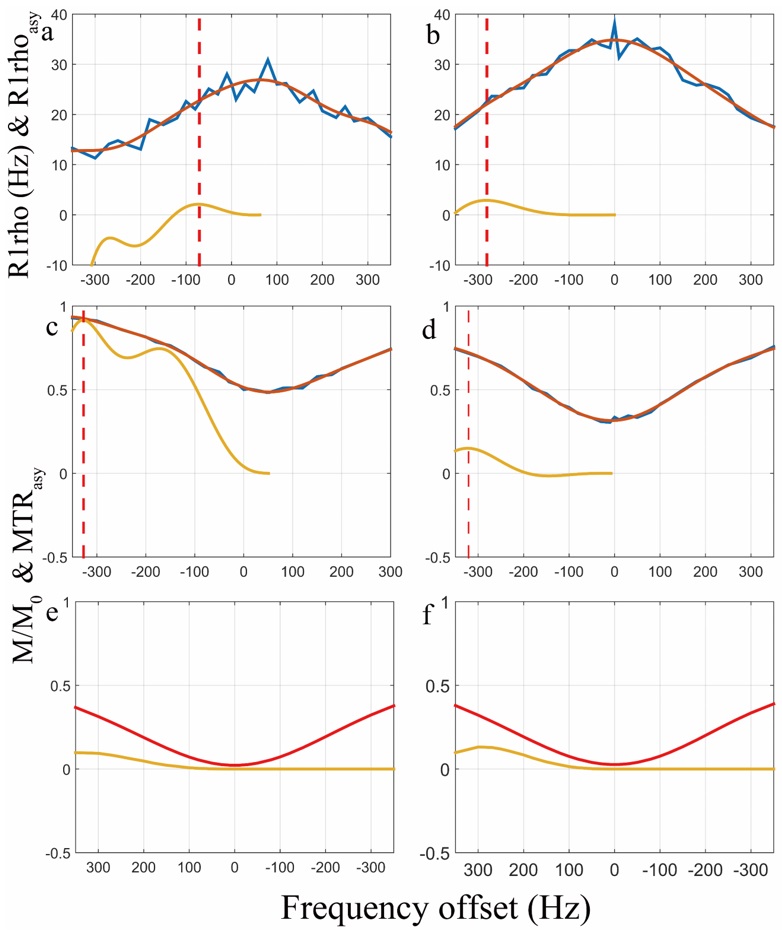
Figure 2 shows the simulation results. CESL and adiCESL both detect chemical exchange signal at the corresponding chemical shift without B1 RF and B0 field inhomogeneity. At the presence of B1 RF and B0 field inhomogeneity, CESL signal is distorted with oscillations, but adiCESL is still able to detect the signal at the corresponding chemical shift. Figure 3 shows the z-spectrum, R1rho-spectrum, and asymmetry analysis at patella cartilage and muscle from in vivo experiments. B0 map shows a 50Hz B0 field inhomogeneity at cartilage region, and 20Hz at muscle. Note at the cartilage region, the MTRasym calculated from CEST z-spectrum has a peak signal at around 320Hz, which is unlikely contributed by the hydroxyl-water exchange from GAG. There is no obvious signal in MTRasym of CESL. The adiCESL R1rhoasym, however, detects reasonable signal at around 100Hz resonance frequency offset. At muscle region, all three methods detect signal at around 300Hz resonance frequency offset.Conclusion
Our preliminary results demonstrate the feasibility to use CESL to detect GAG at 3.0T. The method we proposed can be used to mitigate the adversary effect from B1 RF and B0 field inhomogeneity on the conventional CESL.Acknowledgements
This study is supported by the grant from the Research Grants Council of the Hong Kong SAR (Project No. SEG CUHK02).References
1. Ling W, Regatte RR, Navon G, Jerschow A. Assessment of glycosaminoglycan concentration in vivo by chemical exchange-dependent saturation transfer (gagCEST). Proceedings of the National Academy of Sciences. 2008;105(7):2266-2270. doi:10.1073/pnas.0707666105.
2. Wei W, Jia G, Flanigan D, Zhou J, Knopp MV. Chemical exchange saturation transfer MR imaging of articular cartilage glycosaminoglycans at 3T: Accuracy of B0 Field Inhomogeneity corrections with gradient echo method. Magnetic Resonance Imaging. 2014;32(1):41-47. doi:10.1016/j.mri.2013.07.009. 3. Jin T, Autio J, Obata T, Kim S-G. Spin-locking versus chemical exchange saturation transfer MRI for investigating chemical exchange process between water and labile metabolite protons. Magnetic Resonance in Medicine. 2010;65(5):1448-1460. doi:10.1002/mrm.22721.
4. Jin T, Kim S-G. Advantages of chemical exchange-sensitive spin-lock (CESL) over chemical exchange saturation transfer (CEST) for hydroxyl- and amine-water proton exchange studies. NMR in Biomedicine. 2014;27(11):1313-1324. doi:10.1002/nbm.3191.
5. Jin T, Wang P, Zong X, Kim S-G. Magnetic resonance imaging of the Amine–Proton EXchange (APEX) dependent contrast. NeuroImage. 2012;59(2):1218-1227. doi:10.1016/j.neuroimage.2011.08.014. 6. Zaiss M, Bachert P. Exchange-dependent relaxation in the rotating frame for slow and intermediate exchange - modeling off-resonant spin-lock and chemical exchange saturation transfer. NMR in Biomedicine. 2012;26(5):507-518. doi:10.1002/nbm.2887.
7. Chen W. Robust On- and Off-Resonance constant amplitude spin-lock at the presence of B1 RF and B0 field inhomogeneity. ISMRM 25th Annual Meeting, Hawaii, 2017, 1394.
8. Zaiss M, Zu Z, Xu J, et al. A combined analytical solution for chemical exchange saturation transfer and semi-solid magnetization transfer. NMR in Biomedicine. 2014;28(2):217-230. doi:10.1002/nbm.3237.
Figures