2256
Baseline System Variability of Test-Retest and Cross-Platform Liver MR Elastography1200 1st St Sw, Mayo Clinic, Rochester, MN, United States, 2Siemens Healthineers, Salt Lake City, UT, United States
Synopsis
Liver MR Elastography (MRE) has become an important noninvasive liver fibrosis imaging modality. It is essential to know the system variability of the stiffness measurements as only liver stiffness changes greater than the system variability are meaningful and reflect the true liver changes with 95% confidence. Our study was to perform a single-institution, single-reader study of fasting, normal subjects to assess the baseline (minimum possibly) MRE system variability within and between days, within and between platforms.
INTRODUCTION
Liver stiffness measured using MR elastography (MRE) has become an important noninvasive imaging biomarker for the diagnosis and staging of hepatic fibrosis. In longitudinal single- and multicenter studies, it is essential to know the inter- and intra-system variability of the stiffness measurements as only liver stiffness changes greater than the system variability are meaningful and reflect the true liver changes with 95% confidence. System variability must be estimated by considering factors like the time interval between two measurements, the measurement devices used (MRE platforms, sequences, and algorithms), institutional variations (readers, sites) and patient characteristics (fasting status, diseases). A recent meta-analysis study found system variability ranged from 12% to 37% in the 12 papers analyzed that used different study parameters, and estimated that 22% is the system variability at the same site with the same equipment and sequence 1. The purpose of our study was to perform a single-institution, single-reader study of fasting, normal subjects to assess the baseline MRE system variability.
METHODS
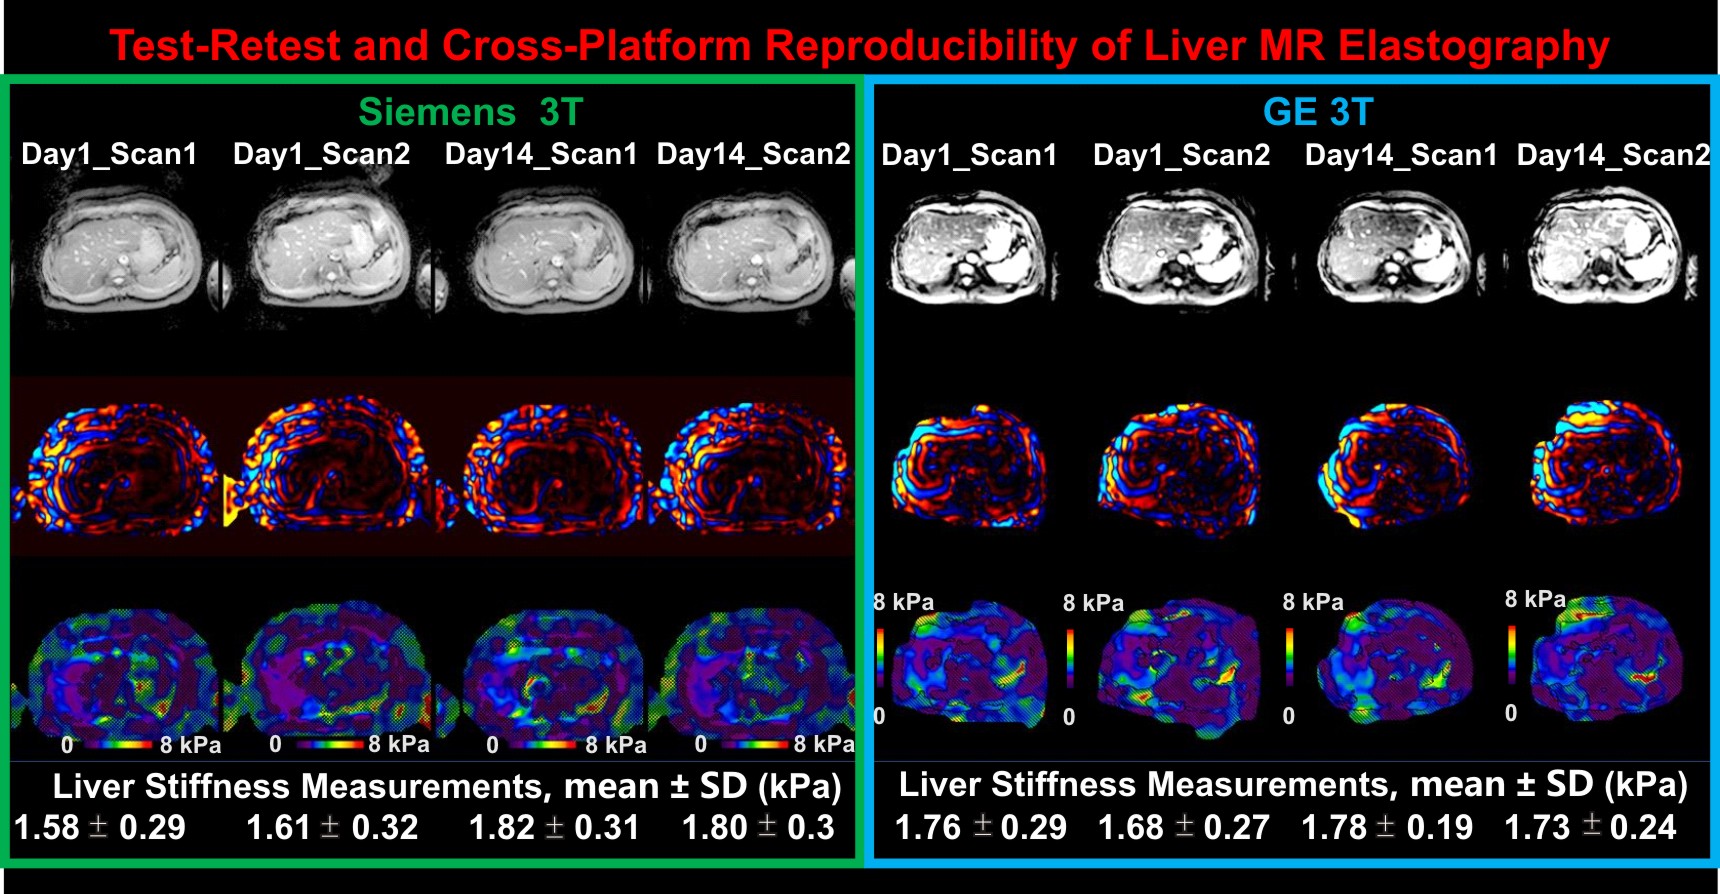
MRE: 60-Hz, axial, 2D liver MRE using a single-shot, spin-echo, echo-planar imaging (SS SE-EPI) technique was performed on a GE Signa HDxt 3T scanner (Milwaukee, WI) and a Siemens Skyra 3T scanner (Erlangen, Germany) using the same flexible, passive, liver MRE driver system. Imaging parameters included: slice thickness/gap = 10 mm/0 mm, 4 slices, TR = 1000 ms, TE = 52 ms (GE) or 40 ms (Siemens), FOV = 42X42 cm, acquisition matrix = 100X100, through-plane motion encoding.
Subjects: 11 healthy volunteers without known liver disease were enrolled in this prospective, IRB-approved study with written informed consent. All subjects fasted at least 4 hours prior to the MRI scans.
Test-Retest Schedule: MRE was performed twice on each subject about 15 minutes apart with the subjects removed from the scan room, repositioned, and rescanned on the GE system first. Then the same procedure was repeated on the Siemens scanner. The same procedure was repeated again about 14 days later on the two scanners. One volunteer skipped the last day-14 Siemens scan.
Statistical Analysis: A linear mixed model was used to analyze the test-retest coefficient of variation (CV, standard deviation/mean, %) contribution from each factor (same day, different days, same platform, and different platforms) and the residual. The total CV was calculated for the different scenarios by considering all of the factors that define the scenarios: $$$ CV_{total}= \sqrt{(\sum CV_i^2+CV^2_{residual})} $$$. With this total CV, 95% of the measurements will fall in the range of $$$ ± 1.96 × CV_{total} $$$, which is defined as the system variability. In the mixed effect model, the intercept was a fixed effect and scan, day, platform and volunteers were random effects. Because the two scans done in one day were different than them being repeated on a different day, the scan variable was nested in the day variable in the statistical analysis. Intra-scanner reproducibility was calculated between day 1 and day 14 using intra-class correlation coefficients (ICCs) for the two platforms. The inter-scanner reproducibility was calculated between the GE and Siemens platforms by averaging the day-1 and day-14 measurements. JMP 12 Pro (Cary, NC) was used.
RESULTS
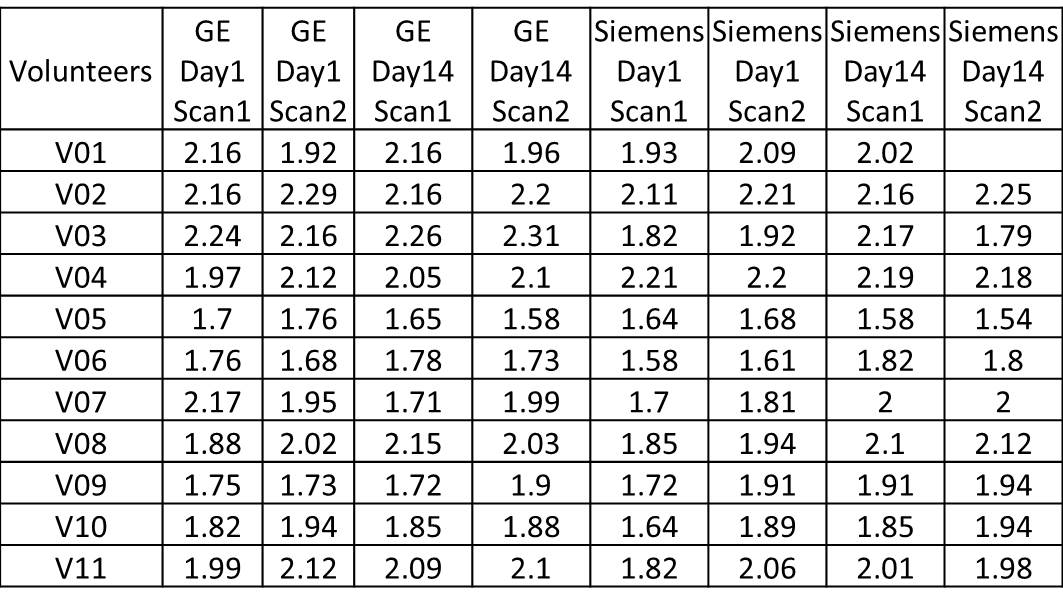
Fig. 1 shows example MRE images collected in the test-retest and cross-platform scans. Fig. 2 shows liver stiffness sorted by scan, day and platform for all volunteers. Table 1 shows the CV of each individual random effect. Table 2 show the total CV and system variability under the different scenarios. The intra-scanner ICCs were GE = 0.8816 and Siemens = 0.7527. The inter-scanner (GE-Siemens) ICC = 0.7911.
Table 1 Component coefficient of variations
| Factors | CV (%) |
| volunteer | 8.67 |
| day | 1.31 |
| scan[day] | 1.10 |
| platform | 1.35 |
| residual | 5.64 |
Table 2 System variability for different scenarios
Scenarios | CV (%) | System Variability (±%) |
| Difference Scan Same Day | 5.75 | 11.26 |
| Difference Scan Same Day Different Platform | 5.90 | 11.57 |
| Difference Scan Different Day | 5.89 | 11.55 |
| Difference Scan Different Day Different Platform | 6.05 | 11.85 |
DISCUSSION
Our data showed that with a single reader and fasting, healthy volunteers, a true hepatic stiffness change with 95% confidence should not be less than 11.55% for the same platform, and 11.85% for different platforms. Our study had well controlled factors. Our volunteers fasted 4 hours prior to the scan, which resulted in a smaller day CV (1.31%) when compared to other studies, such as the 8.5% CV observed in an earlier study without meal restriction 2. In future studies, we will assess the system variability associated with different readers.
CONCLUSION
There is a significant inter- and intra-scanner reproducibility of 2D MRE liver stiffness measurements on GE and Siemens systems in healthy volunteers. The baseline system variabilities assessed in well-controlled scenarios provide minimum possible MRE measurement variations at a system level.Acknowledgements
References
1. Serai SD, Obuchowski NA, Venkatesh SK, et al. Repeatability of MR Elastography of Liver: A Meta-Analysis. Radiology 2017;285:92-100.
2. Hines CD, Bley TA, Lindstrom MJ, Reeder SB. Repeatability of magnetic resonance elastography for quantification of hepatic stiffness. J Magn Reson Imaging 2010;31:725-31.
Figures