2255
Quantification of the absolute accuracy and precision of DCE-MRI measurements of the arterial input function1National Centre for Advanced Medical Imaging (CAMI), St James Hospital / School of Medicine, Trinity College University of Dublin, Dublin 8, Ireland, 2Department of Radiology, Mayo Clinic, Rochester, MN, United States
Synopsis
A novel anthropomorphic phantom test device was used to investigate the effects of temporal resolution (Tres), B1+-field non-uniformities, and pharmacokinetic (PK) model fitting methods on the absolute accuracy and precision of DCE-MRI measurements of the arterial input function (AIF), and resulting PK parameter estimates. Optimizing the Tres was found to reduce the maximum errors in PK parameter estimation from ~47% to ~20%. By correcting for B1+-field non-uniformities these errors were further reduced to ~7%. Using a linear rather than non-linear version of the standard Tofts model further increased the accuracy and precision of PK parameter estimations.
Introduction
The arterial input function (AIF) is a measure of change in contrast agent (CA) concentration over time in a blood vessel feeding the tissue of interest, and is critical to the retrieval of pharmacokinetic (PK) perfusion parameters using the standard Tofts model in quantitative DCE-MRI [1]. However, to date a method has been lacking which allows for repeated acquisitions of a known ‘ground truth’, physiologically-relevant AIF, in an anthropomorphic environment which replicates the challenges faced in abdominal / pelvic imaging. This has hampered a comprehensive investigation into the absolute accuracy and precision of AIF measurements made using various DCE-MRI approaches. This shortcoming is addressed in the present study, wherein a completely characterized phantom device was used to quantify the effects of temporal resolution (Tres), B1+-field non-uniformities, and PK model fitting regime on the accuracy and precision of AIF measurements and resulting PK parameter estimates [2].Methods
In order to establish a physiologically-relevant curve-shape for the AIF used herein, prostate DCE data from an earlier in vivo study was used (n=32), with data acquired with a Tres of 3.1s using a 3T scanner (Achieva, Philips, Netherlands) and 8-channel detector coil coupled with an endorectal coil (3D-SPGR, TR/TE=5.5/2.0ms, α=15°, FOV=256x256x60mm3, voxels=1x1x6mm3, SENSE factor=2). A ground truth AIF was then established for the phantom system based on this patient-derived AIF using repeated measurements from a highly precise optical imaging system (5 intra-/ 5 inter-session) [2]. The ground truth AIF was then repeatedly measured (5 intra-/ 5 inter-session) using the scanner with a 32-channel detector coil (3D-SPGR, TR/TE=3.5/1.6ms, α=23°, FOV=224x224x18mm3, voxels=1x1x6mm3) simultaneously with either ‘healthy’ or ‘tumor’ prostate tissue CA-concentration-time curves, with Tres = [1.2 - 30.6s]. B1+ maps were also acquired using a dual-steady-state sequence with the same geometry and spatial resolution as above and with: TR1/TR2/TE = 30ms/150ms/2ms, α=60°. The data were analyzed with and without voxel-wise flip-angle correction (VFAC) applied, with root mean square errors (RMSE) and concordance correlation coefficient (CCC) values calculated between the MR-measured and ground truth AIFs, as well as PK modelling performed using linear and non-linear forms of the standard Tofts PK model [1, 3], with all results compared against precisely known ground truth values.Results
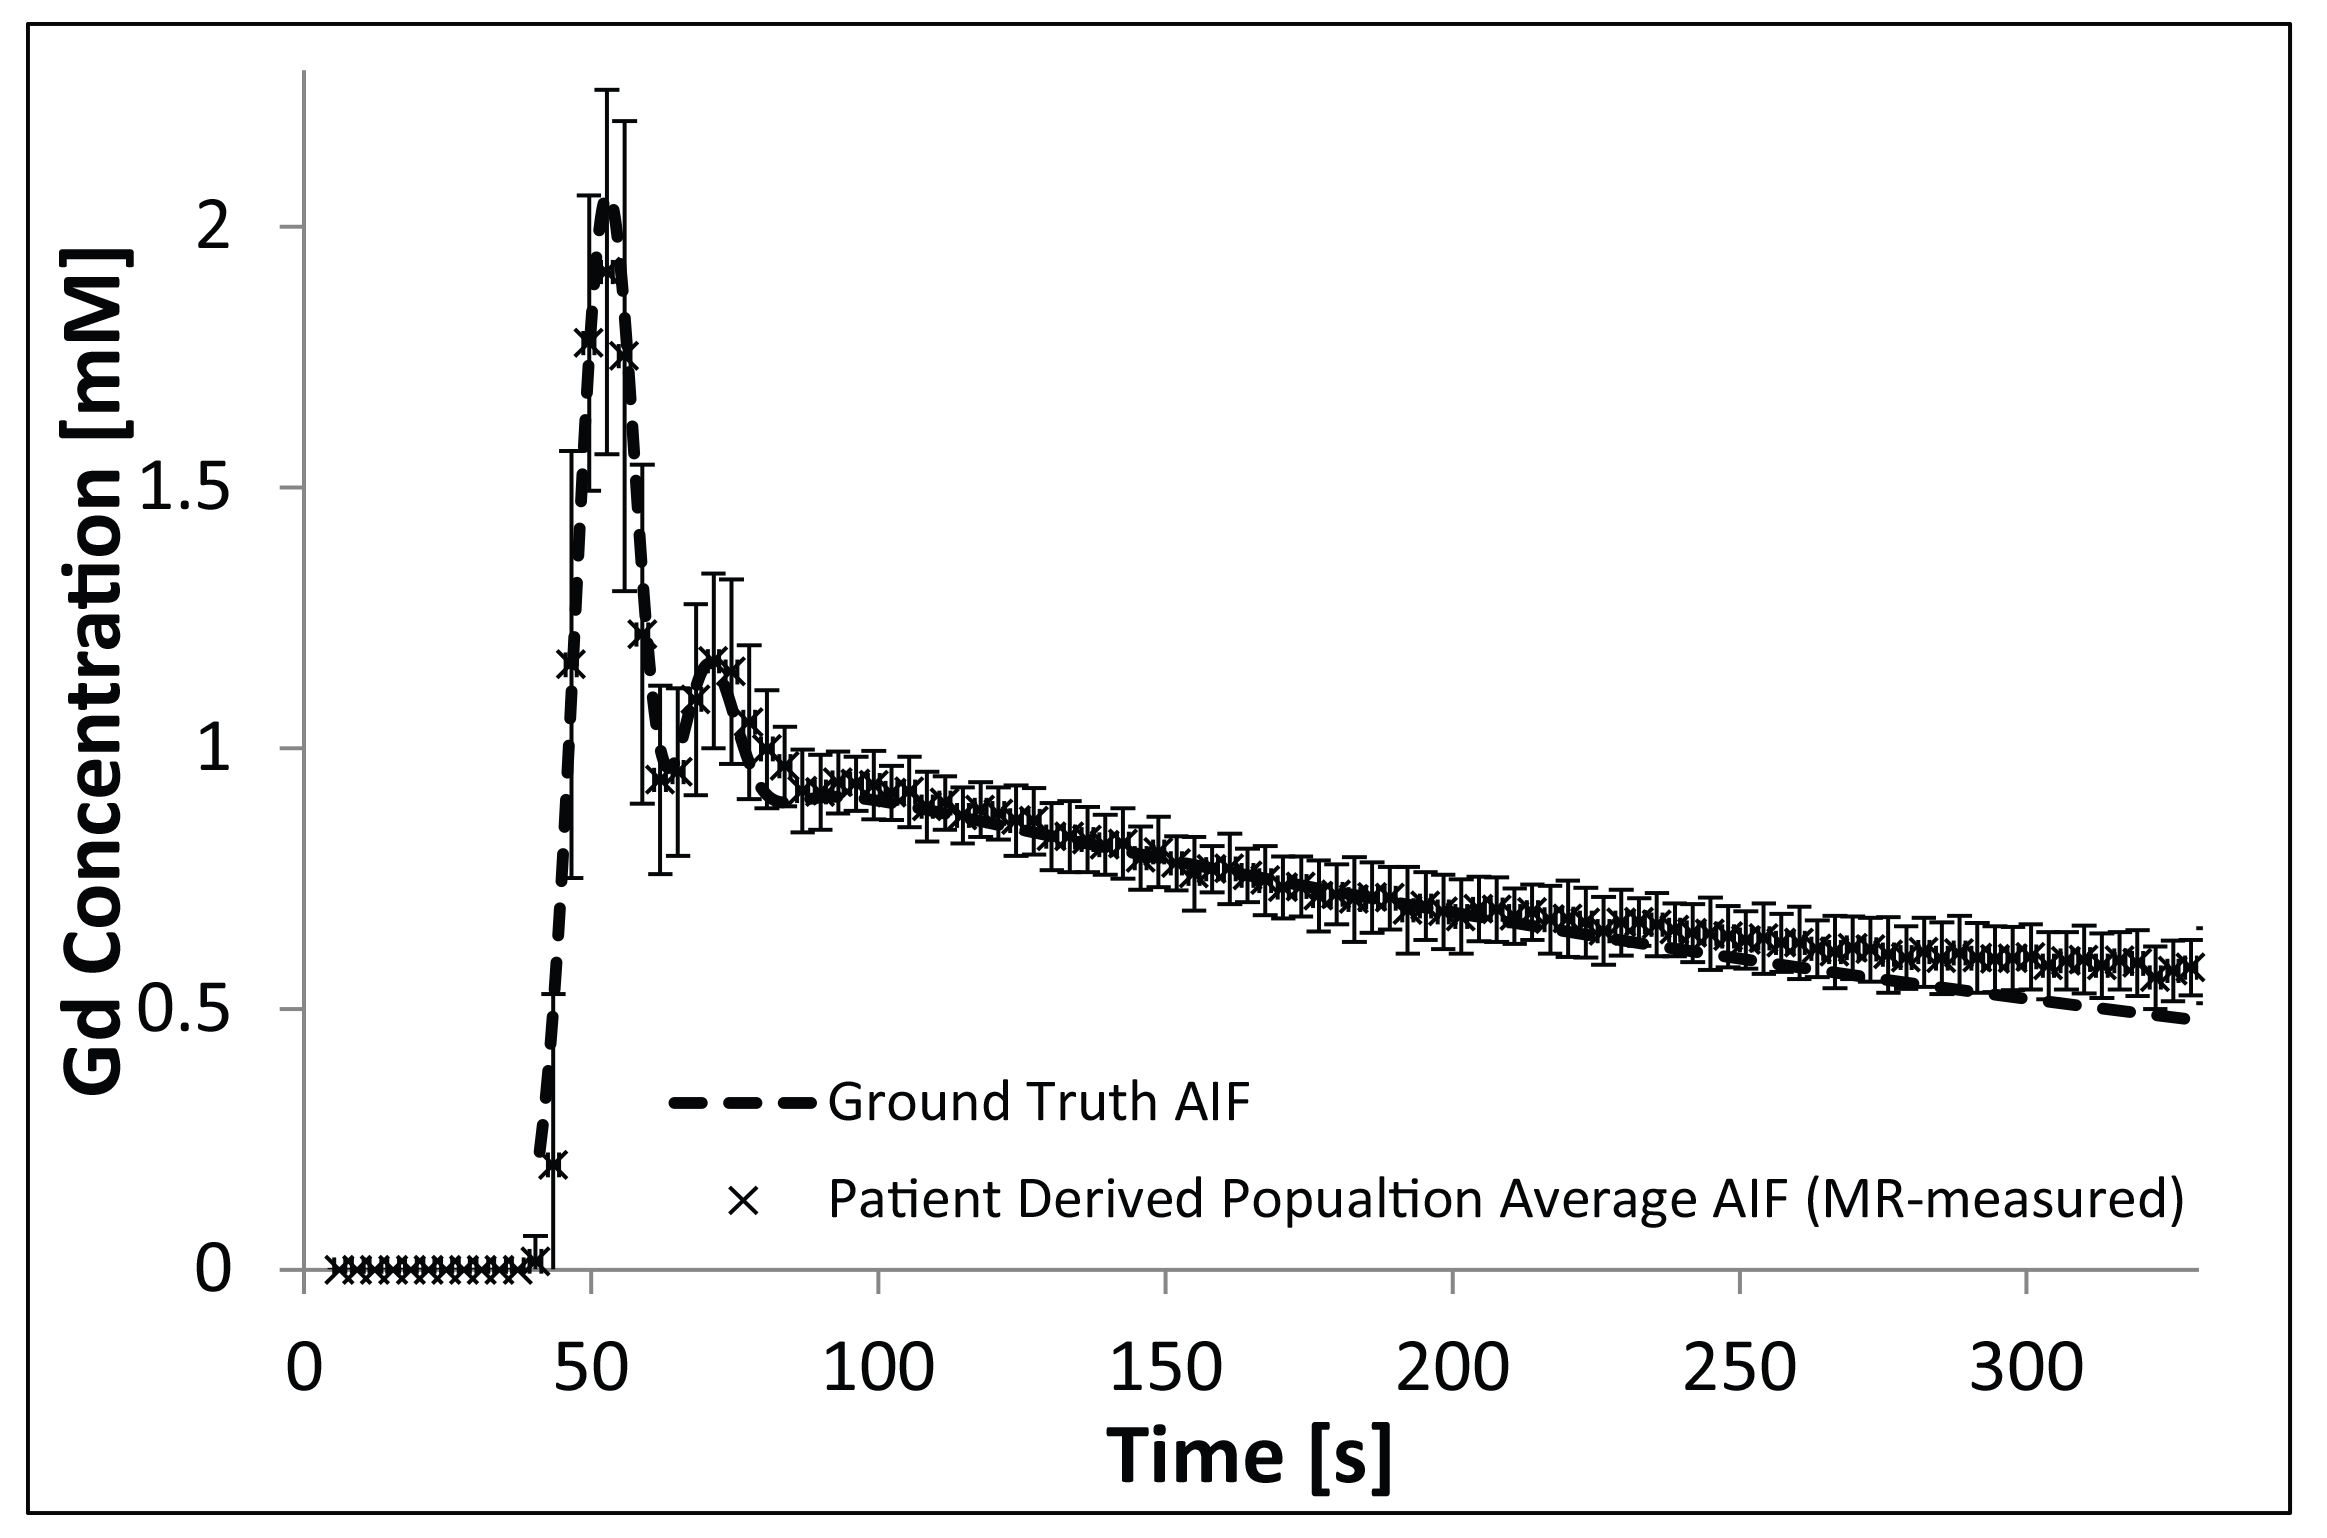
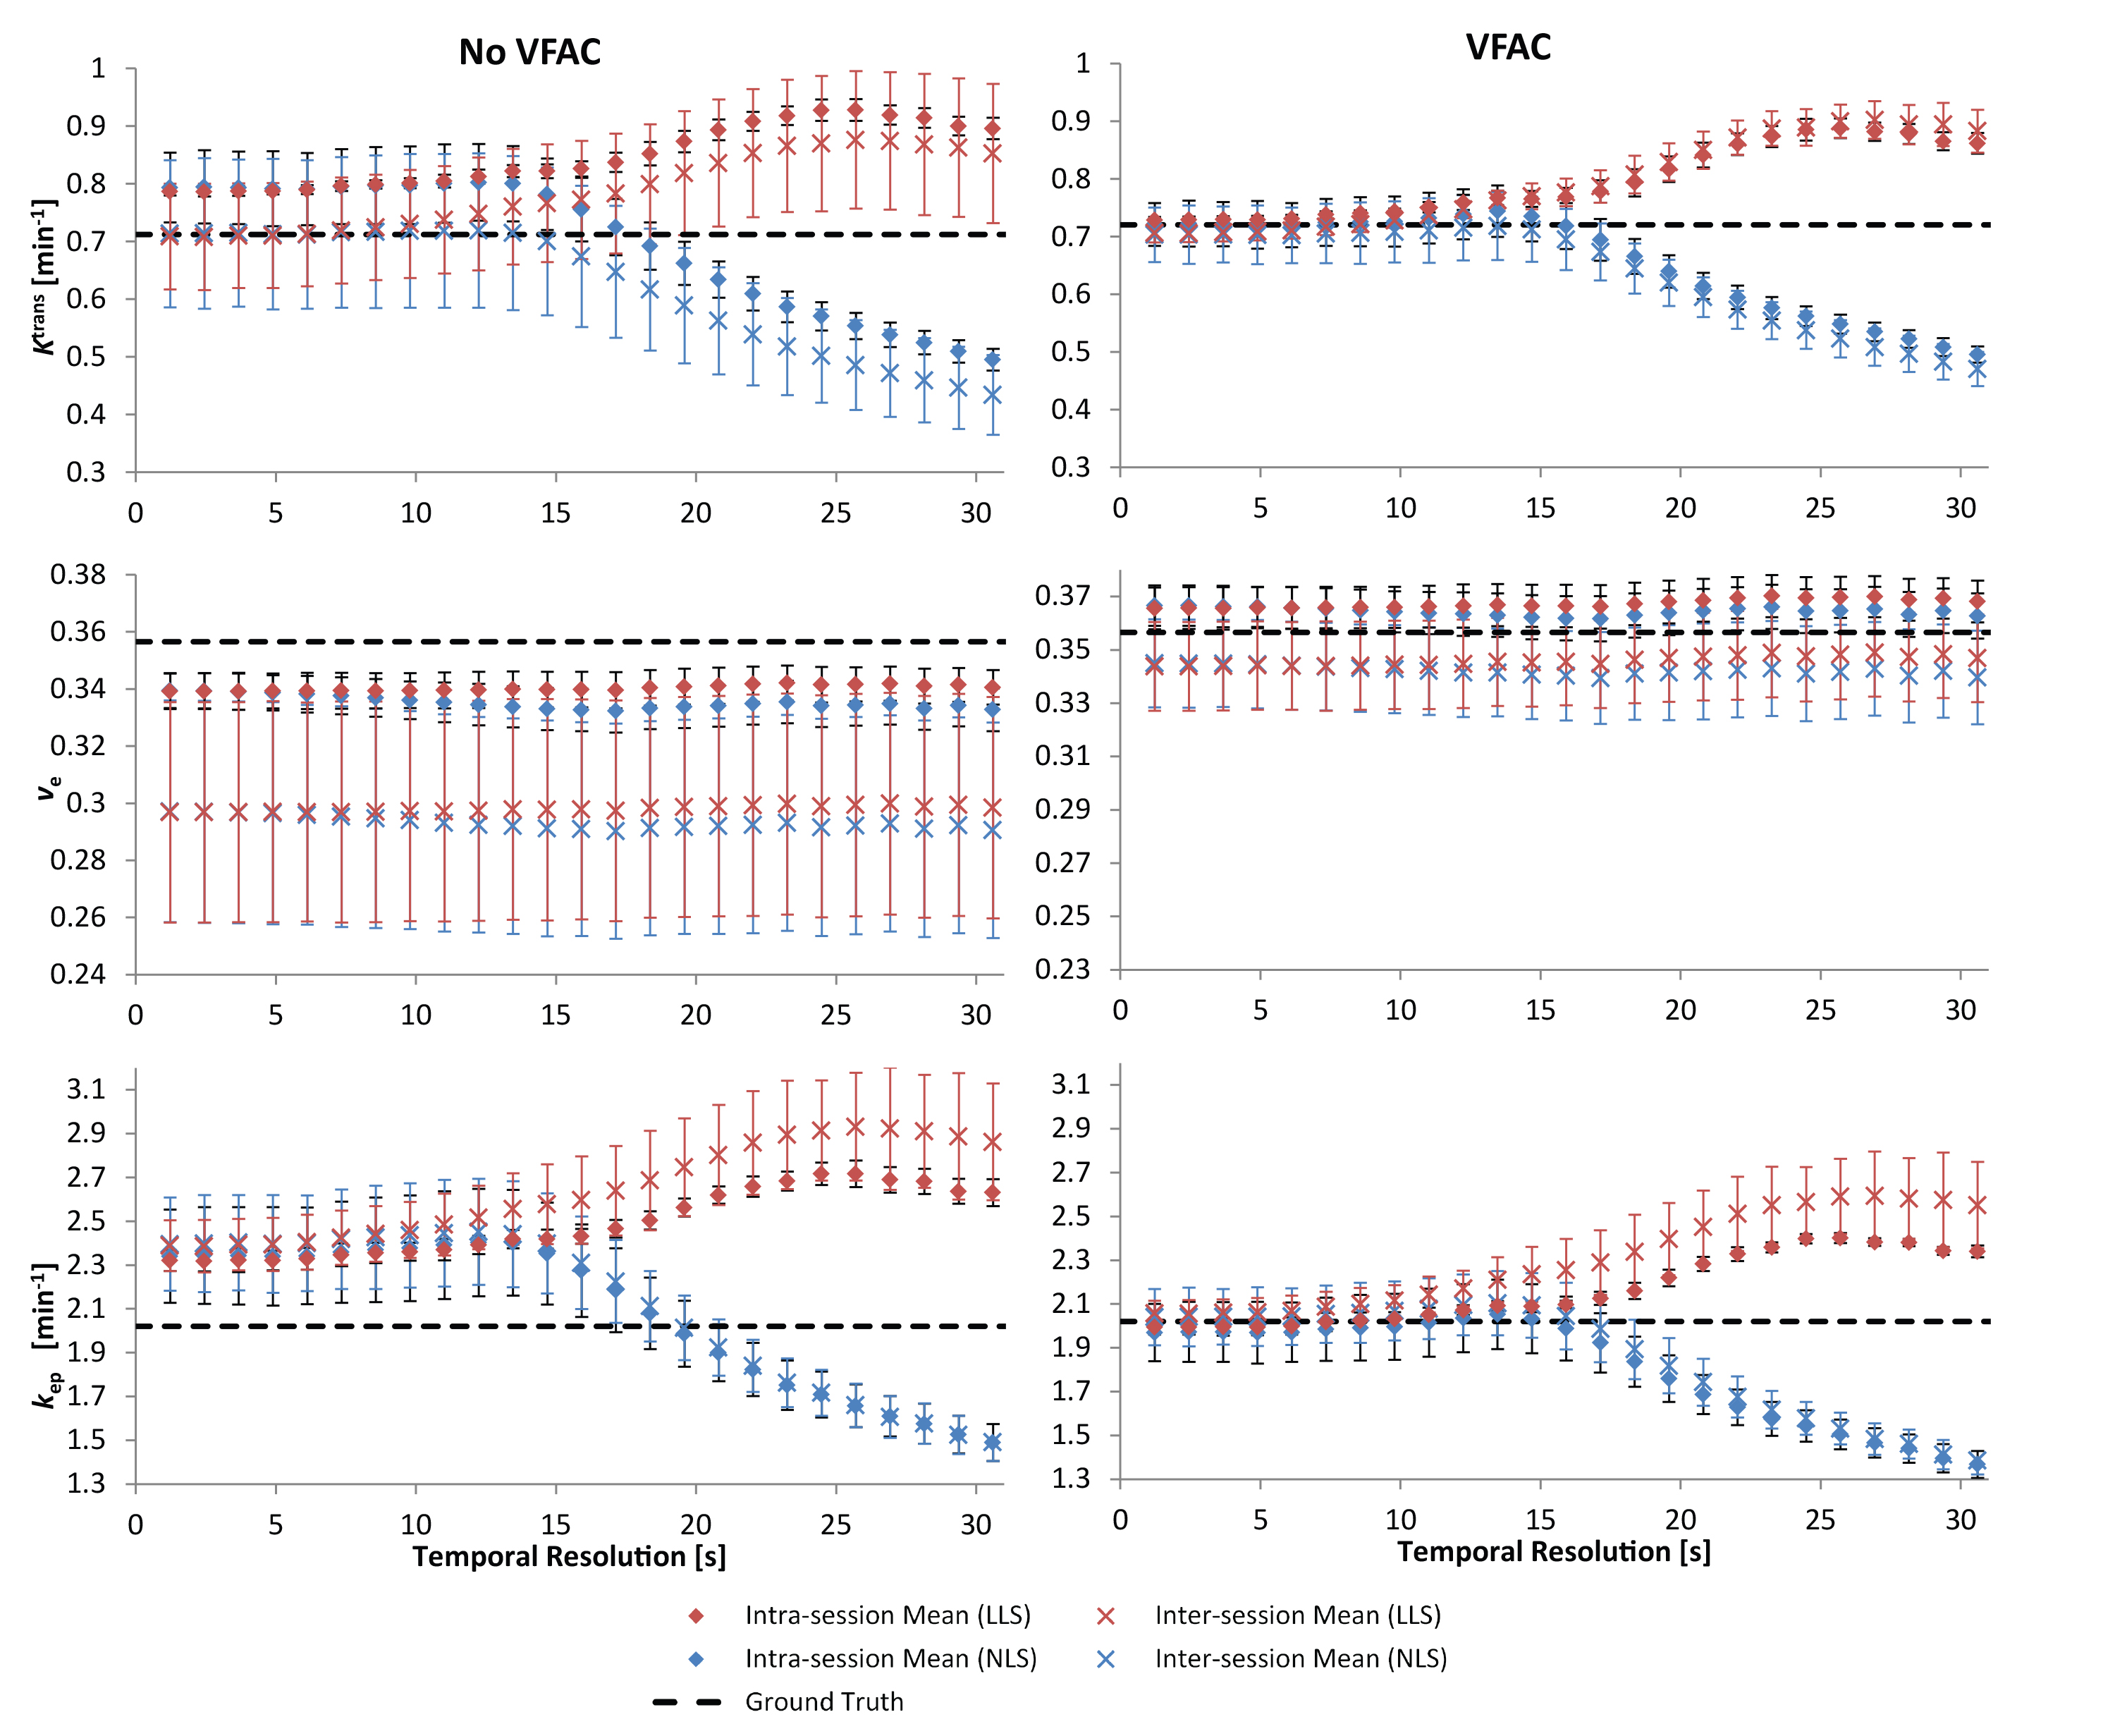
Figure 1 shows the population-averaged AIF established from 32 patient datasets, along with the ground truth AIF established from repeated optical measurements. Optical intra-/inter-session measurements gave high repeatability for the AIF produced at the phantom device, with all CCC values >0.995 (95% confidence intervals = [0.992,0.999]) and %RMSE ≤1.1%. For DCE phantom measurements, the actual flip-angle at the ROIs where measurements were performed differed from the set value by between -29% and -33% for all experiments, which led to large underestimations in the derived Gd concentrations, as illustrated in Figure 2(a), with correspondingly low CCC values (minimum CCC = 0.42, and %RMSE of up to 14%). These errors were greatly reduced when VFAC was applied to the data, as illustrated in Figure 2(b), with a corresponding gain in the CCC (>0.83) and %RMSE (<8%) values. Large errors in PK parameter estimations of up to 47% were found when an inappropriate Tres was used and no VFAC performed; by optimizing the Tres these errors reduced to ~20%, and by applying VFAC these errors were further decreased to ≤7% (as illustrated in Figures 3). Additionally, the use of a linear PK modelling fitting regime, rather than non-linear, almost doubled the accuracy of certain parameter estimations, increased intra-/inter-session precision by up to a further 4%, and relaxed the dependence of the accuracy of the results on the Tres used.Discussion
These results demonstrate the significant effect that Tres and B1+-field non-uniformities can have on DCE-MRI measurements, and thus underpins the importance of controlling these parameters by careful acquisition sequence optimization, B1+-field mapping, and the use of an appropriate data pre-processing regime to correct for flip-angle deviations. These results also demonstrated that a further appreciable gain in PK modelling accuracy and precision can be achieved through the optimization of the PK model fitting regime.Conclusion
The results of this study provide quantitative insight into the effects of Tres, B1+-field non-uniformities, and the applied PK model-fitting strategy on the accuracy and precision of DCE-MRI measurements. This type of quantitative phantom-based approach can be used to optimize and validate new and existing DCE acquisition protocols, ensuring consistent measurement accuracy, and offers the prospect of increasing the sensitivity and specificity of DCE-MRI, possibly leading to a standardization in the way DCE-MRI is performed, and thus a wider acceptance of the technique for use in routine clinical examinations.Acknowledgements
Supported by Irish Cancer Society Research Scholarship CRS13KNIReferences
[1] Tofts PS, Brix G, Buckley DL, Evelhoch JL, Henderson E, Knopp MV, et al. Estimating kinetic parameters from dynamic contrast-enhanced T(1)-weighted MRI of a diffusable tracer: standardized quantities and symbols. J Magn Reson Imaging. 1999;10:223-32.
[2] Knight SP, Browne JE, Meaney JF, Smith DS, Fagan AJ. A novel anthropomorphic flow phantom for the quantitative evaluation of prostate DCE-MRI acquisition techniques. Phys Med Biol. 2016;61:7466-83.
[3] Murase K. Efficient method for calculating kinetic parameters using T1-weighted dynamic contrast-enhanced magnetic resonance imaging. Magn Reson Med. 2004;51:858-62
Figures