2254
Evaluation of A Method for Simultaneous in vivo Measurements of Blood T1 and T21Interdisciplinary Institute of Neuroscience and Technology, Qiushi Academy for Advanced Studies, Zhejiang University, Hangzhou, China, 2College of Biomedical Engineering & Instrument Science, Zhejiang University, Hangzhou, China, 3Center for Magnetic Resonance Research, School of Medicine, University of Minnesota, Minneapolis, MN, United States, 4Division of Biostatistics, School of Public Health, University of Minnesota, Minneapolis, MN, United States, 5Laboratory of Integrative Human Physiology, School of Kinesiology, University of Minnesota, Minneapolis, MN, United States, 6Neuropsychology Section, Hennepin County Medical Center, Minneapolis, MN, United States, 7Berman Center for Clinical Research, Hennepin County Medical Center, Minneapolis, MN, United States
Synopsis
The longitudinal and transverse relaxation time constants of blood are important parameters for MRI methods and biomedical research studies. However, these parameters can vary largely across subjects, and change significantly across developmental stages, with physiological states, and due to specific diseases, which has motivated in vivo measurements of these parameters. We implemented a fast method for simultaneous in vivo measurements of blood T1 and T2. The study results suggest that the in vivo measurements of blood T1 and T2 can be achieved in about 25 s using the implemented method.
Purpose
The longitudinal and transverse relaxation time constants of blood are important parameters for MRI methods1,2 and biomedical research studies, such as the estimates of overall brain metabolism3-5. These parameters can vary largely across subjects, and change significantly across developmental stages, with physiological states, and due to specific diseases, all of which have motivated in vivo measurements of these parameters6-8. We implemented an imaging method for simultaneous in vivo measurements of blood T1 and T2 taking only about 25 s by combining the look-locker T1-weigthed image acquisition following an adiabatic saturation recovery and the blood-tagging-facilitated T2-weigthed image acquisition using the MLEV T2 preparation8. The results from evaluation studies of this method are reported in the following.Methods
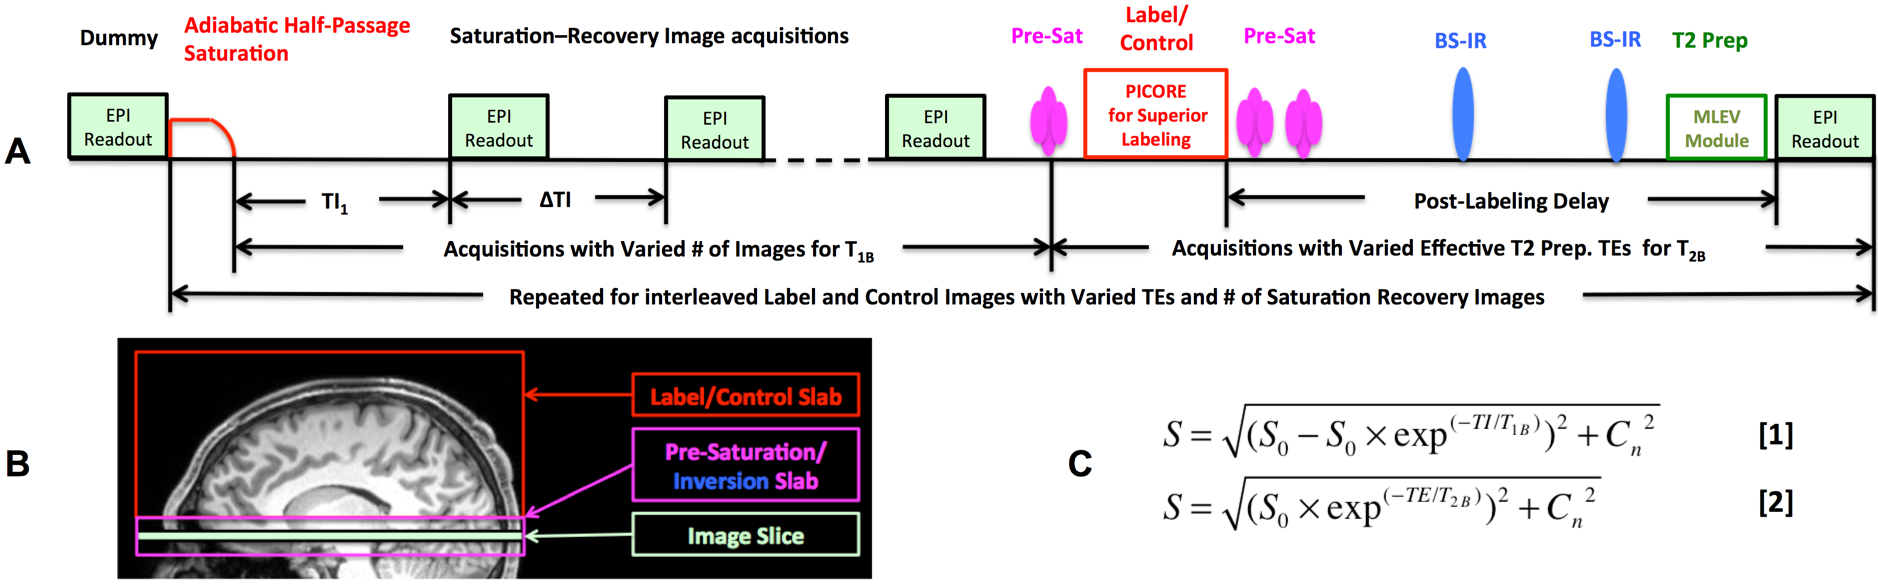
Studies were performed with healthy volunteers on a Siemens 3T Prisma MRI scanner under an IRB approved protocol with written informed consent. The body coil was used for RF transmission and a 32-channel phased array head coil for signal reception. The sequence diagram of the implemented imaging method is presented in Figure 1A, and the slabs for superior venous blood tagging using the PICORE method9 and the imaging slice to measure the venous blood within the sagittal sinus are illustrated in Figure 1B.
For the performed studies, a typical acquisition consisted of 86 single-slice EPI measurements with 60 T1-weigthed images from look-locker saturation recovery acquisitions and 8 T2-weighted label and control images from the scans using superior blood tagging combined with MLEV T2 preparation (Figure 1A-1B). The T1-weighted image acquisitions were followed by T2-weigthed label or control image acquisitions that were acquired in an interleaved fashion and sequentially for four effective TE times: 0, 40, 80 and 160 ms. The number of look-locker T1-weighted images acquired before the acquisitions for four pairs of T2-weigthed label and control images were: 2, 4, 8, and 16. The major imaging parameters for single-shot EPI were as follows: FOV = 218 x 218 mm2; matrix size = 64 x 64; in-plane resolution = 3.4 x 3.4 mm2; slice thickness = 5 mm; TI1 = ΔTI = 200 ms; post-labeling delay = 1050 ms; and total acquisition time = ~ 25 s.
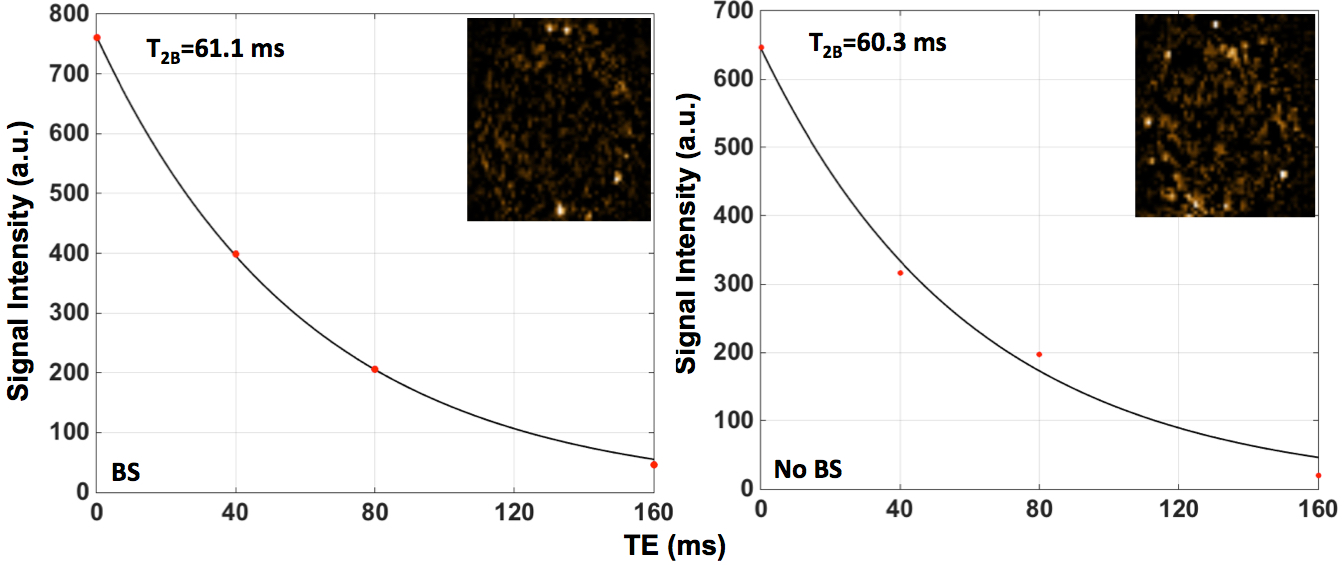
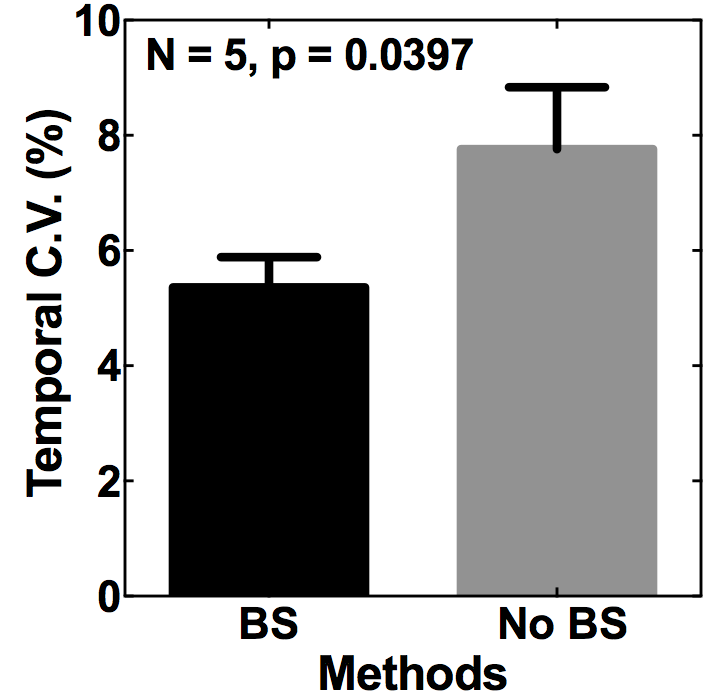
To estimate the noise level for measured blood signals, one noise image was acquired by turning off all RF pulses of the sequence. To explore the potential benefits of background suppression on blood T2 measurements, a series of acquisitions were performed to evaluate the temporal variability of blood T2 measurements: 10 acquisitions with and another 10 acquisitions without applied background suppression.
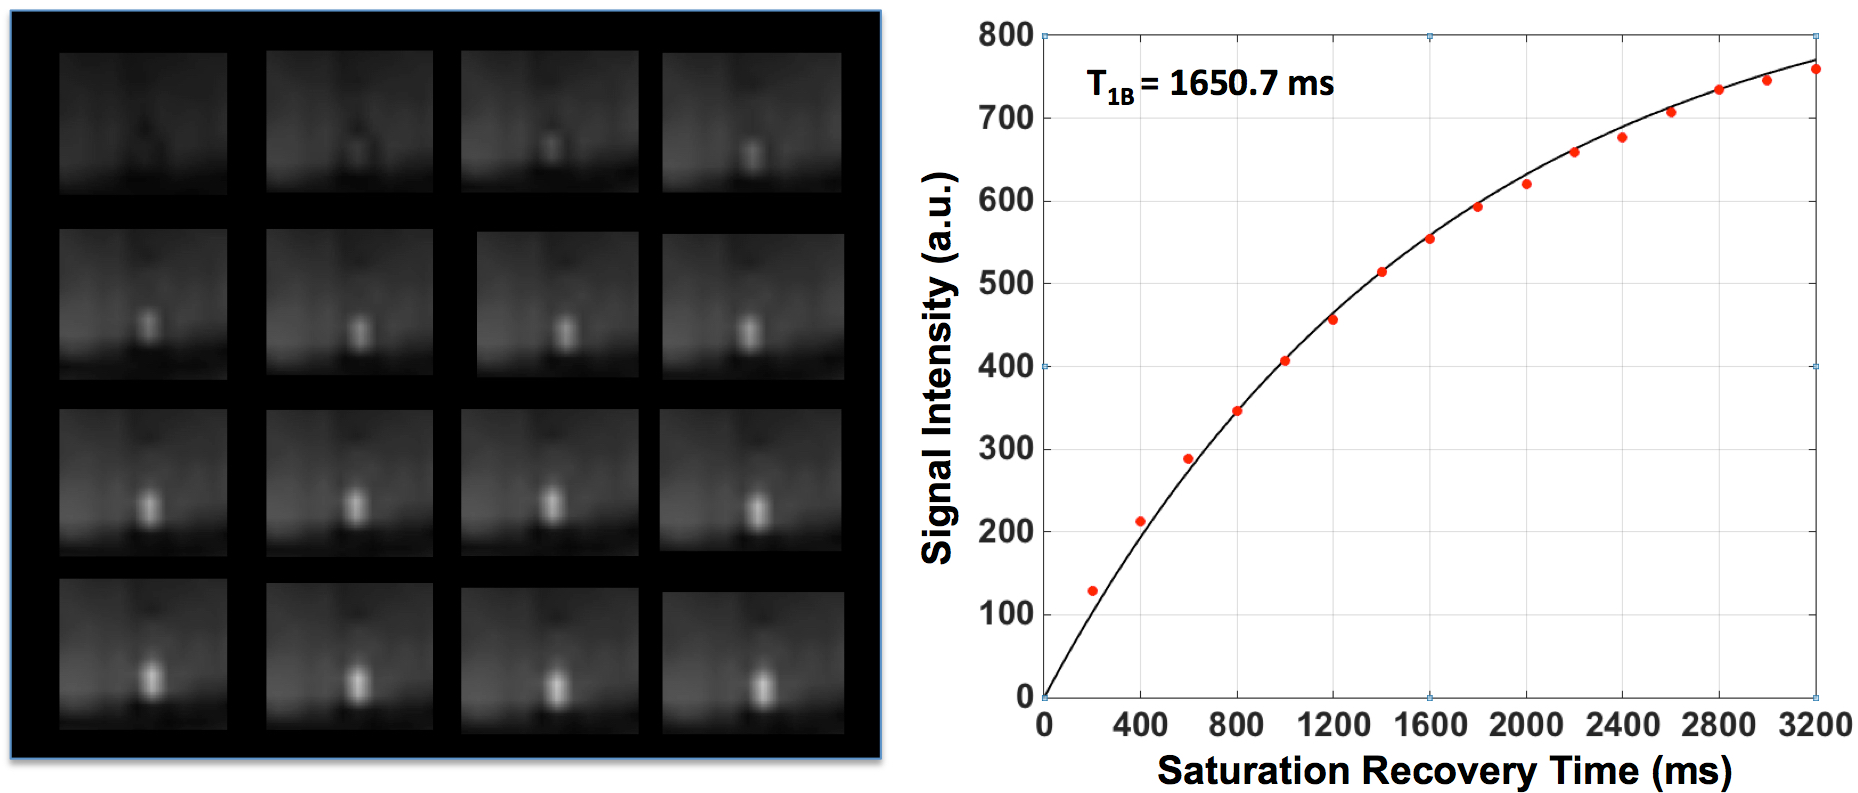
Post-processing, including motion correction, was performed using the FSL toolbox, and model fittings for the estimates of blood T1 and T2 utilized the equations in Figure 1C and scripts implemented in MATLAB. The T1-weighted images acquired with the same saturation recovery time were co-registered and averaged before obtaining the means of venous blood signals within the sagittal sinus. Because of varied saturation recovery times, T1-weighting effects on the measured T2-weighted blood signals also vary across four pairs of label and control images. Such effects were compensated by using saturation recovery model and the estimated blood T1. Statistical analyses were performed within the GraphPad.
Results and Discussions
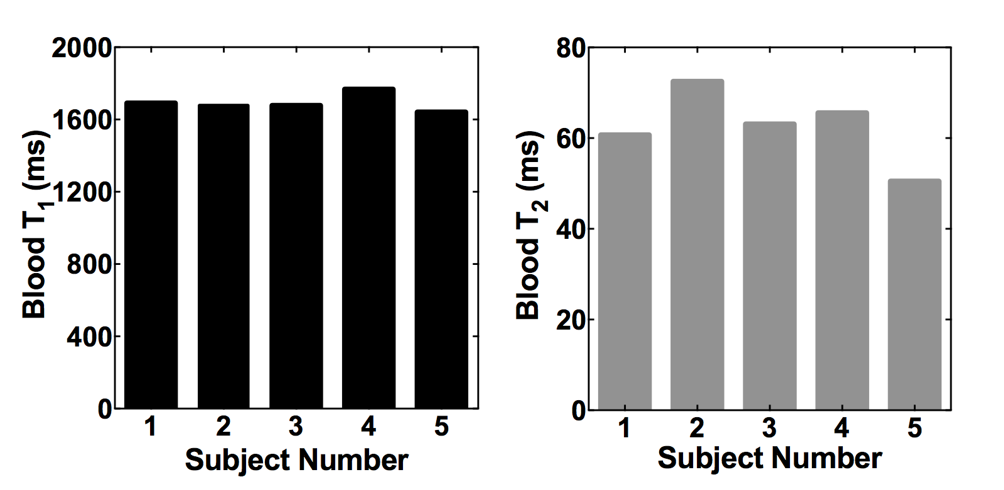
The results for blood T1 and T2 measurements from one subject are presented in Figures 2 and 3, respectively. Figure 4 shows the estimated blood T1 and T2 values from 5 volunteers. The calculated temporal coefficients of variance for a series of 10 blood T2 measurements with or without applied background suppression are shown in Figure 5.
The study results indicated that the implemented method could provide in vivo blood T1 and T2 estimates, and these estimates are comparable to those in literature6-8. Our preliminary results suggested that the applied background suppression could help to increase the reliability of T2-weigthed blood measurements, especially the reliability of those measurements with long effective TEs, by reducing the potential contamination and motion-related subtraction errors from background signals, improving the model fitting (Figure 3). Furthermore, our preliminary results suggest that the applied background suppression can improve the temporal stability of blood T2 measurements (Figure 5), and that it is beneficial to use the prolonged saturation recovery time to enhance the signal-to-noise ratio of the T2-weigthed blood measurements with large effective TEs.
Conclusions
The in vivo blood T1 and T2 measurements can be achieved in about 25 s using the implemented simultaneous blood T1 and T2 imaging method.Acknowledgements
P41 EB015894, P30 NS076408, UMF0003900, and UL1TR000114. The content is solely the responsibility of the authors and does not necessarily represent the official views of the National Institutes of Health.References
- Detre JA, Leigh JS, Williams DS, Koretsky AP. Perfusion imaging. Magn Reson Med. 1992;23(1):37-45.
- Edelman RR, Chien D, Kim D. Fast selective black blood MR imaging. Radiology. 1991;181(3):655-660.
- Jordan LC, Gindville MC, Scott AO, et al. Non-invasive imaging of oxygen extraction fraction in adults with sickle cell anaemia. Brain. 2016;139(Pt 3):738-750.
- Kety SS, Schmidt CF. The Effects of Altered Arterial Tensions of Carbon Dioxide and Oxygen on Cerebral Blood Flow and Cerebral Oxygen Consumption of Normal Young Men. J Clin Invest. 1948;27(4):484-492.
- Xu F, Ge Y, Lu H. Noninvasive quantification of whole-brain cerebral metabolic rate of oxygen (CMRO2) by MRI. Magn Reson Med. 2009;62(1):141-148.
- Li W, Liu P, Lu H, Strouse JJ, van Zijl PCM, Qin Q. Fast measurement of blood T1 in the human carotid artery at 3T: Accuracy, precision, and reproducibility. Magn Reson Med. 2017;77(6):2296-2302.
- Qin Q, Strouse JJ, van Zijl PC. Fast measurement of blood T1 in the human jugular vein at 3 Tesla. Magn Reson Med. 2011;65(5):1297-1304.
- Xu F, Uh J, Liu P, Lu H. On improving the speed and reliability of T2-relaxation-under-spin-tagging (TRUST) MRI. Magn Reson Med. 2012;68(1):198-204.
- Wong EC, Buxton RB, Frank LR. Implementation of quantitative perfusion imaging techniques for functional brain mapping using pulsed arterial spin labeling. NMR Biomed. 1997;10(4-5):237-249.
Figures