2251
Quantitative estimation of sub-voxel fat and water fractions based on two T2-component fitting in calf muscle.1Department of Biomedical Engineering, Tel Aviv University, Tel Aviv, Israel, 2Aix Marseille Univ, CNRS, CRMBM, Marseille, France, 3Center for Advanced Imaging Innovation and Research, New York University, New York, NY, United States, 4Sagol School of Neuroscience, Tel Aviv University, Tel Aviv, Israel
Synopsis
T2 relaxation is an effective biomarker for muscle pathology including inflammation, necrosis, or fatty infiltration. Accurate quantification of T2 values, however, is hampered due to the inherent bias of rapid multi-SE protocols by stimulated echoes. Recently, we introduced the echo modulation curve (EMC) algorithm, which successfully overcomes this problem and provide accurate T2 values that are stable across scanners and scan-settings. In this work, we present extension of the EMC algorithm for two component fitting, water and fat, allowing to quantify the sub-voxel infiltration of fat into the muscle, along with the corresponding T2 value of each component.
Introduction
MRI T2 relaxation time is a highly efficient biomarker of muscle health, being sensitive to both macro- and microstructural changes in muscle tissues. These can be caused by various muscle dystrophies, inflammatory processes, or neuromuscular disorders1,2. One of the hallmarks of peripheral muscle disorders is the infiltration of subcutaneous fat and a corresponding loss of muscle volume – causing a mixture of two T2 components to appear in each imaged voxel. A prerequisite of probing these components is to achieve reliable quantification of single-T2 values – a task that is severely challenged in clinical setting due to the contamination of Multi Spin-Echo (MSE) protocols by stimulated and indirect echoes3. These cause the MSE signal to deviate from a theoretical exponential decay pattern, and instead follow a more generalized echo modulation curve (EMC), which is moreover, not constant across different T2 values, protocol implementations, and the scan parameters. As a result, T2 values for the same subject vary between scanners and scan settings, thereby preventing the adoption of quantitative T2 as a biomarker for muscle health.
A recently introduced method, the EMC algorithm4,5, can overcome these limitations and deliver accurate and reliable maps of the true tissue T2 values in a manner that is independent of the scanner and protocol-implementation6. In this work, we present an extension of the EMC algorithm for two-component fitting, simultaneously estimating fat and water fractions within a single voxel, along with the T2 and Proton density values corresponding to each component. The extended framework allows to quantify the infiltration of fat into the muscle tissue, while at the same time probing changes in muscle T2 values (i.e., the water component), indicative of underlying inflammatory processes7.
Methods
Data acquisition: the calf muscle of a healthy volunteer was scanned on whole-body 3 T scanners (Siemens Prisma) using a standard MSE protocol. Scan parameters: TR/TE=3000/30 ms, NEchoes=30, res=0.8x0.8 mm2; slice thickness=5 mm; Tacq=4:26 min; acceleration=2x GRAPPA.
EMC algorithm: Bloch simulations of the MSE protocol were performed using the exact scan parameters. Simulations were repeated for a range of T2 and B1+ values (T2=1…1000 ms, B1+ = 70…130 % of nominal value), producing a database of EMCs, each associated with a unique [B1+,T2] value pair (DBWater). A similar DB was created for the fat signal by repeating this process at 3.7 ppm off-resonance (DBFat).
Processing: Water T2, fat T2, and water fraction (fWATER) maps were generated on a pixel-by-pixel basis by matching the experimental MSE time-series to simulated EMCs, calculated as the weighted sum of two decay curves: EMCEXPRIMENT = fW x EMCWATER + (1-fW) x EMCFAT. Matching was done via l2-norm minimization of the difference between experimental and theoretical EMCs over the range of simulated [T2W,T2F,B1+,fW] values.
Results
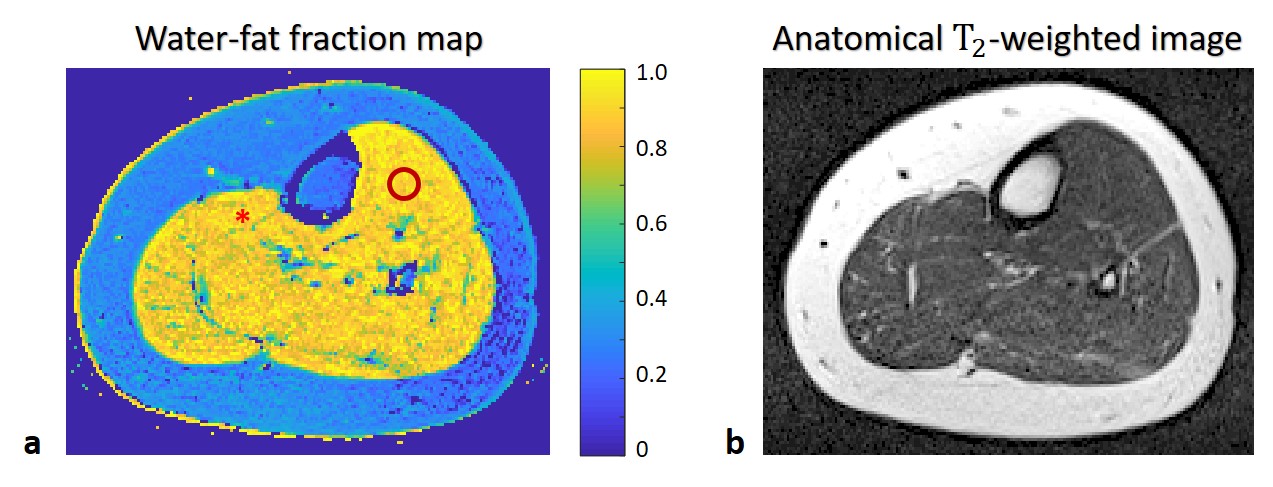
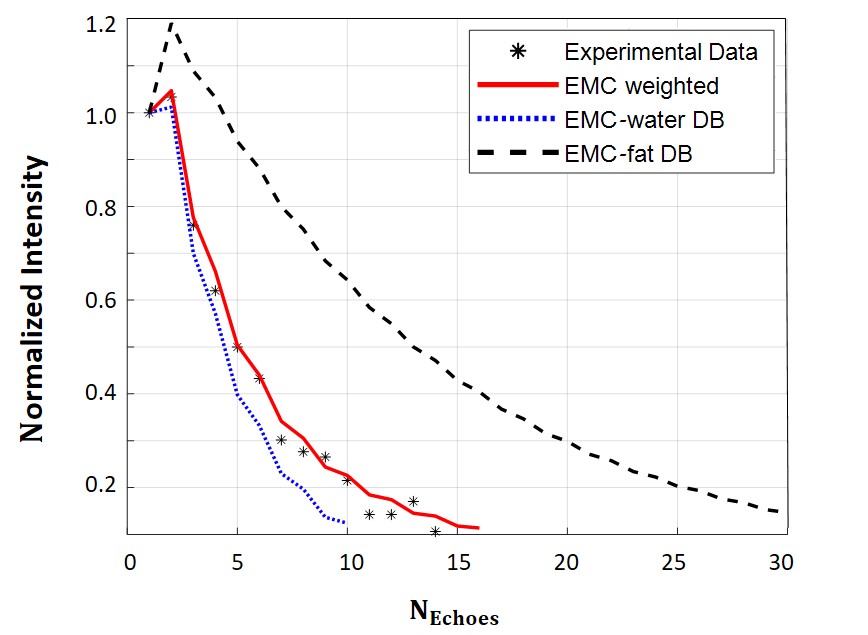
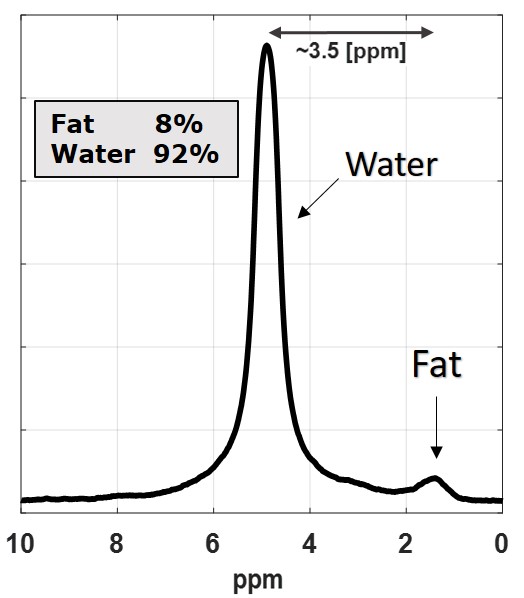
Fig. 1 presents EMC fitted quantitative water-fat fraction map, alongside anatomical T2-weighted image of the scanned calf muscle. Average water fraction within muscle region-of-interest (ROI) was 0.90 ± 0.06. Average water and fat T2 values were 27.0 ± 6.7 ms and 122.5 ± 33.1 ms respectively, matching values reported in literature7. An example of EMC two component matching is presented in Fig. 2 demonstrating the excellent agreement between experimental and fitted mixture of fat and water echo modulation curves for the pixel within muscle tissue (pixel is marked with an asterisk in Fig. 1). Lastly, we show in Fig. 3 spectroscopic validations of the fat and water fractions in the muscle tissue, estimated for the circular ROI shown in Fig. 1.Discussion and Conclusions
The existence of two decaying T2 components can hamper the clinical usability of quantitative T2 mapping in muscle tissues. Using an extension of the EMC algorithm we were able to quantify the relative fraction (i.e., proton density) of each of these components (i.e., their proton density), as well as their corresponding T2 values. This ability thus allows to separately track changes in the water and in the fat components, and has the potential to improve the diagnosis of pathologies in muscle and various other body organs. Another appealing feature of this approach is that it employs standard MSE protocol scheme, making it readily available on any clinical or animal scanners.Acknowledgements
ISF Grant 2009/17; Dr’s Ben-Eliezer and Bendahan are shared senior authors.References
[1] Eugenio Mercuri, Anna Pichiecchio, Joanna Allsop, Sonia Messina, Marika Pane, Francesco Muntoni. Muscle MRI in Inherited Neuromuscular Disorders: Past, Present, and Future. . J Magn Reson Imag 25:433–440 (2007).
[2] Monika Gloor, Susanne Fasler, Arne Fischmann, Tanja Haas, Oliver Bieri, Karl Heinimann, Stephan G. Wetzel, Klaus Scheffler, and Dirk Fischer. Quantification of Fat Infiltration in Oculopharyngeal Muscular Dystrophy: Comparison of Three MR Imaging Methods. J Magn Reson Imag 33:203–210 (2011).
[3] Hennig J. Multiecho imaging sequences with low refocusing flip angles. J Magn Reson 1988;78:397–407.
[4] Ben-Eliezer N, Sodickson DK, and Block KT. Rapid and accurate T2 mapping from multi-spin-echo data using Bloch-simulation-based reconstruction. Magn Reson Med 2015; 73(2): 809-17.
[5] Ben-Eliezer N, Sodickson DK, Shepherd T, Wiggins GC, Block KT. Accelerated and motion robust in vivo T2 mapping from radially undersampled data using Bloch-simulation-based iterative reconstruction. Magn Reson Med 2016; 75(3): 1346-54.
[6] Shepherd TM, Kirov I, Charlson E, Bruno M, Babb J, Sodickson DK, Ben-Eliezer N. "New rapid, accurate T2 quantification detects pathology in normal-appearing brain regions of relapsing-remitting MS patients." NeuroImage: Clinical 14 (2017): 363-370.
[7] Benjamin M, Pierre-Yves B, Harmen R, Noura A, Ericky AA, Pierre GC, Paulo L de Sousa. Simultaneous muscle water T2 and fat fraction mapping using transverse relaxometry with stimulated echo compensation. NMR in Biomed, 29 (4): 431–443
[8] M. Barany, P.N. Venkatasubramanian, E. Mok, I.M. Siegel, E. Abraham, N.D. Wycliffe, M.F. Mafee. Quantitative and Qualitative Fat Analysis in Human Leg Muscle of Neuromuscular Diseases by IH MR Spectroscopy in Vivo. MAGNETIC RESONANCE IN MEDICINE 10,210-226 (1989).
Figures