2249
Low power Z-spectrum analysis for isolated NOE and amide CEST-MRI at 3T with comparison to 9.4T1High-Field Magnetic Resonance, Max Planck Institute for Biological Cybernetics, Tuebingen, Germany, 2Diagnostic & Interventional Neuroradiology, University Hospital Tuebingen, Tuebingen, Germany, 3Center for Biomedical Imaging, New York University Langone Health, New York, NY, United States
Synopsis
A snapCEST sequence was optimized for imaging of protein CEST effects at 3T with low saturation power. Full Z-spectrum sampling allows Lorentzian fitting of amide, NOE, semisolid MT, and water pools. Validation against data acquired at 9.4T demonstrates effective labeling of selective amide and NOE CEST effects at 3T. Data acquired in a brain tumor patients demonstrates clinical feasibility.
Purpose
The present study focuses on separation of selective CEST effects of amides (3.5 ppm) and Nuclear-Overhauser-mediated saturation transfer (NOE, -3.5 ppm) in the human brain for investigation as potential tumor markers. The high spectral separation of 9.4T data forms a reference for selective CEST effects. We aim to demonstrate that low power saturation and high offset sampling enables selective CEST imaging at 3T.Methods
CEST contrast was acquired with snapCEST1, a centric reordered gradient-echo sequence (3D coverage, 1.7x1.7x3mm resolution, 18 slices, GRAPPA=2, acquisition time 6 min35sec) at B0=3T. Presaturation (4s) consisted of 100 Gaussian inversion pulses (tp=20.48ms, td=20ms, B1=0.6µT) applied at 54 offsets from –100ppm to 100ppm with adaptive sampling (higher between +/- 10ppm). Protein CEST data were acquired at 3T in 4 healthy subjects (Siemens Prisma, 64 channel head coil) and in 2 brain tumor patients (Siemens Verio PET/MR, 18 channel head coil). Reference data was acquired for one healthy subject with snapshot CEST (3D coverage, 1.5x1.5x2mm resolution, 16 slices, GRAPPA=3) at B0=9.4T (Siemens Healthcare, Erlangen, Germany). Presaturation (4.5s) consisted of 150 Gaussian pulses (tp=15ms, td=15ms, B1=0.5, 0.8, and 1.2µT, reconstructed at 0.6µT after B1 correction2) applied at 95 offsets (–50 to 50ppm with higher sampling between -2 and +5ppm).
CEST images measured in the same subject at 3T and 9.4T were resampled to the same resolution & co-registered for comparison. Data were corrected for B0 inhomogeneities in all subjects3,4. De-noised 3T Z-spectra were fitted pixel-wise with a 4-pool Lorentzian model2 of background signal, direct water saturation, semisolid magnetization transfer (MT), amide (APT), and NOE pools. CEST contrast is quantified in Lorentzian difference maps. Reference maps were generated from 9.4T raw Z-spectra with a 6-pool Lorentzian model.
Results
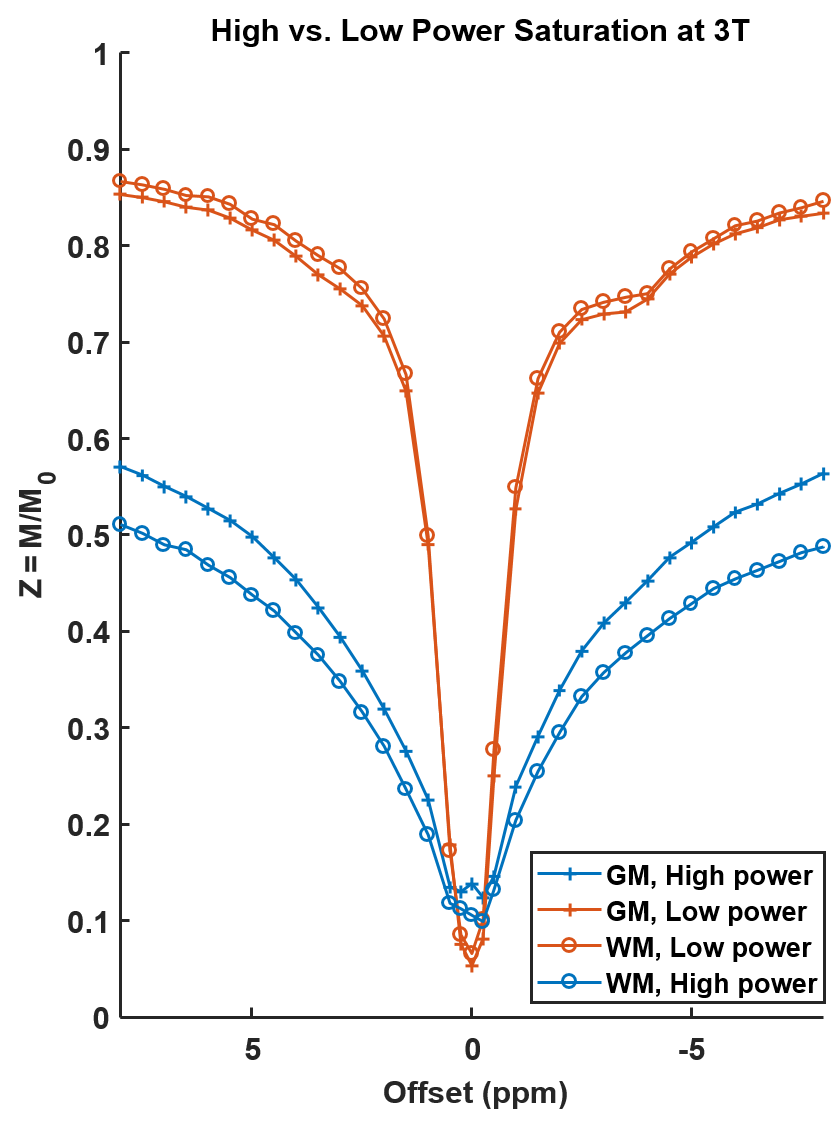
Figure 1 shows Z-spectra acquired at 3T in the human brain for different saturation parameters. With the typical high power saturation no selective effects are visible. By reducing the power and using 180° pulses, selective NOE and APT resonance can be isolated at 3T.
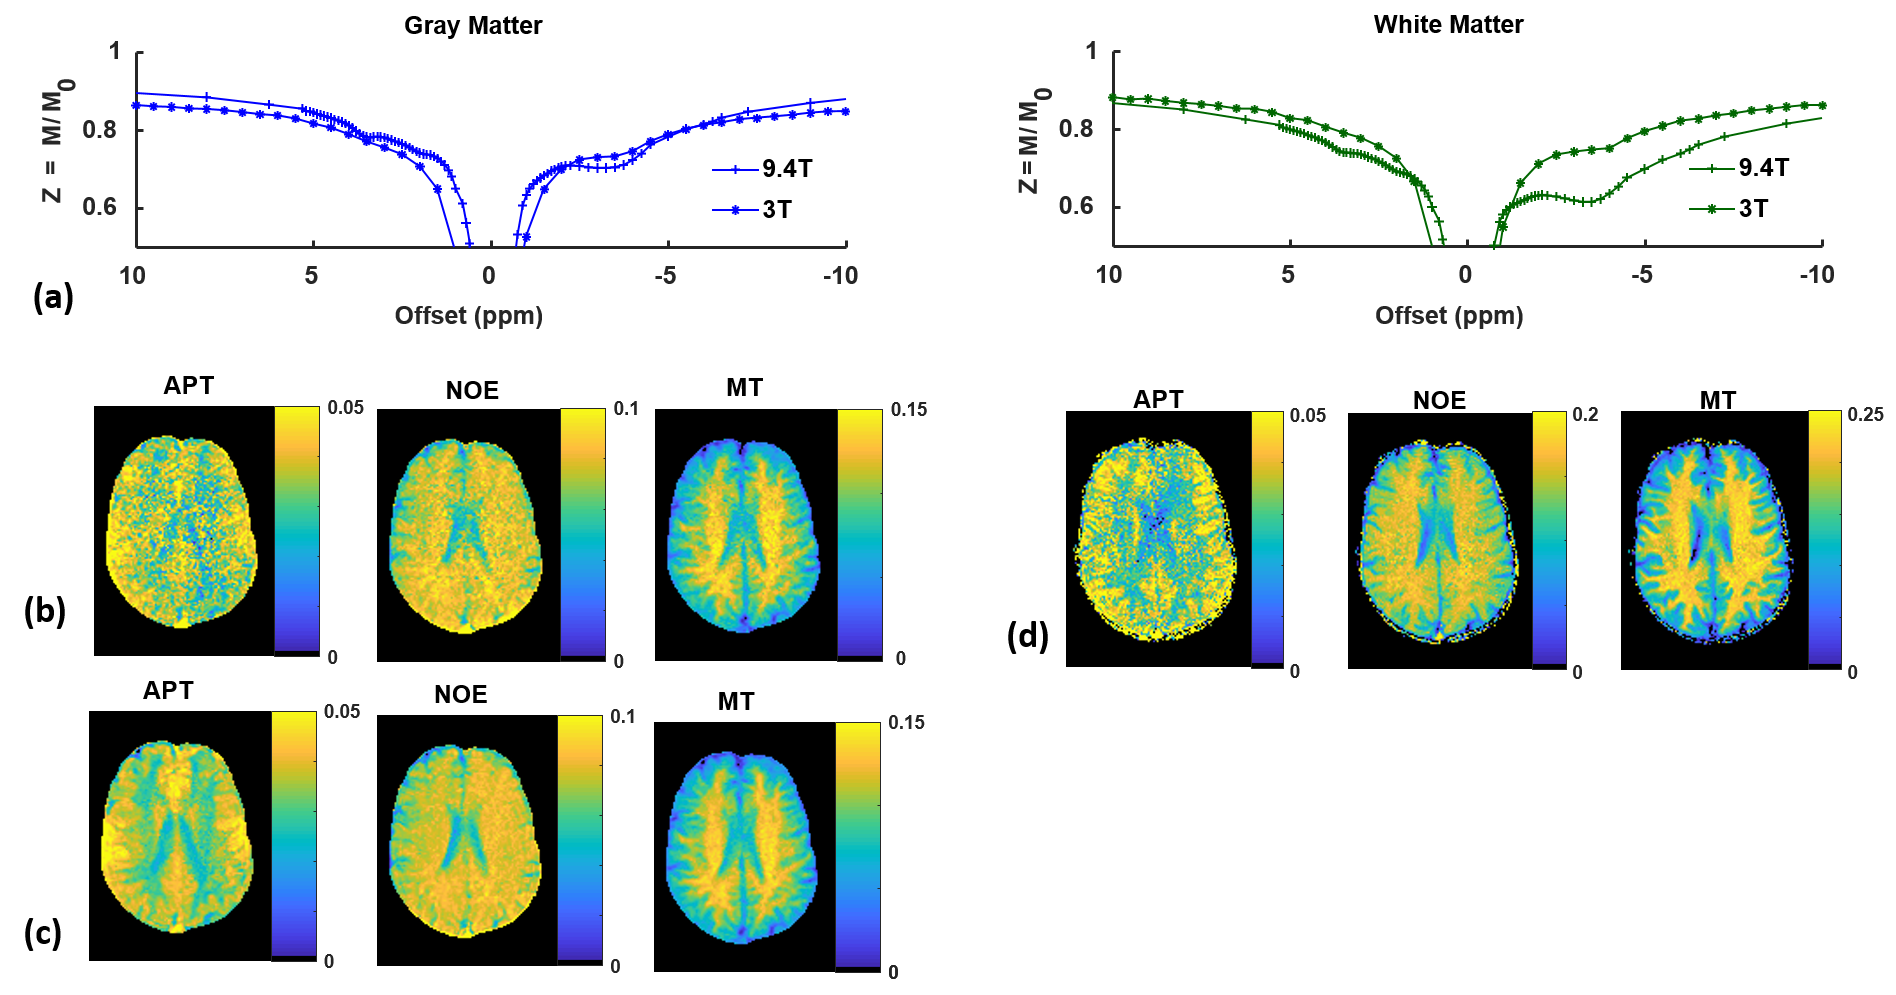
Figure 2 shows that raw Z-spectra measured with low-power saturation in gray matter and white matter at 3T exhibit NOE and APT features with broadened lineshapes and smaller effects compared to those measured at 9.4T in the same subject. Denoising the Z-spectra prior to 4-pool Lorentzian fitting reduces noise and improves GM/WM contrast in APT, NOE, and MT Lorentzian difference maps.
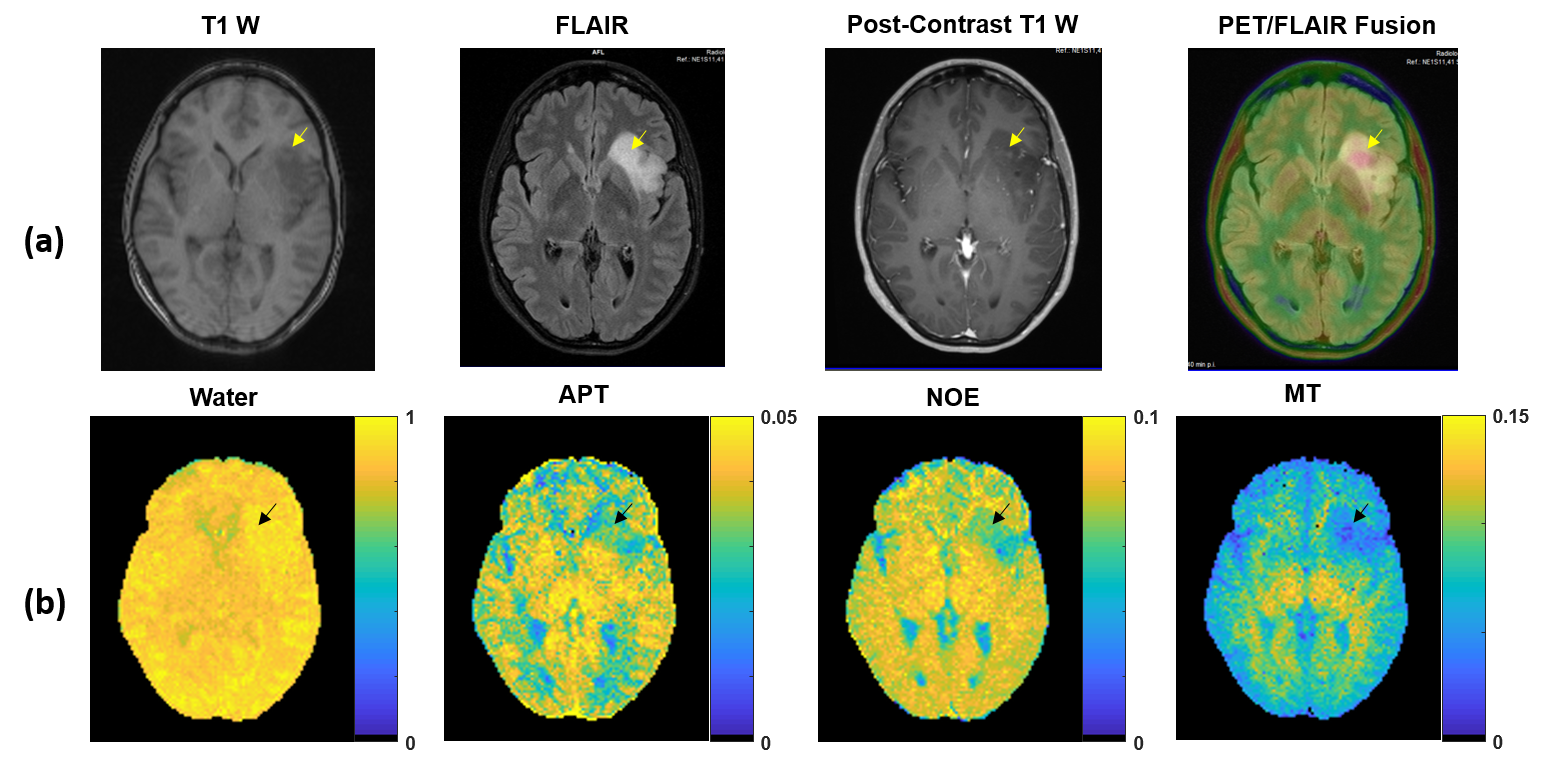
Figure 3(a) shows clinically acquired FLAIR, T1-weighted pre- and post-contrast, and PET/FLAIR fusion images of a patient with suspected low-grade glioma. The tumor shows no enhancement but a core-like region with reduced T1-weighted signal and increased metabolic activity. Quantitative Lorentzian difference maps resulting from 4-pool fitting of low-power protein CEST data (Figure 3b) show typical CEST contrast in normal appearing white matter and cortical/subcortical gray matter, with the tumor region exhibiting reduced MT and NOE effects and increased amide CEST effects (arrows).
Discussion
Protein CEST imaging is of interest in brain tumors due to its sensitivity to pH and potential to elucidate molecular-level irregularities of the tumor microenvironment5. APT-weighted image contrast is generated by examining asymmetry of the Z-spectrum. However typical APT experiments use high power pulses, and the resulting image contrast includes concomitant effects of saturated relayed NOEs and semisolid macromolecules. These effects can be separated using a low-power saturation scheme, which allows for separation and modeling of amide and NOE effects6, and it has been shown that the downfield amide proton signal is sensitive to pH, while the upfield NOE signal is pH-insensitive7 and may be related to protein folding in brain tumors8.
Compared to ultra-high field (UHF) studies at 7T or 9.4T, CEST effects are smaller and broader at 3T. The high-power approach used in APT studies provides more saturation and robust contrast. Low-power approaches generate small signals, but the amide and NOE signals are aggregated across broader lineshapes. De-noising of Z-spectra can improve the robustness of modelling of small amplitude CEST pools at 3T, resulting in adequate signal from amides and NOEs which are altered in the presence of pathology. While APT and NOE signals could be isolated at 3T with similar contrast as found at 9.4T, the 2ppm resonance associated with creatine and proteins and the -1.7ppm signal apparent in 9.4T data could not be distinguished at 3T. For selective detection of these effects, UHF may be inevitable. Next steps at 3T include correction for relaxation effects9.
Conclusion
Selective CEST imaging of NOE and APT effects is feasible using the snapCEST sequence at 3T, enabling full Z-spectrum sampling with volumetric coverage in a clinical setting. Resonances near water can only be separated at ultra-high field strengths.Acknowledgements
The financial support of the Max Planck Society, German Research Foundation (DFG, grant ZA 814/2-1, support to M.Z.), and European Union’s Horizon 2020 Research and Innovation program (Grant Agreement No. 667510, support to M.Z.) is gratefully acknowledged.References
- Zaiss et al. “snapCEST – A single-shot 3D CEST sequence for motion corrected CEST MRI.” Proc. ISMRM 2017, p. 3768.
- Windschuh et al. “Correction of B1-inhomogeneities for relaxation-compensated CEST imaging at 7T.” NMR in Biomed 2015; 28:529-537.
- Kim et al. “Water saturation shift referencing (WASSR) for chemical exchange saturation transfer (CEST) experiments.” Mag Reson Med 2009; 61:1441-1450.
- Schuenke et al. “Simultaneous mapping of water shift and B1 (WASABI)-Application to field-Inhomogeneity correction of CEST-MRI data.” Mag Reson Med 2017; 77:571-580.
- Zhou et al. “Using the amide proton signals of intracellular proteins and peptides to detect pH effects in MRI.” Nat Med 2003; 9:1085-1090.
- Jones et al. “Nuclear Overhauser enhancement (NOE) imaging in the human brain at 7T.” NeuroImage 2013; 77:114-124.
- Jin et al. “MR imaging of the amide-proton transfer effect and the pH-insensitive nuclear overhauser effect at 9.4T.” Mag Reson Med 2013; 69:760-770.
- Zaiss et al. “MR imaging of protein folding in vitro employing Nuclear-Overhauser-mediated saturation transfer.” NMR in Biomed 2013; 26:1815-1822.
- Zaiss et al. “Relaxation-compensated CEST-MRI of the human brain at 7T: Unbiased insight into NOE and amide signal changes in human glioblastoma” NeuroImage 2015; 112:180-188.
Figures