2248
High-resolution total Creatine mapping of the mouse brain at 11.7T using CEST1Department of Radiology and Radiological Science, Johns Hopkins University, Baltimore, MD, United States, 2F.M. Kirby Research Center for Functional Brain Imaging, Kennedy Krieger Research Institute, Baltimore, MD, United States, 3Department of Electronic Science, Xiamen University, Xiamen, China
Synopsis
A combined polynomial and Lorentzian Fitting (PLOF) scheme was developed to map total creatine (tCr) signal using a CW-CEST sequence under short saturation time situation. At 11.7T, the guanidinium proton signals of tCr and tissue proteins are not coalesced with the water signal and the line-shape fitting procedure can correct the direct saturation and magnetization transfer contrast introduced spill-over effects, allowing the guanidinium CEST signal to be extracted and subsequently quantified. A series of Cr phantom and mouse brain studies with different saturation times and powers were carried out to determine the optimal parameters for protein-signal corrected creatine CEST quantification.
Introduction
CEST MRI has shown great success in enhancing the MR sensitivity of dilute metabolites(1-4). However, the quantification of single metabolites remains challenging due to the saturation transfer signals from other metabolites and proteins (5, 6) or coalescence of signals with the water signal in the saturation spectrum (Z-spectrum). At high field, the guanidinium protons of the creatine (Cr), phosphate creatine (PCr) and tissue proteins form a well-defined peak at 1.95 ppm in the Z-spectrum (7, 8), the intensity and frequency of which are not straightforward to determine due to the occurrence of spill-over effects from direct water saturation (DS), magnetization transfer contrast (MTC) and the presence of other CEST signals. In this study, a recently published combined polynomial and Lorentzian Fitting (PLOF) scheme (8) was extended to short saturation time situation to yield a better total creatine (tCr) mapping.Methods
The normalized CEST saturation signal Z is given by (9-12):
$$Z\left(R_{1\rho}\right)=\left(1-Z^{ss}\right)e^{-R_{1\rho}\space t_{sat}}+Z^{ss} \quad\quad \text{(1)}$$
where $$$Z^{ss}$$$ is the steady state Z-spectrum, $$$R_{1\rho}$$$is the water relaxation time under RF saturation(9). For the two-pool model used in the current study, the observed CEST signal $$$(\triangle Z)$$$ is given by:
$$\triangle Z=Z\left(R_{back}\right)-Z\left(R_{back}+R_{guan}\right) \quad\quad \text{(2)}$$
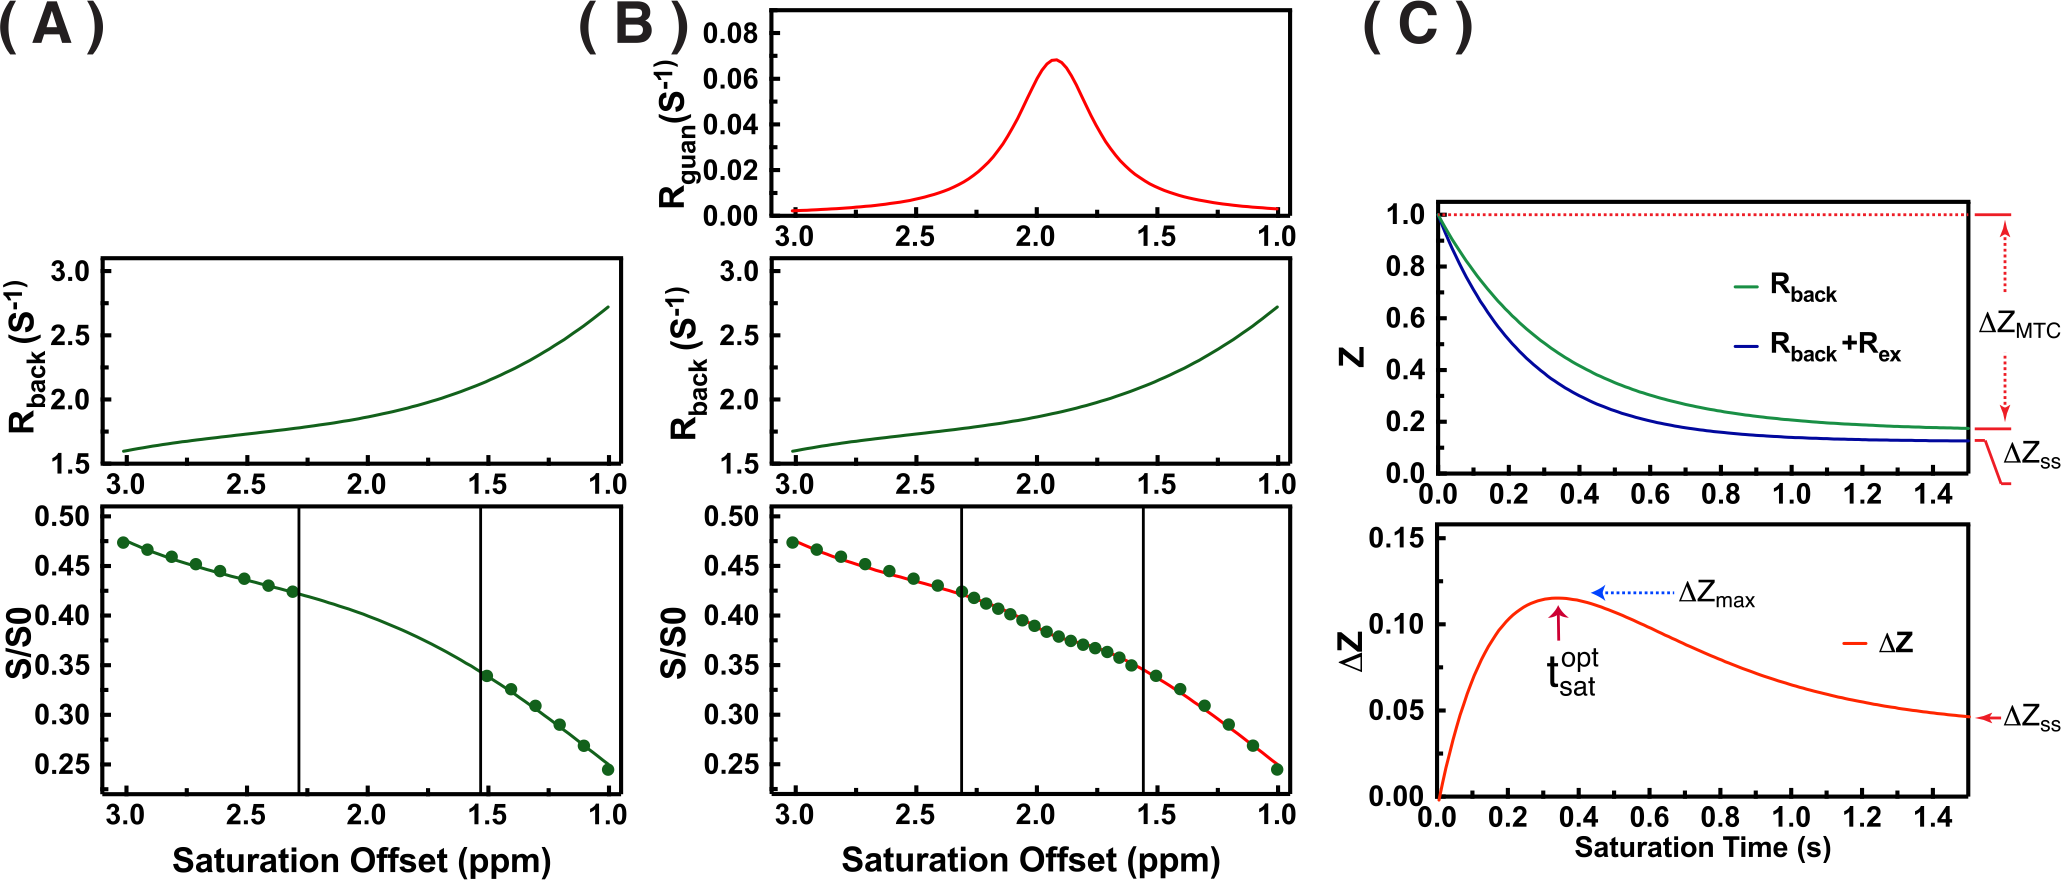
The modified PLOF method is illustrated in Figs. 1A,B, and can be described by the following equations (8):
$$R_{guan}=R_{guan}^{max}\frac{\left(w/2\right)^2}{\left(w/2\right)^2+\left(\triangle-\triangle_{guan}\right)^2}\quad\quad \text{(3)}$$
$$R_{back}=C_0+C_1\left(\triangle-\triangle_{guan}\right)+C_2\left(\triangle-\triangle_{guan}\right)^2+C_3\left(\triangle-\triangle_{guan}\right)^3\quad\quad \text{(4)}$$
where $$$w$$$ is the peak full-width-at-half-maximum of the Lorentzian line-shape in ppm. $$$R_{guan}^{max}$$$ is the true apparent relaxation rate contribution of the guanidinium protons. $$$\triangle_{guan}$$$ is the chemical shift of the guanidinium peak; $$$C_0$$$ to $$$C_3$$$ terms are the zero to third-order polynomial coefficients. Notice, here the $$$R_{back}$$$ was used to fit the Z-spectrum instead of $$$Z_{back}$$$ since the original fitting method (8) is not suitable for the CEST at short saturation time. Also, a third order polynomial fitting was sufficient for the background signal at this short time.
All MR experiments were performed using a 11.7 T Bruker Biospec system. A CW-CEST sequence with RARE readout was used for the CEST MRI. Solutions of Cr, PCr with 5% cross-linked BSA, Cr with 10% cross-linked BSA and Cr with 20% cross-linked BSA (pH 7.3, temperature 37 oC) were used for the phantom experiments. All Cr and PCr concentrations were 50 mM. The phantom experiments were performed using a 23mm volume coil. In vivo experiments with volume coil transmit and a 2x2 phased array cryoprobe for receiving. Three adult female BALB/c mice were used.
Results and Discussion
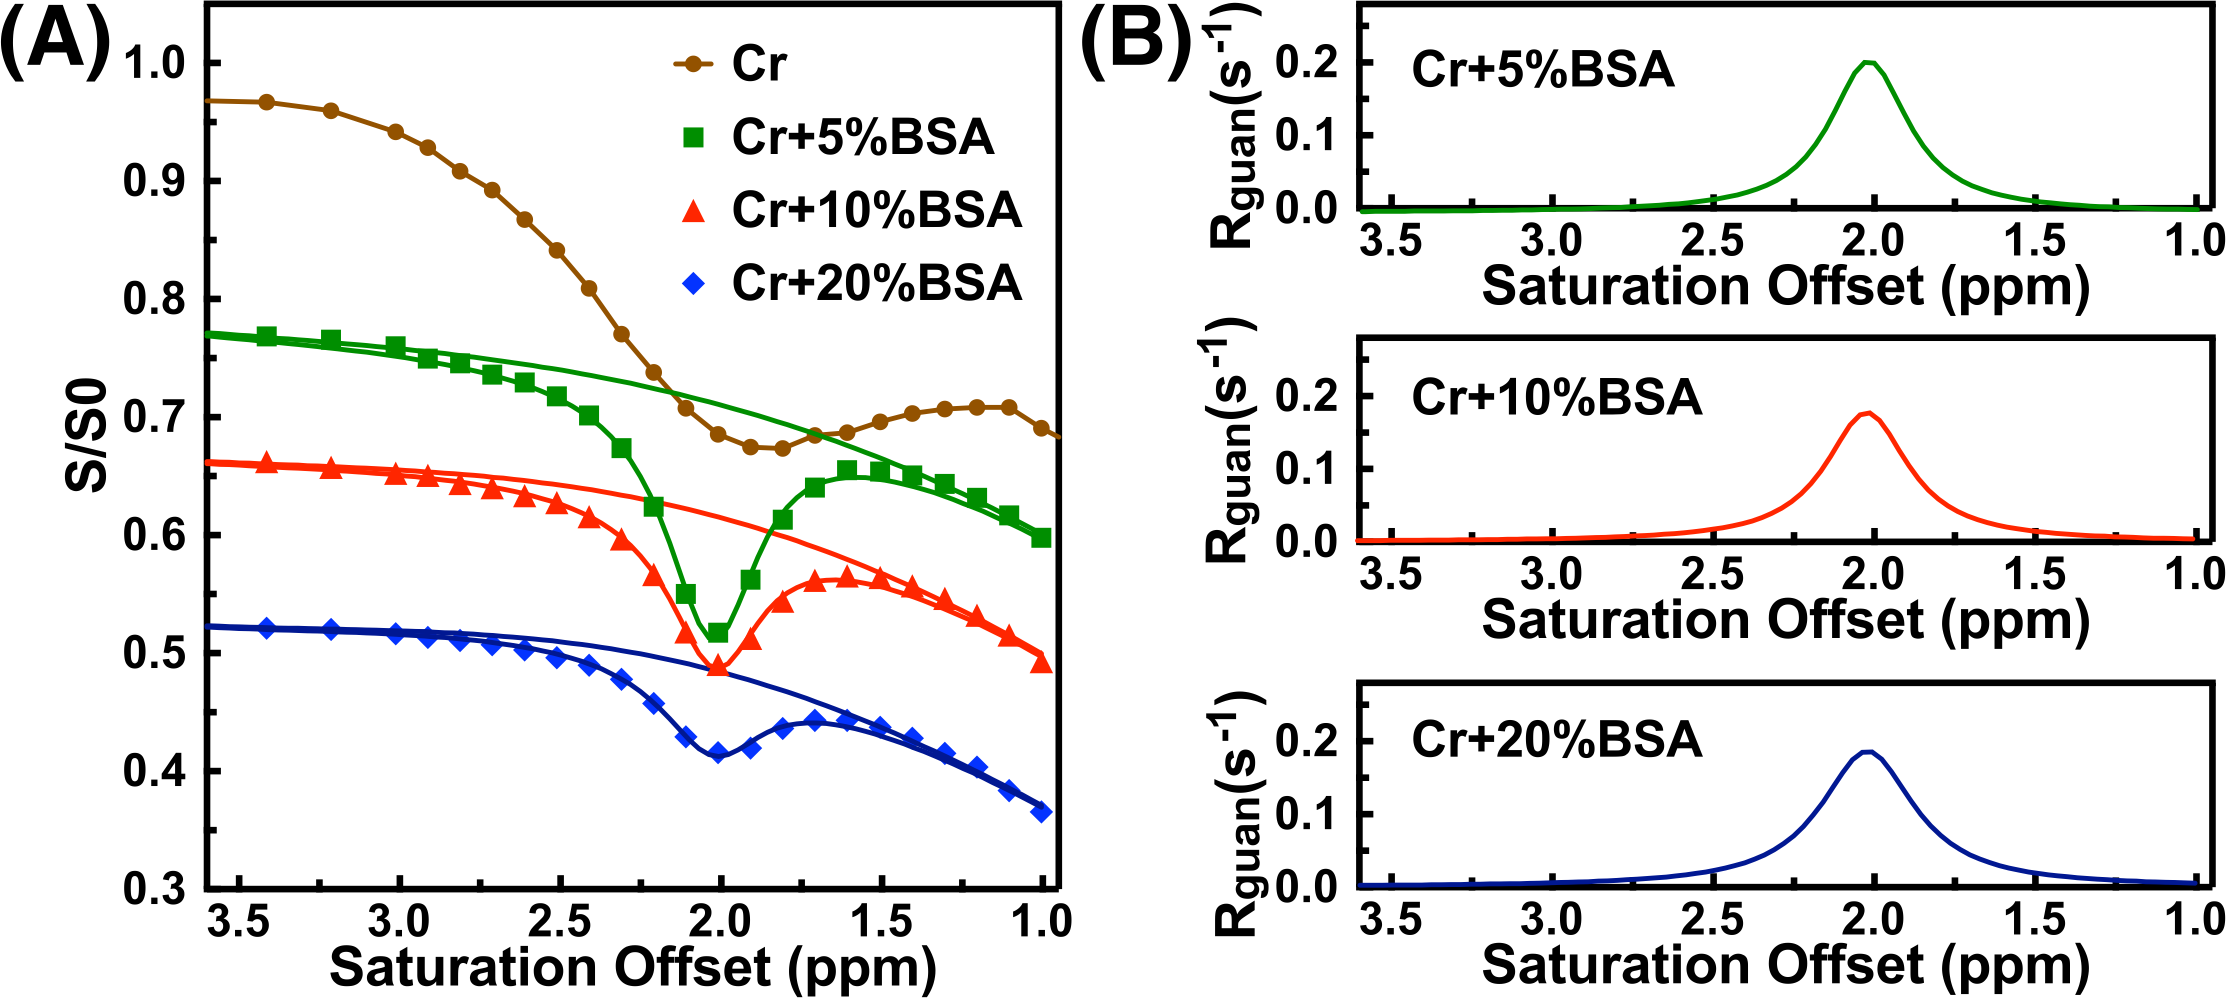
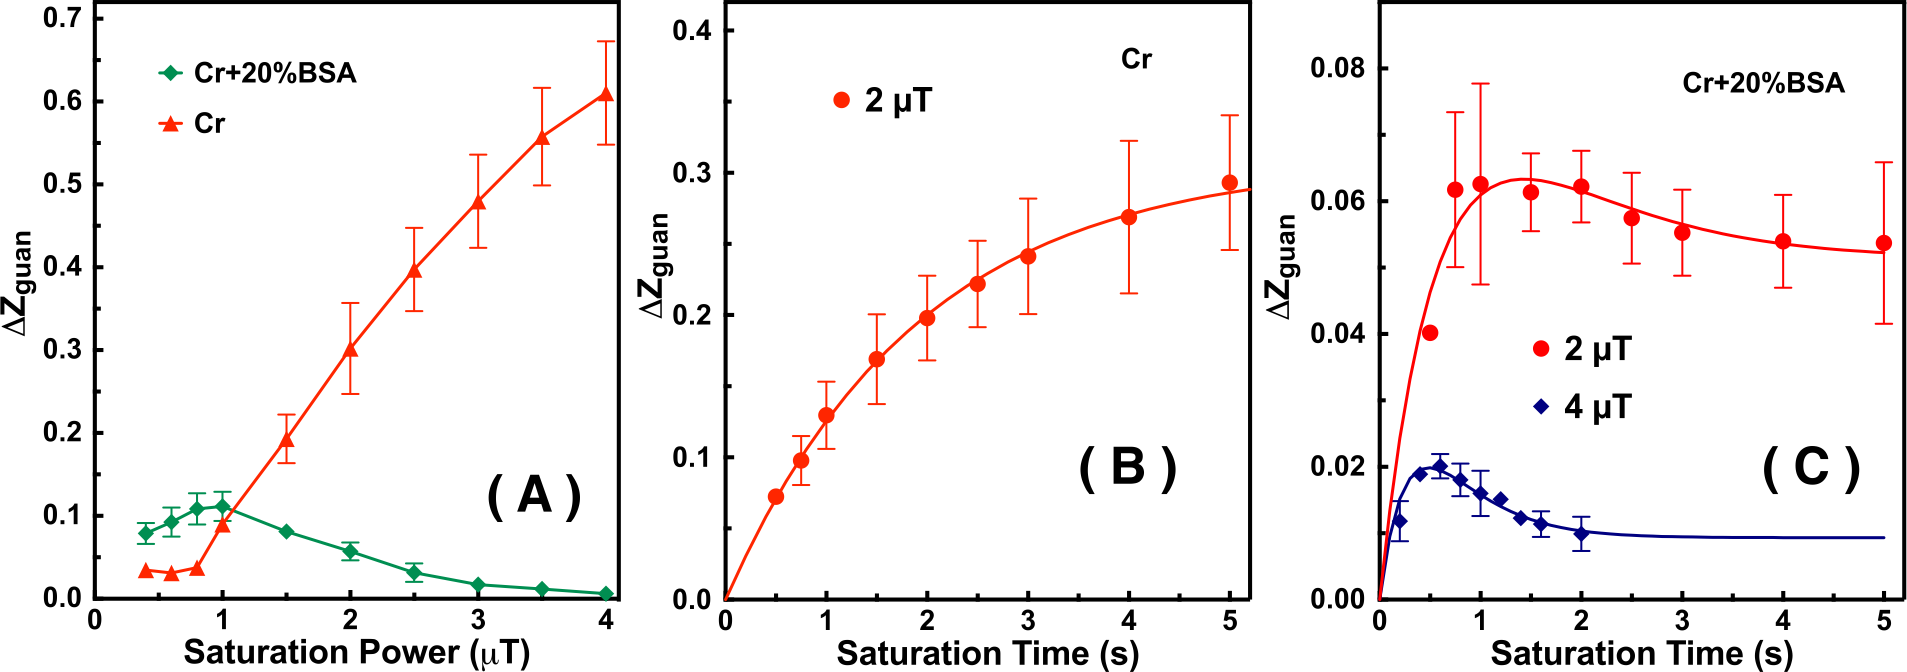
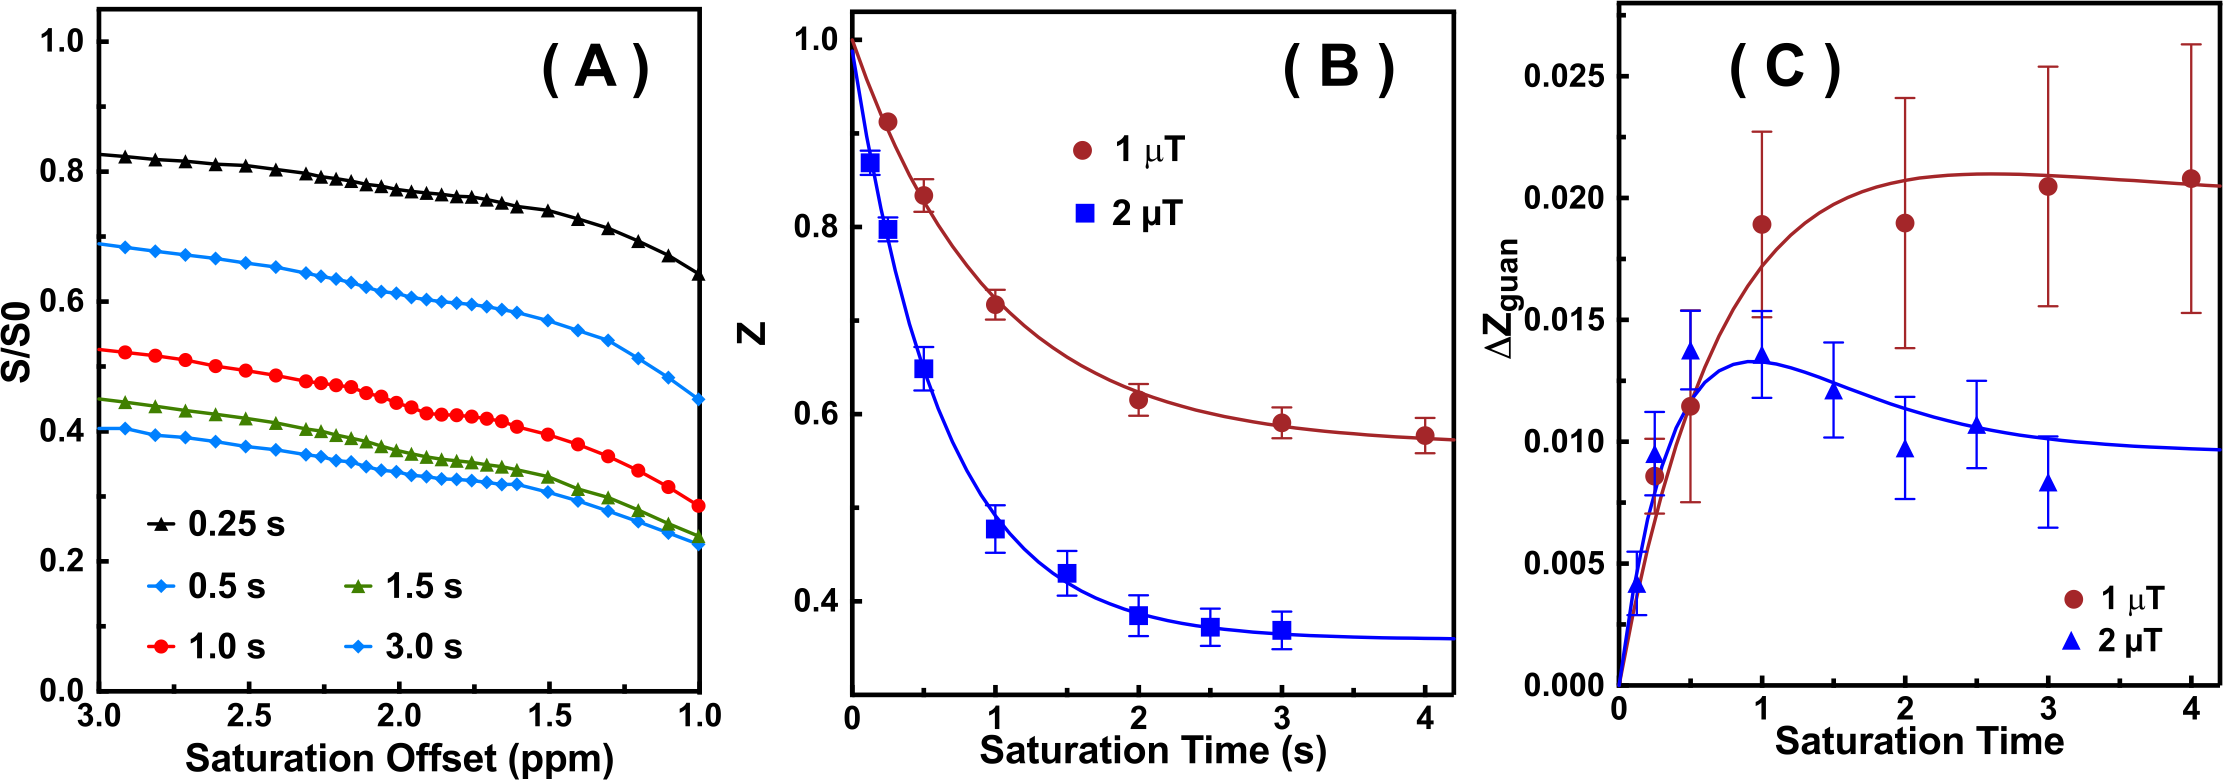
The saturation time dependence of the CEST signal at 1.95 ppm ($$$Z$$$) and difference signal ($$$\triangle Z$$$) are simulated in Fig. 1A. The maximum CEST signal is obtained at a saturation time much shorter than the typical CEST experiments. In Fig. 2A, Z-spectra of Cr mixed with different concentrations of cross-linked BSA are shown. The observed apparent Cr CEST signal difference ($$$\triangle Z$$$) is affected significantly by the MTC and DS backgrounds. On the contrary, the $$$R_{guan}$$$ obtained by the PLOF method shows satisfactory robustness against MTC spill-over effect and DS (Fig. 2B). In Fig. 3, the Cr CEST signals are plotted as a function of saturation length and power for the Cr solution and Cr with 20% cross-linked BSA. The saturation power dependent $$$\triangle Z_{guan}$$$ of mouse brain has been reported previously (8), showing a pattern similar to the Cr+20%BSA phantom (Fig. 3A). The results suggest that, at this field strength, a relatively low saturation power (around 1 μT) is preferred for Cr CEST in the presence of strong MTC (20% Cross-linked BSA) (Fig. 3A). The optimal saturation length for the Cr+20%BSA phantom is also much shorter than that for a Cr solution (Figs. 3B&C), particularly at high saturation powers, which is in agreement with the simulation results (Fig. 1A).In Fig. 4, the saturation signal $$$Z$$$ and the guanidinium signal $$$\triangle Z_{guan}$$$ in mouse brain are shown as a function of saturation length. With the strong MTC interference in vivo, the $$$\triangle Z_{guan}$$$ dependence on saturation time is similar to the phantom study in Fig. 3C and the theoretical simulation (Fig. 1C). The maximum CEST signal $$$\triangle Z_{guan}$$$ is obtained with a saturation length of around 1 s at a saturation power of 2 μT. Using the recentlly established tCr concentration calibration from MRS (8), the tCr map can be obtained from $$$R_{guan}^{max}$$$by:
$$R_{guan}^{max}\cdot\lambda=r_{tCr}\cdot[tCr]\quad\quad \text{(5)}$$
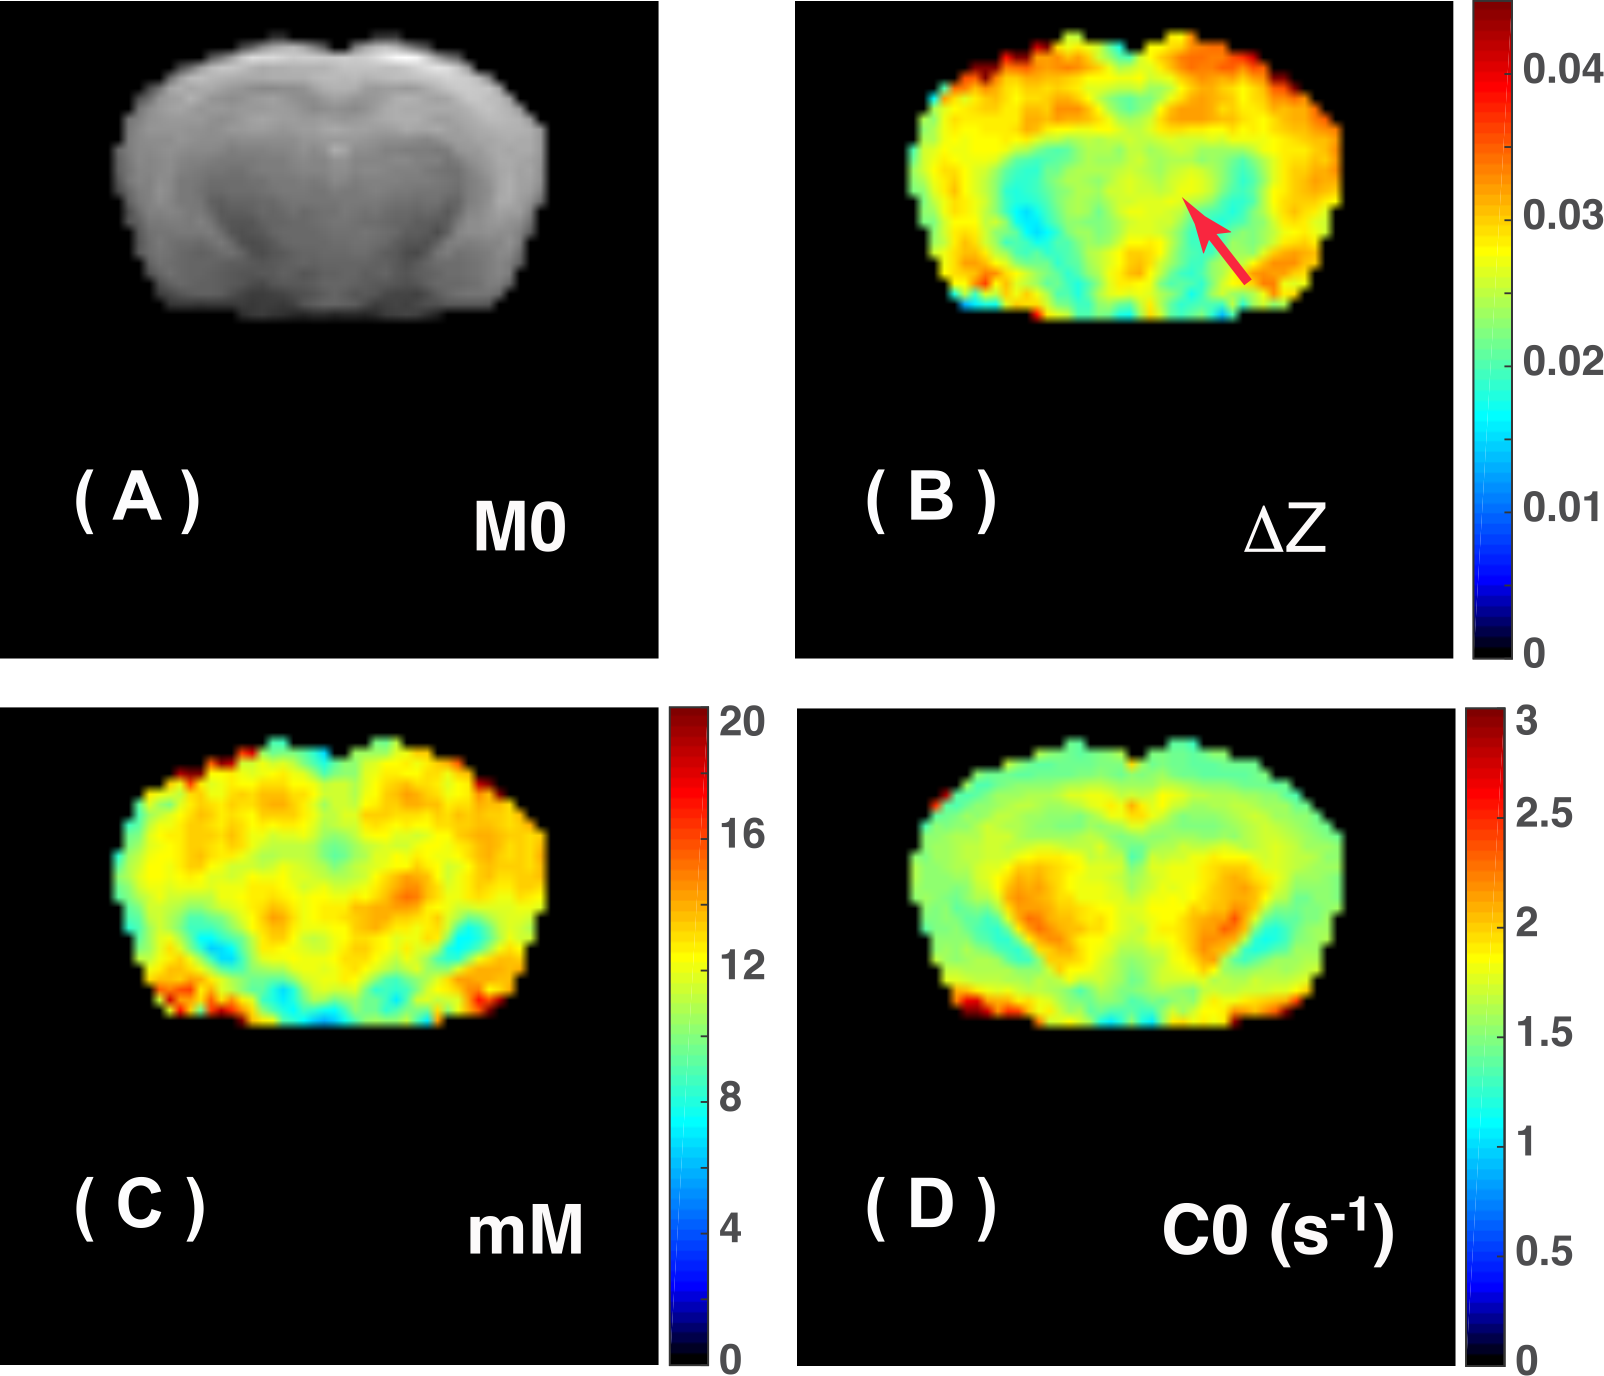
where $$$\lambda=0.8$$$ is tCr fraction for guanidinium in tissue, and $$$r_{tCr}=6.2\times10^{-3}\space s^{-1}mM^{-1}$$$. The final tCr map is shown in Fig.5.
Conclusion
High-resolution tCr map on mouse brain can be achieved by the PLOF method for CEST analysis at 11.7T and using a cryoprobe.Acknowledgements
This work was supported by NIH R01EB015032, P41EB015909, R01EB019934, R01HL63030 and NNSFC 11775184.References
1. van Zijl PCM, Yadav NN. Chemical exchange saturation transfer (CEST): What is in a name and what isn't? Magn Reson Med. 2011; 65(4):927-48. doi:10.1002/mrm.22761
2. Sherry AD, Woods M. Chemical Exchange Saturation Transfer Contrast Agents for Magnetic Resonance Imaging. Annual Review of Biomedical Engineering. 2008; 10(1):391-411. doi:10.1146/annurev.bioeng.9.060906.151929
3. Liu G, Song X, Chan KW, et al. Nuts and bolts of chemical exchange saturation transfer MRI. NMR Biomed. 2013; 26(7):810-28. doi:10.1002/nbm.2899
4. Jones KM, Pollard AC, Pagel MD. Clinical applications of chemical exchange saturation transfer (CEST) MRI. J Magn Reson Imaging. 2017. doi:10.1002/jmri.25838
5. van Zijl PCM, Sehgal AA. Proton Chemical Exchange Saturation Transfer (CEST) MRS and MRI. eMagRes. 2016; 5(2).doi: 10.1002/9780470034590.emrstm1482.
6. Haris M, Singh A, Cai K, et al. A technique for in vivo mapping of myocardial creatine kinase metabolism. Nat Med. 2014; 20(2):209-14. doi:10.1038/nm.3436
7. Zhang XY, Xie J, Wang F, et al. Assignment of the molecular origins of CEST signals at 2 ppm in rat brain. Magn Reson Med. 2017:10.1002/mrm.26802. doi:10.1002/mrm.26802
8. Chen L, Zeng H, Xu X, et al. Investigation of the contribution of total creatine to the CEST Z-spectrum of brain using a knockout mouse model. NMR Biomed. 2017. doi:10.1002/nbm.3834
9. Zaiss M, Bachert P. Chemical exchange saturation transfer (CEST) and MR Z-spectroscopy in vivo: a review of theoretical approaches and methods. Phys Med Biol. 2013; 58(22):R221-69. doi:10.1088/0031-9155/58/22/R221
10. Zaiss M, Bachert P. Exchange-dependent relaxation in the rotating frame for slow and intermediate exchange -- modeling off-resonant spin-lock and chemical exchange saturation transfer. NMR Biomed. 2013; 26(5):507-18. doi:10.1002/nbm.2887
11. Jin T, Autio J, Obata T, et al. Spin-locking versus chemical exchange saturation transfer MRI for investigating chemical exchange process between water and labile metabolite protons. Magn Reson Med. 2011; 65(5):1448-60. doi:10.1002/mrm.22721
12. Trott O, Palmer AG, 3rd. R1rho relaxation outside of the fast-exchange limit. J Magn Reson. 2002; 154(1):157-60. doi:10.1006/jmre.2001.2466
Figures