2247
gagCEST on patients with focal knee cartilage defectsMarkus M. Schreiner1,2, Vladimir Mlynarik2,3, Stefan Zbyn2,4, Vladimir Juras2, Pavol Szomolanyi2, Didier Laurent5, Celeste Scotti5, Harry Haber5, and Siegfried Trattnig2,3
1Department of Orthopedics, Medical University of Vienna, Vienna, Austria, 2High-Field MR Centre, Department of Biomedical Imaging and Image-Guided Therapy, Medical University of Vienna, Vienna, Austria, 3CD Laboratory for Clinical Molecular MR Imaging, Vienna, Austria, 4Research Unit of Medical Imaging, Physics and Technology, University of Oulu, Oulu, Finland, 5Novartis Institutes for Biomedical Research, Basel, Switzerland
Synopsis
The gagCEST technique is a promising tool for determining concentration of glycosaminoglycans in articular cartilage. In this study, the performance of gagCEST in a group of patients with ICRS grade I-II knee cartilage defects was investigated. It was found that the method gives significantly different mean MTRasym values for cartilage defects, normal weight-bearing and normal non-weight-bearing femoral cartilage. The clinical use of the gagCEST technique is currently limited by its long measurement time and sensitivity to patient motion.
Introduction
Evaluation of glycosaminoglycan (GAG) content in articular cartilage is a challenging task. Among potentially useful techniques, gagCEST is noninvasive and does not require special hardware or exogenous contrast. However, the gagCEST effect is relatively small and the measurement is extremely sensitive to motion.1 The aim of this study was to investigate the potential of the gagCEST technique for the assessment and monitoring of GAG content in knee cartilage of patients with femoral cartilage defects (ICRS grade I & II) over time of one year.Materials & Methods
Twenty-one patients (age range, 25-55 years, mean age, 46 years) with focal cartilage lesions and risk factors for progression (i.e., meniscal tear and ACL rupture) without surgical treatment were prospectively enrolled in this study. The gagCEST measurements were performed on a 7T Siemens Magnetom scanner using a 28-channel QED knee array coil at several time points (8, 85, 169 and 365+ days from the initial date of the study). For the gagCEST measurements, a prototype segmented 3D RF-spoiled gradient-echo (GRE) sequence was used with TE = 3.1 ms, TR = 7.9 ms, a field-of-view of 170 × 132 mm, a voxel size of 0.9 × 0.9 × 2.2 mm3, 30 slices, slice oversampling of 33 %, flip angle 9°, a GRAPPA accelerating factor of 2, 19 saturation offsets with a step of 92 Hz in the whole range of ±2.8 ppm from the water resonance, and a scan time of 19 min. The saturation pulse train consisted of ten 60-ms adiabatic full-passage hyperbolic secant (hs2) pulses with 20 ms interpulse delays, resulting in B1rms,sat= 0.5 μT and a shot TR of 1500 ms. Recent measurements were done using a saturation train of 6 hs2 pulses with 10 ms interpulse delays, 29 offsets in the same frequency range and a scan time of 23 min. The MTRasym values were obtained from the range of 0.5 to 2.0 ppm relative to the minimum of each individual Z-spectrum. Region-of-interest (ROI) analysis was performed in the defects (Def), in the weight-bearing (WB) femoral cartilage (a region in contact with tibia) and non-weight-bearing (NWB) femoral cartilage.Results
Fig. 1 shows the changes in mean MTRasym values in different cartilage regions over time. The mean MTRasym values were lower in defects than in normally appearing WB and NWB cartilage. Similarly, the mean MTRasym value was higher in WB cartilage than in NWB cartilage in all time points. No specific trend in MTRasym over time for any cartilage type was observed, except a minor increase in WB and NWB in the day 365+. Fig. 2 shows the mean values and standard deviations of MTRasym obtained in all time points in different cartilage regions. Although the standard deviation of the measurements were relatively large, the mean values in all regions were significantly different.Discussion and Conclusions
Stable MTRasym values over the period of one year indicate constant GAG content during the follow-up time of this study. The observed minor increase of MTRasym in WB and NWB cartilage in the last measurement was most likely due to a minor modification in the measurement protocol providing a more detailed sampling of Z-spectra. Apart from an inter-subject variability and a potential time evolution of the MTRasym values, the larger MTRasym variability in specific cartilage regions is due to random measurement errors. Thus, the results suggest that the gagCEST technique is suitable for assessing normal and pathological cartilage composition in a study cohort. On the other hand, further improvements in the sensitivity of the hardware and repeatability of the protocol are necessary to provide accurate information on individual patients.Acknowledgements
No acknowledgement found.References
1. Schreiner MM, Zbyn S, Schmitt B, et al. Magn Reson Mater Phys. 2016;29:513–521.Figures
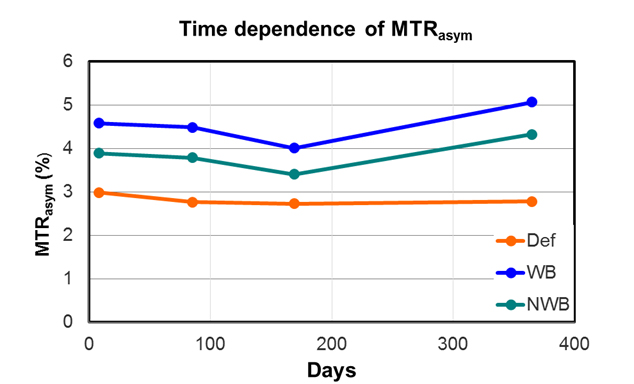
Fig. 1. Mean
MTRasym values in defect (Def), weight-bearing (WB) and non-weight-bearing (NWB)
cartilage in different time points
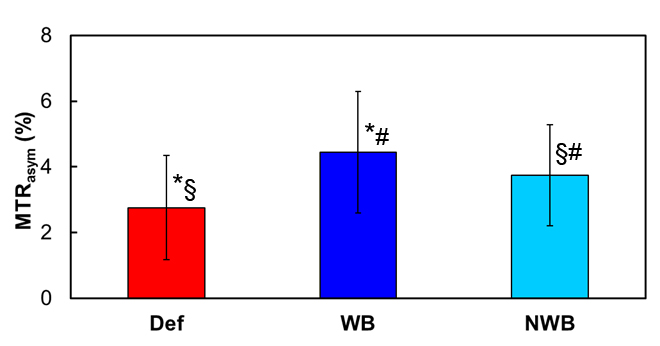
Fig. 2. Mean MTRasym values in various
regions calculated from all time points. The p values obtained by the t-test
were <0.001(*), 0.003(§) and 0.02(#), respectively.