2244
Presaturation power adjusted pulsed (PPAP)-CEST: A method to increase the independence of target CEST signals1Advanced Imaging Research Center, The University of Texas Southwestern Medical Center, Dallas, TX, United States, 2Philips Healthcare, Gainesville, FL, United States, 3Kyushu University, Fukuoka, Japan
Synopsis
We previously demonstrated in the phantoms that the chemical exchange saturation transfer (CEST) peaks identified during 0 to 3.5 ppm are often quite broad and overlap with each other, which caused in obvious interference between the CEST signals. We attempted a presaturation power adjusted pulsed (PPAP)-CEST method which aimed to increase the independence of glutamate CEST signal by eliminating an interference from a neighboring CEST signal in the kidney in mice. The CEST signal of glutamate was less impacted by concentration changes in other exchanging species by subtracting CEST signals at two different power levels.
Purpose:
We previously
demonstrated in the phantoms that the chemical exchange saturation transfer
(CEST) peaks identified during 0 to 3.5 ppm are
often quite broad and overlap with each other, which caused in obvious interference between the
CEST signals. We
further showed that subtraction between the collected CEST spectra from a
mixture of glutamate (Glu) and nicotinamide (Nic) at two different power levels
could eliminate an interference from Nic signal and yielded a CEST signal from Glu only.1 The
purpose of the study was to investigate whether a method
could also increase the independence of Glu signal (3.0 ppm)
from a neighboring Nic signal
(3.5 ppm) in vivo in the kidney. Materials and Methods:
We used eight healthy male mice (4-week-old) under anesthesia with 1.5–2% isoflurane which was adjusted occasionally to keep the respiratory rate constant, 20–22 per minute. Each animal was given either the mixed solution: same dose (1.4 mmol/kg) of Glu plus lower (0.7 mmol/kg; low-Nic) or higher dose (5.6 mmol/kg; high-Nic) of Nic.
Presaturation power adjusted pulsed (PPAP)-CEST: After localizer imaging, we selected a single 1 mm coronal slab depicting the center of either the right or left kidney. Respiratory gated GluCEST imaging was implemented using a PPAP-CEST method that used two CW presaturation pulses with different amplitudes of 2.3 µT and 5.5 µT (2.5 s duration). A centric-ordered gradient-echo image was obtained following each presaturation pulse alternatively at 25 frequency offsets from –5 to 5 ppm (0.5 ppm interval) and a reference image with the saturation offset at 300 ppm was also acquired, affording a total scan time of approximately 10 min. Each GluCEST imaging was repeated three times to evaluate the stability of CEST signals on images before injection (baseline) followed by a WASSR imaging. Subsequently, the same imaging was performed three times immediate to up to 30 min after an intraperitoneal injection of Glu plus either low-Nic or high-Nic solution.
Image Analysis: The z-spectrum was obtained by a fitting all data points on a pixel-by-pixel basis and the signals were quantified in an asymmetry analysis.2 The CEST signals were measured in ROIs (> 2.5 mm2) over the renal medulla at each time (0, 10, 20, 30 min) in both injection groups, Glu plus either low-Nic or high-Nic, and all data were measured at 3.0 ppm for Glu signal. Five ROIs were placed every 45° in the renal medulla.3 The three values from baseline images were averaged to compare with the CEST signals after injection. All image processing was executed using MATLAB and ImageJ/Fiji. All statistical analyses were performed by using a commercially available software, and P < .05 was considered statistically significant.
Results and Discussion:
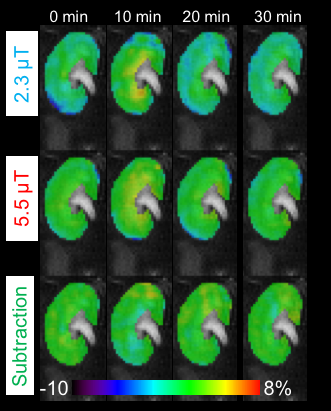
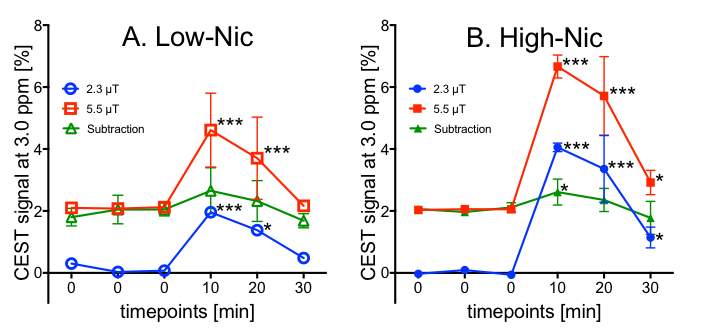
Fig. 1 shows a set of representative coronal CEST maps at 3.0 ppm superimposed on T2-weighted images obtained with the presaturation amplitude of 5.5 µT and 2.3 µT, and the subtracted maps between the two power levels before and after injection of the Glu plus Nic solutions. The CEST maps were relatively homogenous over most of the kidney but small changes were evident after injection of Glu plus Nic, especially in the medulla. Fig. 2 shows the temporal changes in CEST at 3.0 ppm in the medulla over 0 to 30 min after injection of the solutions. All CEST signals peaked at 10 min and decreased nearly back to baseline levels at 30 min after both injections. Although the injected dose of Glu was the same in both cases, the CEST signal was higher in the high-Nic group compared to that in the low-Nic group. This indicates that the interference from Nic is quite substantial. By contrast, the subtracted CEST images, assumed the Glu signal to be dominated, show similar temporal changes between the two injection groups. These results suggest that the subtraction method does reflect a true Glu signal by eliminating the interference from Nic signal. Since the exchange rate of the amino acid proton is much higher than that of the amide proton,4,5 the CEST signal increase from Glu at 3.0 ppm as the B1 is increased from 2.3 µT to 5.5 µT would be greater than the CEST increase at 3.0 ppm from Nic. This means that subtraction of the two CEST images collected at the two power levels not only largely eliminates the CEST contribution from Nic, but also reduces the total GluCEST signal.
In summary, PPAP-CEST method has the potential to increase the independence of a target CEST signal by using multiple presaturation pulses that are adjusted considering the exchange rates of the target and neighboring metabolites.
Acknowledgements
No acknowledgement found.References
- Takahashi M, Ishimatsu K, Zhang S, 25th ISMRM, abstract 1985, 2017, Hawaii
- Sagiyama K, Mashimo T, Togao O, et al. In vivo chemical exchange saturation transfer imaging allows early detection of a therapeutic response in glioblastoma. Proc Natl Acad Sci U S A. 2014;111(12):4542-4547.
- Togao O, Doi S, Kuro-o M, et al. Assessment of renal fibrosis with diffusion-weighted MR imaging: study with murine model of unilateral ureteral obstruction. Radiology. 2010;255(3):772-780.
- Cai K, Haris M, Singh A, et al. Magnetic resonance imaging of glutamate. Nat Med. 2012;18(2):302-306.
- Zhou J, Wilson DA, Sun PZ, et al. Quantitative description of proton exchange processes between water and endogenous and exogenous agents for WEX, CEST, and APT experiments. Magn Reson Med. 2004;51(5):945-952.
Figures