2243
A Phantom Investigation into the Biosynthesis Pathway of Serotonin Using CEST1Medical Biophysics, University of Toronto, Toronto, ON, Canada, 2Physical Sciences, Sunnybrook Research Institute, Toronto, ON, Canada
Synopsis
The four metabolites involved in the biosynthesis pathway of serotonin were scanned at 7T using CEST MRI in order to characterize the Z-spectrum of each. It was found that each metabolite was distinguishable from one another according to their peak location and amplitude at physiological temperature and pH within experimental uncertainty. Using a Bloch-McConnell exchange model, each metabolite was fitted for T1, T2, peak location Δ0C, exchange rate RC, and pool size M0. The in vitro CEST MRI data acquired during this investigation may increase the specificity of in vivo Z-spectrum interpretation during an investigation focused on detecting serotonin.
Introduction
Serotonin (5-HT) is a neurotransmitter produced in the brain and intestines of the human body. It plays a role in a variety of biological functions including but not limited to: bowel function, mood, clotting, nausea, bone density, and sexual function. In humans serotonin is synthesized from the amino acid tryptophan in a short metabolic pathway consisting of 3 enzymes and 4 metabolites.1 The research objective of this investigation was to characterize the Z-spectrum of each of the 4 metabolites using CEST MRI. CEST is a non-invasive contrast mechanism in which exchangeable protons are selectively saturated and indirectly detected through the bulk water protons with increased sensitivity. The Z-spectrum is a plot of water signal as a function of saturation frequency offset. Certain chemical groups will exchange their magnetization with the hydrogen nuclei of water and manifest in the Z-spectrum as peaks at a particular offset frequency from water. With the in vitro CEST data acquired from the serotonin biosynthesis pathway we may increase the specificity of the in vivo Z-spectrum interpretation.Methods
Four metabolites were prepared: Tryptophan (C11H12N2O2), 5-HTP (C11H12N2O3), 5-HT (C10H12N2O), and 5-HIAA (C10H9NO3) at a concentration of 30 mM and pH of 7.4 ± 0.3. Samples were scanned at 7T (BioSpec 70/30 USR, Bruker BioSpin, Billerica, MA) using a temperature controlled phantom holder stabilized at 37.2 ± 0.5 °C. Single slice images were acquired using magnetization transfer (block saturation pulse, tsat = 490 ms per line of k-space) prepared FLASH (TR = 500 ms, TE = 3 ms, matrix = 64 × 64, and FA = 30°). Rician noise bias, B0, and B1 corrections were applied.2,3 Fitting was done in MATLAB using a two-pool and three-pool Bloch-McConnell equation with least squares fit to the Z-spectra acquired with peak saturation amplitudes B1 of 0.1 (WASSR3), 0.5, 1.0, 1.5 and 3.0 µT and a T1 map calculated from inversion recovery RARE scans (TR = 10,000 ms and TI = 30, 110, 390, 1400, 5000 ms). At a saturation B1 of 0.1 µT, data was acquired at frequency offsets between ±0.5 ppm in 0.01 ppm steps (water = 0 ppm). For all other saturation B1, data was collected between ±7.0 ppm in 0.033 ppm steps.Results
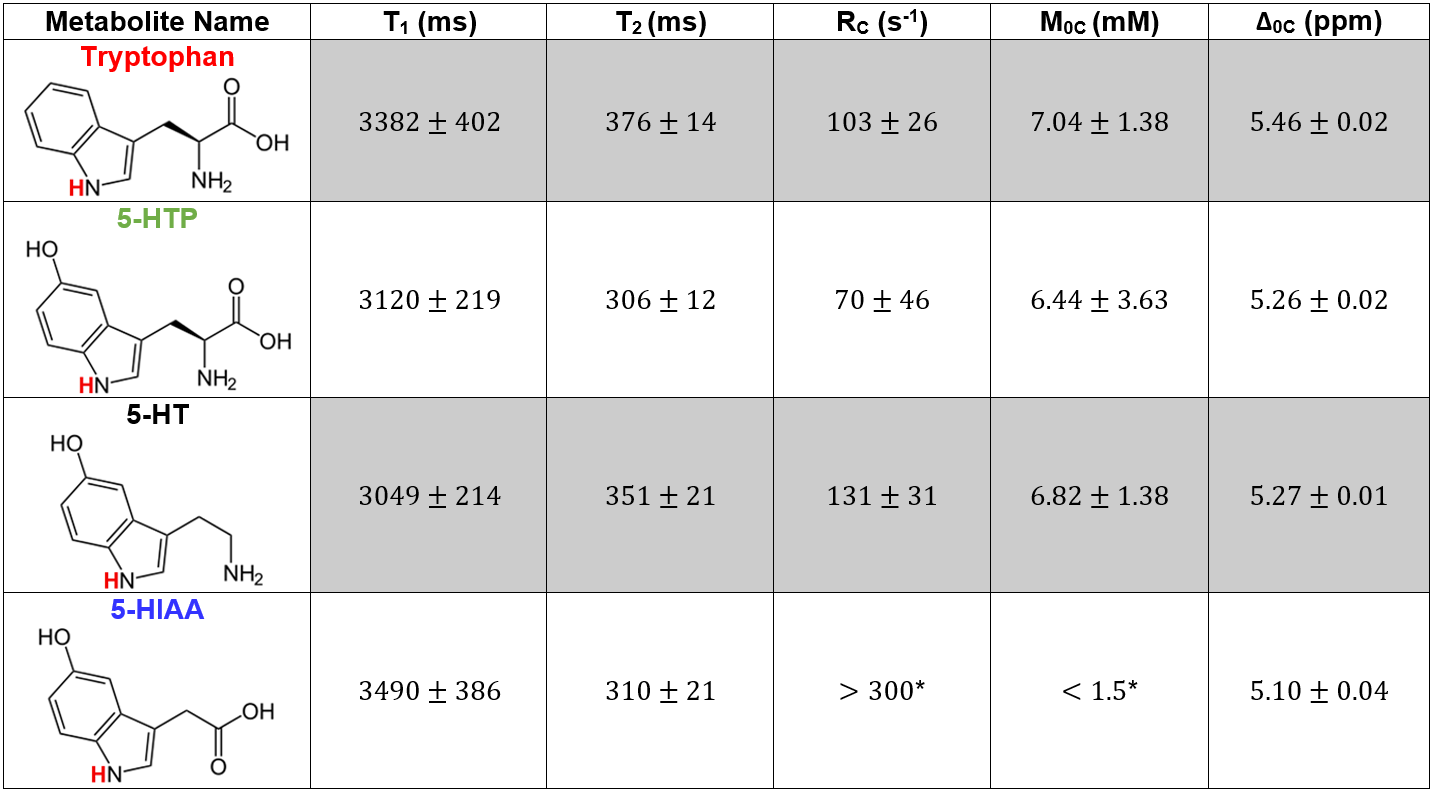
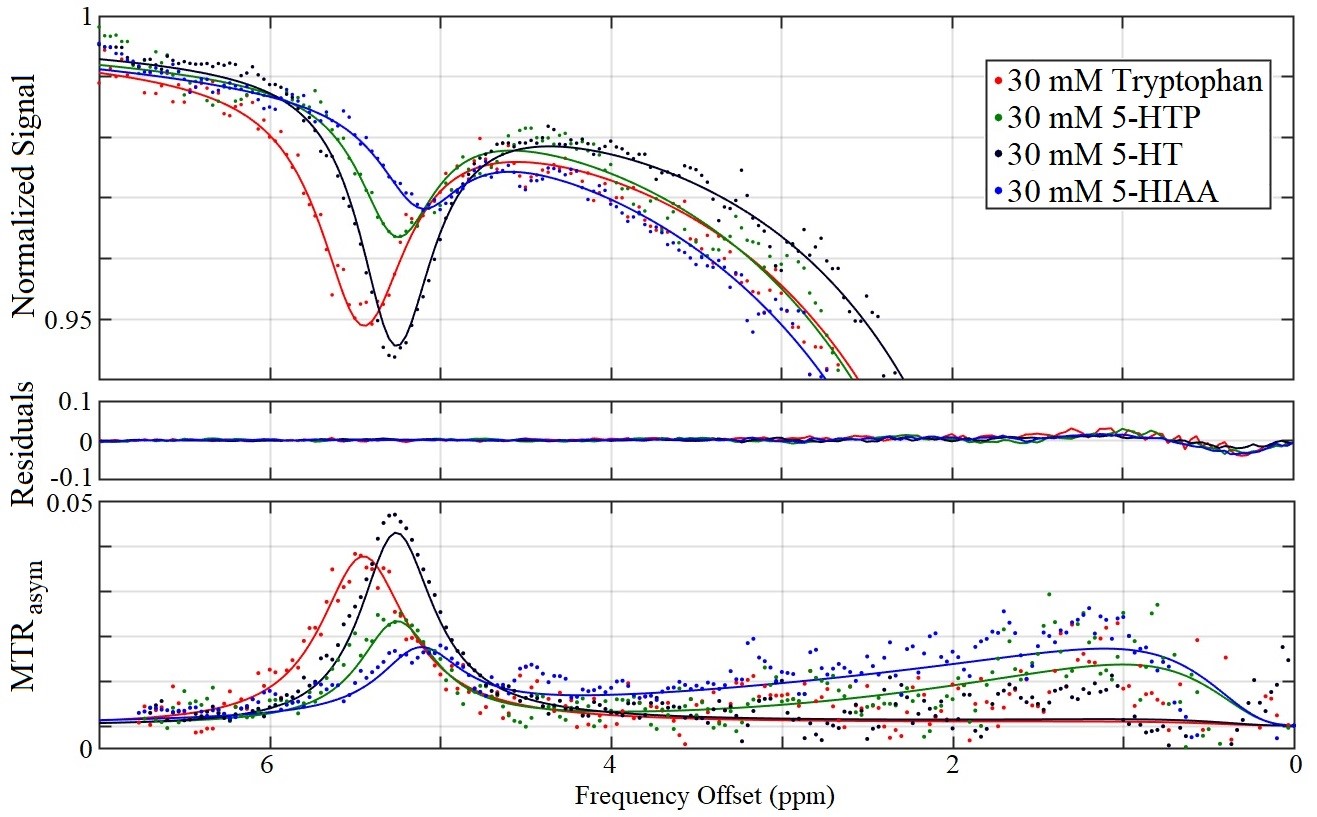
Serotonin biosynthesis molecules were characterized according to their T1, T2, peak location Δ0C, exchange rate RC, and pool size M0 (Figure 1). It was found that the peak locations and amplitudes of these metabolites can be distinguished from one another within experimental uncertainty. The Z-spectra for each metabolite at a saturation B1 of 1.5 µT are shown in Figure 2.Discussion
The Z-spectra for each of the four metabolites seen in Figure 2 all demonstrate a significant CEST peak. The largest CEST effect originates from serotonin due to it having the largest exchange rate RC. We suggest that the CEST peaks in the region between 5.10–5.46 ppm originate from the HN bond on the indole ring (highlighted red in Figure 1), however we don’t not see this peak on indole itself perhaps due to tumbling effects. The contribution from tryptophan, 5-HTP, and 5-HIAA is approximately 0.5%, 2.0%, and 2.4% smaller than serotonin respectively. The peak of tryptophan was shifted towards higher frequency offset and that of 5-HIAA was shifted towards the lower frequency offset. The exchange rate of 5-HIAA was too fast to measure, which caused difficulty when fitting the Z-spectra.
Two separate models were used for different metabolites: a two-pool exchange model and a three-pool exchange model. The necessity for two different models is due to a CEST effect seen near 1 ppm believed to be caused by the hydroxyl group bonded to the carbon-5 location of the indole ring. The three-pool model was used for both 5-HTP and 5-HIAA due to the prominence of this effect; however, the effect was not as great in serotonin, so a two-pool model was used. The fitted parameters for the three pool-model are not illustrated in Figure 1 due to the model’s inability to constrain the fast exchanging and small CEST effect seen in this region of the Z-spectra.
Conclusions
The results of this in vitro phantom study lead us to believe that we will be able to more accurately interpret the results of an in vivo CEST investigation focused on the detection of serotonin. The next stages of this investigation involve the manipulation and observation of brain serotonin in rats to determine whether or not it is possible to detect serotonin in vivo using CEST MRI.Acknowledgements
We thank the Canadian Institutes for Health Research (PJT148660) for financial support.References
- Martinez A., Knappskog P.M., and Haavik J. A Structural Approach into Human Tryptophan Hydroxylase and Implications for the Regulation of Serotonin Biosynthesis. Current Med Chem. 2001:8:1077-1091.
- Henkelman R.M. Measurement of signal intensities in the presence of noise in MR images. Med Phys. 1985:12(2):232-233.
- Kim M., Gillen J., Landman B.A., Zhou J., van Zijl P.C.M. Magn Reson Med. 2009:61(6):1441-1450.
Figures