2241
Improved estimation of amide proton exchange rate and concentration using Bayesian model fitting of Z-spectra acquired with multiple saturation powers1Wellcome Centre for Integrative Neuroimaging, FMRIB, Nuffield Department of Clinical Neurosciences, University of Oxford, Oxford, United Kingdom, 2CRUK & MRC Oxford Institute for Radiation Oncology, University of Oxford, Oxford, United Kingdom, 3Institute of Biomedical Engineering, University of Oxford, Oxford, United Kingdom
Synopsis
A Bayesian model-based approach to analysis of CEST MRI quantifies CEST effects more accurately than alternative approaches by fitting the Bloch-McConnell equations to measured Z-spectra and estimating the exchange rate and concentration of each labile proton population. However, estimates of exchange rate and concentration using this approach are correlated, making accurate estimation of either parameter in isolation difficult. In this study, we demonstrate using simulation and in vivo data that separation of this correlation may be possible by analysing data acquired with different B1 powers simultaneously.
Introduction
A Bayesian model-based approach to analysis of CEST MRI quantifies CEST effects more accurately than alternative approaches[1]. This method fits the Bloch-McConnell equations to measured Z-spectra, estimating the exchange rate and concentration of each labile proton population[2,3]. However, estimates of exchange rate and concentration using this approach are correlated, making accurate estimation of either parameter in isolation difficult[2]. In this study, we demonstrate that separation of this correlation may be possible by analysing data acquired with different B1 powers simultaneously.Methods
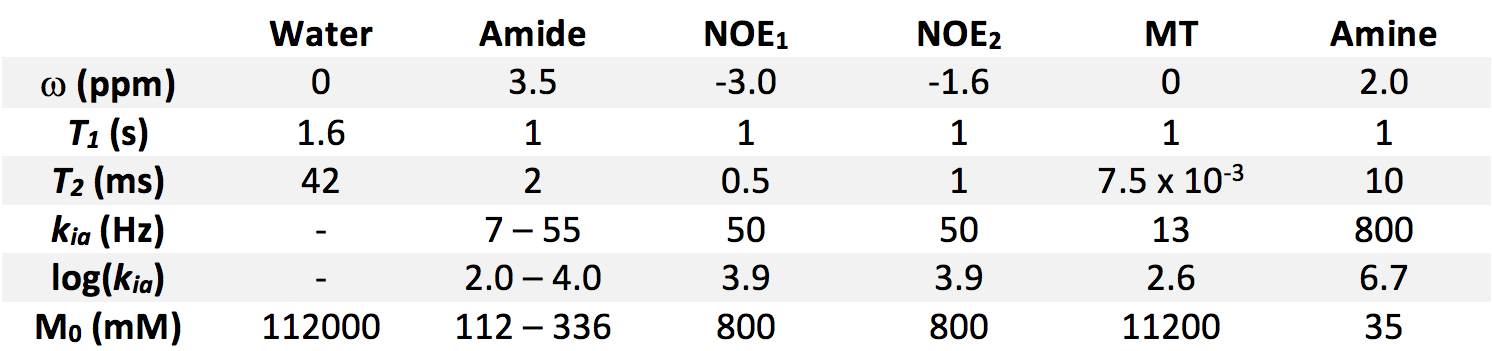
Z-spectra were simulated using the Bloch-McConnell equations with six proton populations. Amide concentration (M0b) and exchange rate (kba) were varied over a 5x5 matrix: M0b=112mM–336mM in 56mM steps, log(kba)=2.0–4.0 in 0.5 steps. Other parameters are shown in Figure 1. Continuous saturation was assumed for 2s. Offset frequencies from -6ppm–6ppm (0.3ppm resolution) were simulated (normalisation at ±500ppm; 43 data points). For each parameter combination 100 datasets were generated and 1% white noise added.
Six simulated datasets were generated:
- Four single B1 datasets comprising a full Z-spectrum with B1=0.28µT, 0.55µT, 0.83µT, or 1.10µT
- A multi B1 dataset with all four of the single B1 datasets concatenated (4x43=172 data points)
- A repeated sampling dataset with one full Z-spectrum (B1=0.55µT) followed by sub-sampling (9 samples from 2.1ppm–4.5ppm) for a further 14 B1 powers (0.1µT–1.4µT with 0.1µT steps; 9x14 = 126 data points; total 169 data points)
The simulated data were analysed using BayCEST in FSL[2], yielding estimates of M0b and kba with a standard deviation (which gives the confidence of the estimate). M0b and kba were used to calculate a single summary measure of the APT effect, APTR*, using an idealised two-pool model, as described previously. The accuracy of the estimated M0b, kba and APTR* was assessed by calculating the root-mean-square error (RMSE) against the true values for all parameter combinations and taking the mean. Since APTR* is B1 dependent, a nominal B1=0.55µT was used for APTR* calculations. The number of data points was matched for single or multi B1 datasets to ensure fair comparison of the RMSE values.
Finally, in vivo data acquired with B1=0.28µT, 0.55µT, 0.83µT, or 1.10µT from five Wistar rats 1h following middle cerebral artery occlusion (MCAO) as a model of ischaemic stroke were analysed in the same way as the individual and concatenated analyses described above. Since no ground truth knowledge of M0b and kba was available, the performance of each analysis method was evaluated by observing the confidence of the mean parameter values output by the model.
Results
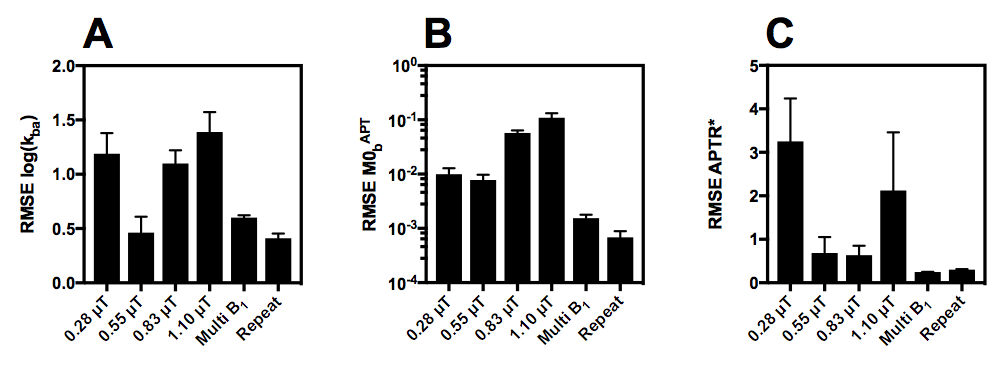
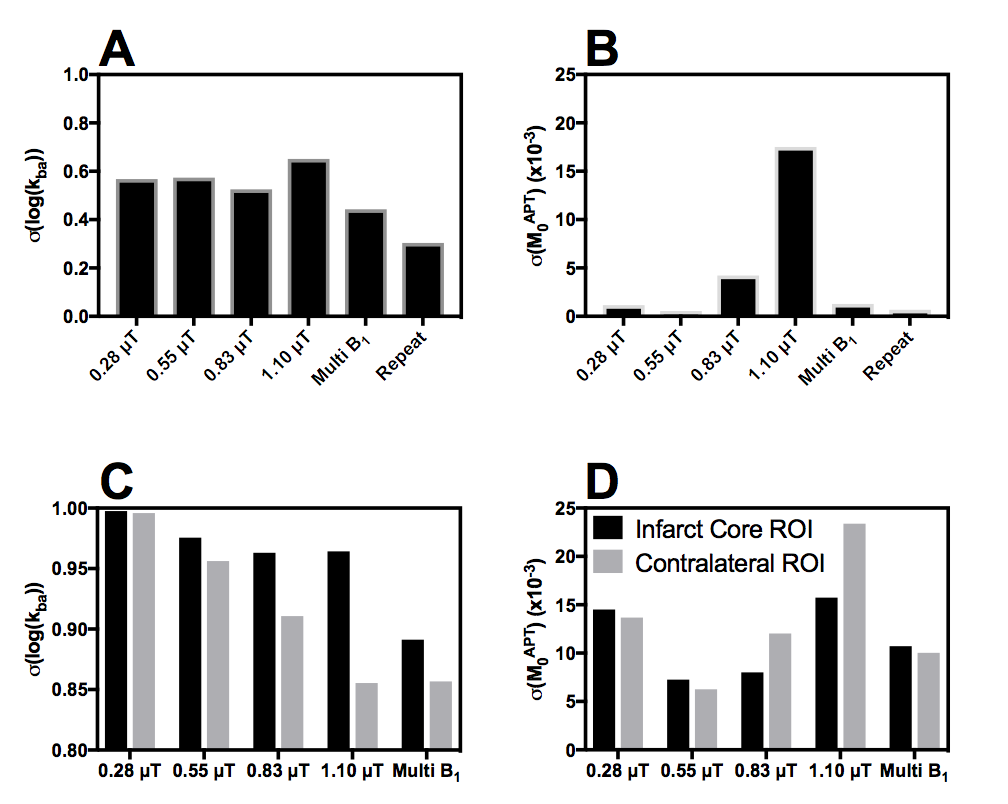
Figure 2 shows the average RMSE for M0b, kba and APTR* from each of the individual B1 datasets, and the concatenated and repeated sampling datasets. The estimation of M0b, kba and APTR* is improved by using the multi B1 or repeated sampling datasets. Since each dataset has a similar number of data points, the decreased RMSE is likely caused by the analysis approach improving its convergence on a global minimum within the fitting space, which is in turn reflected in the decrease in the standard deviation on the mean parameter estimates when analysing the multi B1 or repeated sampling datasets (Figure 3A,B).
Analysis of in vivo data yielded greater confidence in the estimates of M0b and kba from the multi B1 dataset than any individual B1 dataset (Figure 3C,D). This increase in confidence may be an artefact from the additional data points analysed in the multi B1 dataset. However, since an equivalent increase in confidence was seen in simulations (Figure 3A,B), where we control for the number of data points, the increase in confidence is likely a real effect.
Discussion & Conclusion
The results presented here demonstrate that accurate estimation of M0b and kba is possible using a Bayesian model-based analysis of Z-spectra acquired at multiple B1 powers. Furthermore, we show that repeated sampling of the Z-spectrum at frequencies of interest provides more information to the Bayesian model to accurately determine the labile pool parameters at that frequency. These results agree with previous studies which have shown that an optimal sampling strategy improves quantification of CEST effects using a model-based analysis approach[4]. Application of this method to in vivo data showed an improvement in the confidence of the parameter values output from the model.
For a fixed number of data points, it is likely more efficient to acquire a full Z-spectrum and sub-sample in the frequency range of interest at many B1 powers. Implementing this sampling strategy may enable clinically feasible quantitative CEST MRI, since it is no longer necessary to acquire full Z-spectra at many B1 powers.
Acknowledgements
Funding was provided by a Medical Research Council Studentship, the EPSRC & CRUK Cancer Imaging Centre - Oxford and the Oxford NIHR Biomedical Research Centre. The Wellcome Centre for Integrative Neuroimaging is supported by core funding from the Wellcome Trust. The Wellcome Trust also provided funding through the Institutional Strategic Support Fund (ISSF) for in vivo imaging costs.References
[1] Tee, Y.K., Harston, G.W.J., Blockley, N. et al. "Comparing different analysis methods for quantifying the MRI amide proton transfer (APT) effect in hyperacute stroke patients." NMR Biomed. 2014; 27(9): 1019-29
[2] Chappell, M.A., Donahue, M.J., Tee, Y.K. et al. "Quantitative Bayesian model-based analysis of amide proton transfer MRI" Magn. Reson. Med. 2013; 70(2):556-567
[3] Ray, K.J., Larkin, J.R., Tee, Y.K. et al. "Determination of an optimally sensitive and specific chemical exchange saturation transfer MRI quantification metric in relevant biological phantoms" NMR Biomed. 2016; 29(11): 1624-1633
[4] Tee, Y.K., Khrapitchev, A.A., Sibson, N.R. et al. "Optimal Sampling Schedule for Chemical Exchange Saturation Transfer" Magn. Reson. Med. 2013; 70(5): 1251-1262
Figures