2240
Steady-state CEST-MRI using a reduced saturation period1Division of Medical Physics in Radiology, German Cancer Research Center (DKFZ), Heidelberg, Germany
Synopsis
In this study, we propose a novel approach to determine the steady-state of CEST experiments without the application of prolonged saturation periods. This is achieved by numerically calculating the steady-state from a measurement with a reduced saturation period (in the order of the water proton T1). This may allow quantitative CEST measurements, capable of providing information about pH and metabolite concentrations, in a reasonable and clinical relevant time frame.
Introduction
Quantitative chemical exchange saturation transfer (CEST) imaging has been shown to in principle allow absolute pH imaging and determination of metabolite concentrations1,2. However, most of these techniques rely on the steady-state CEST signal, which requires a long saturation period in the order of 3-5 times the longitudinal relaxation time of water (T1w)3. For clinical applications a compromise has therefore to be made between a sufficiently long contrast preparation and feasible examination times3. Here we present an approach, which can bypass this obstacle by determining the steady-state of CEST experiments without the application of saturation in compliance with the steady-state criterion.Methods
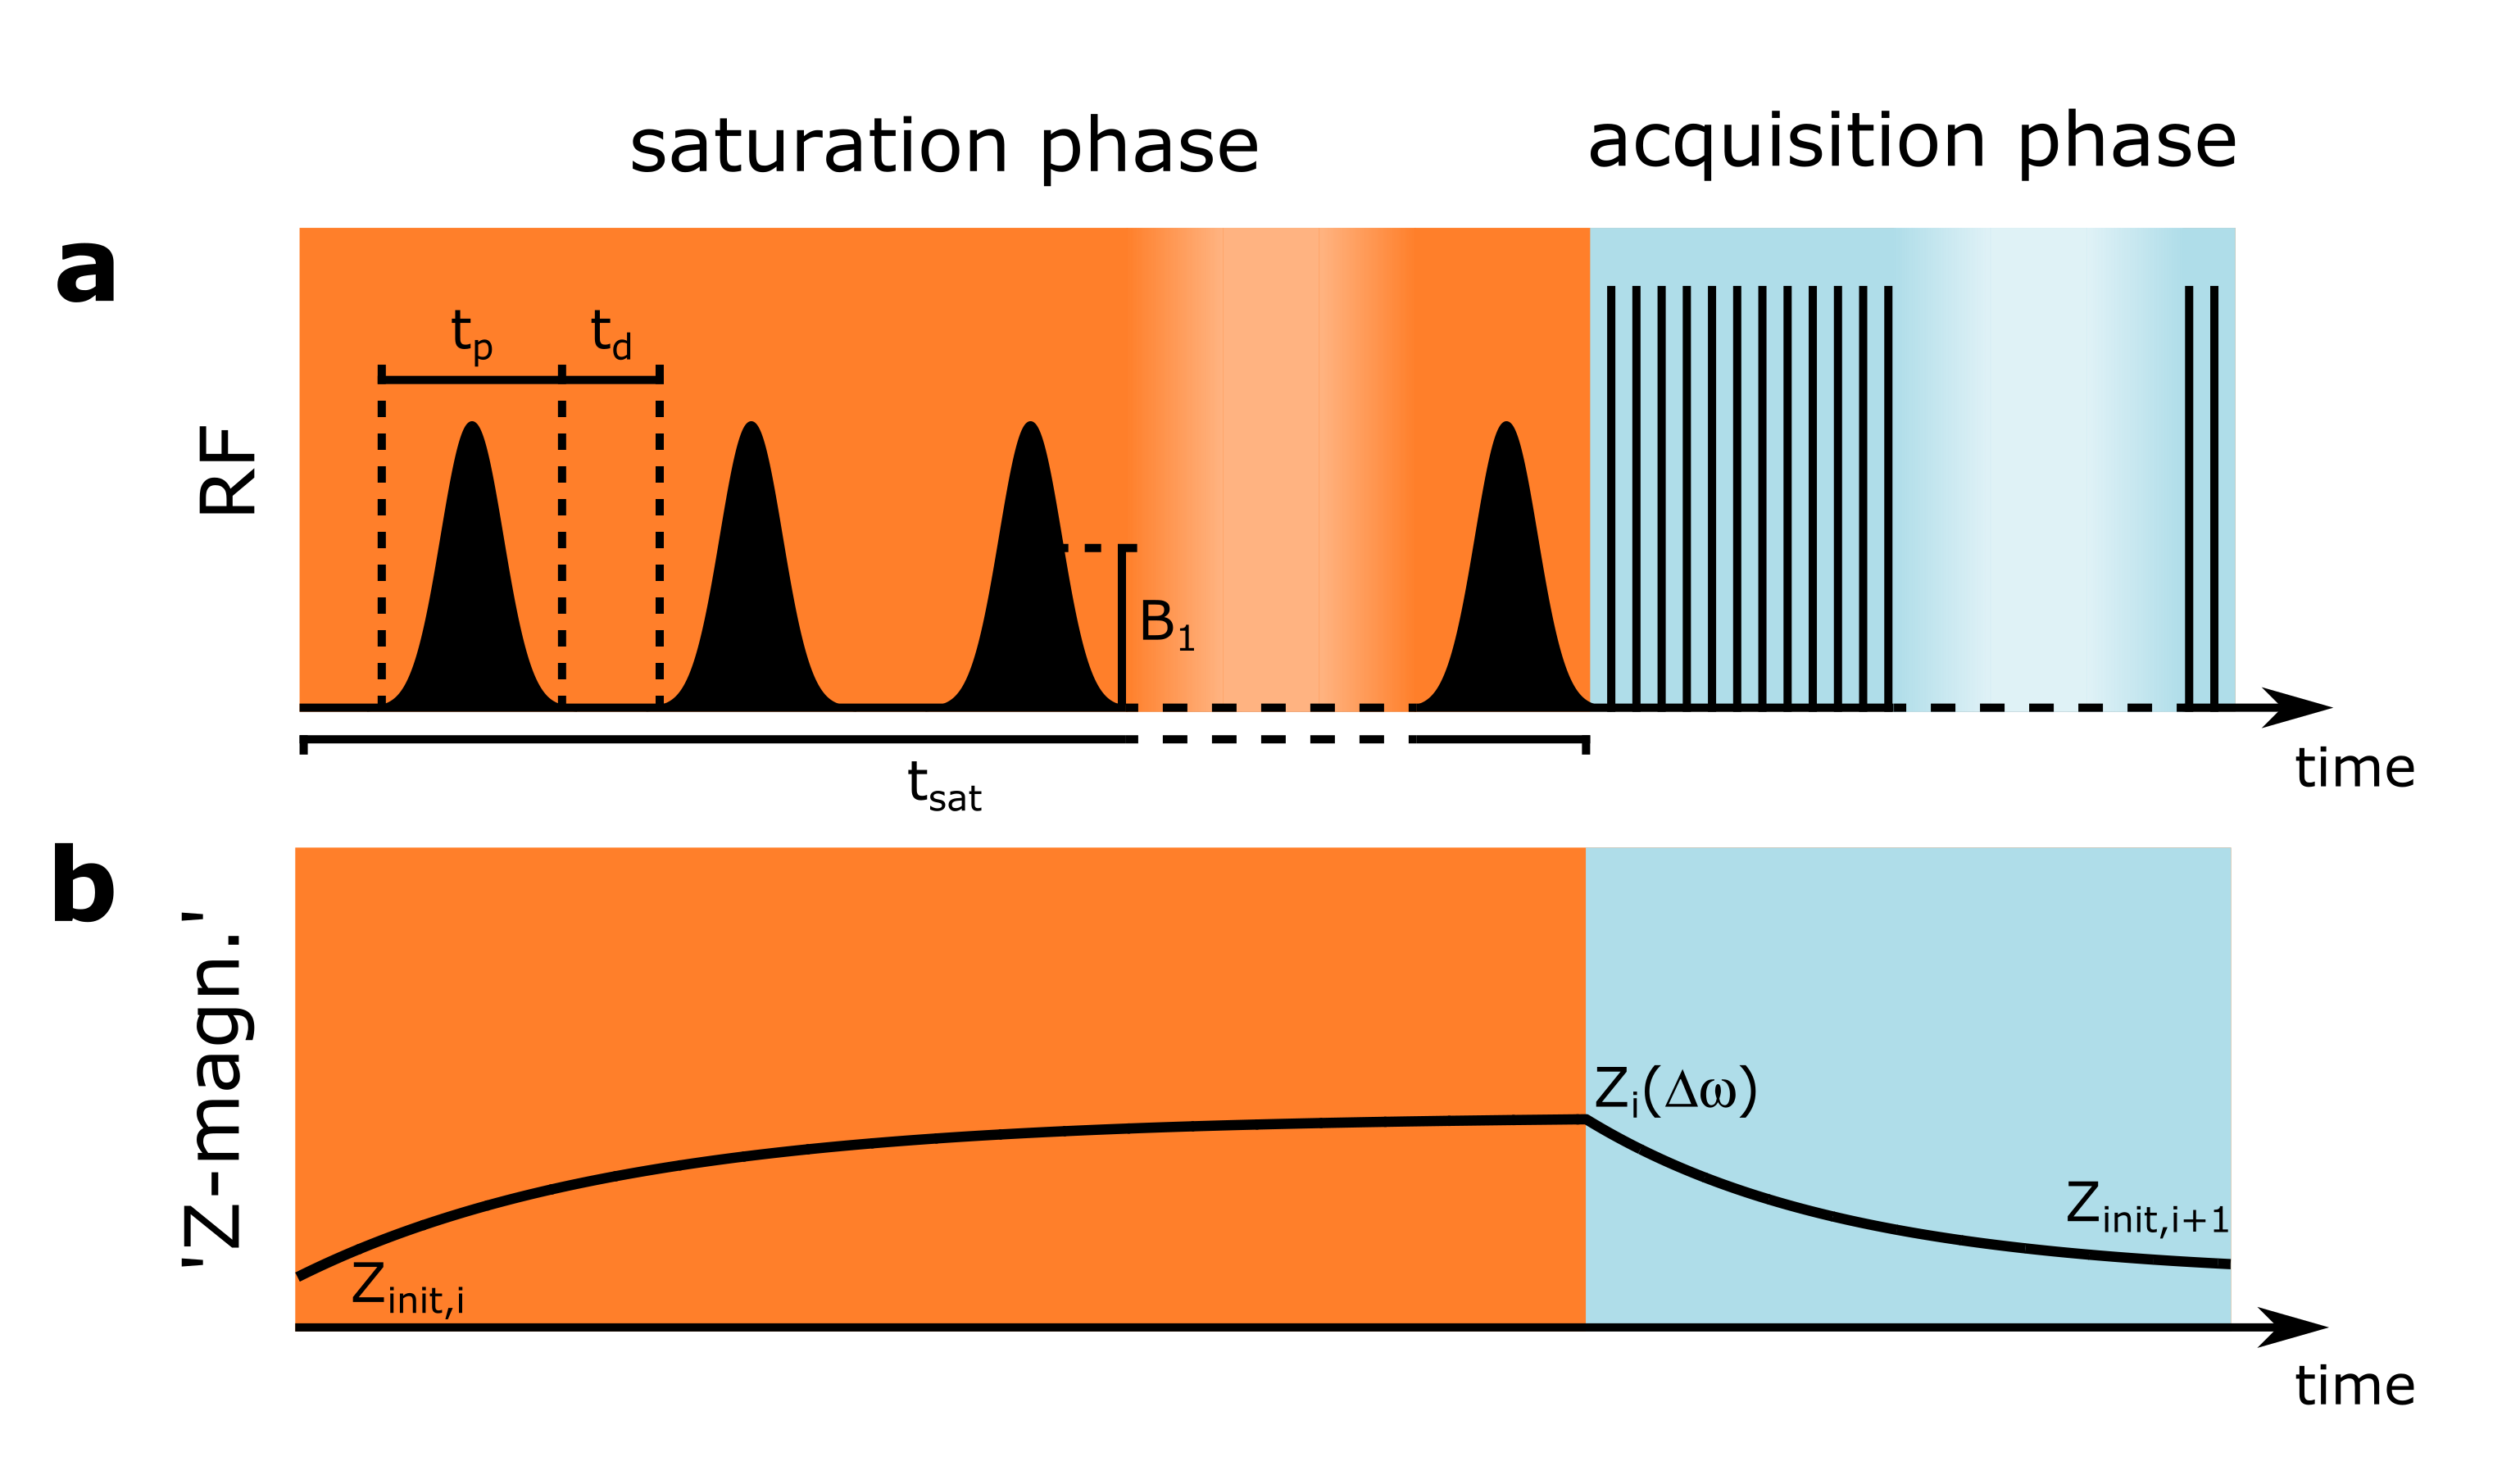
During a pulsed CEST experiment (Fig. 1a) the initial Z-magnetization Zinit can be assumed to mono-exponentially decay – via the so-called transient-state Z – towards the steady-state $$$Z^{ss}_{pulsed}$$$ with the effective decay rate R1ρ,pulsed (Fig. 1b)4,5. $$Z(Δω)=Z^{ss}_{pulsed}+(Z_{init}-Z^{ss}_{pulsed})e^{t_{sat}·R_{1ρ,pulsed}} [1]$$ $$$Z^{ss}_{pulsed}$$$ itself depends on R1ρ,pulsed according to $$Z^{ss}_{pulsed}=\frac{R_{1w}(1-DC+\cos\theta\cdot DC)}{R_{1\rho,pulsed}} [2]$$ with the tilt angle of the effective field $$$\theta=\tan^{-1}(\omega_{1}/\Delta\omega)$$$. This mathematical relation can be exploited to reduce the number of unknown parameters in Eq.1. For a known Zinit, this allows determining $$$Z^{ss}_{pulsed}$$$ from Z for an arbitrary saturation time. Solving Eq. 2 for the denominator and insertion in Eq. 1 yields Z as function of $$$Z^{ss}_{pulsed}$$$. $$Z(Δω)=Z^{ss}_{pulsed}+(Z_{init}-Z^{ss}_{pulsed})e^{t_{sat}·R_{1w}(1-DC+\cos\theta\cdot DC)/Z^{ss}_{pulsed}} [3]$$ Eq. 3 cannot be solved analytically for $$$Z^{ss}_{pulsed}$$$. However since Z is a strictly monotonously increasing function of $$$Z^{ss}_{pulsed}$$$, a numerical calculation can be applied. This calculus requires Z and Zinit for each frequency offset $$$\Delta\omega$$$. In addition, B0, B1 and T1w have to be determined once. Zinit can be estimated pixelwise by the preceding measurement according to $$$Z_{init,i+1}=P_1\cdot Z_{i}+P_0$$$, where P1 and P0 are determined in a calibration with the same sequence timings. All MR measurements were performed on a 7T whole-body scanner (Siemens Healthineers, Germany). Pre-saturation was obtained by either 60 or 700 Gaussian-shaped pulses (mean B1 = 0.5µT, tp = 15ms, duty cycle = 60%) leading to a saturation time of tsat = 1.5s and 17.5s respectively. B0 and B1 were obtained using the WASABI approach6 and T1w with a saturation recovery sequence. Quantitative relayed nuclear Overhauser effect (rNOE)-CEST images were calculated using the apparent exchange-dependent relaxation rate (AREX)5 with a 5-pool Lorentzian fit analysis.
Results
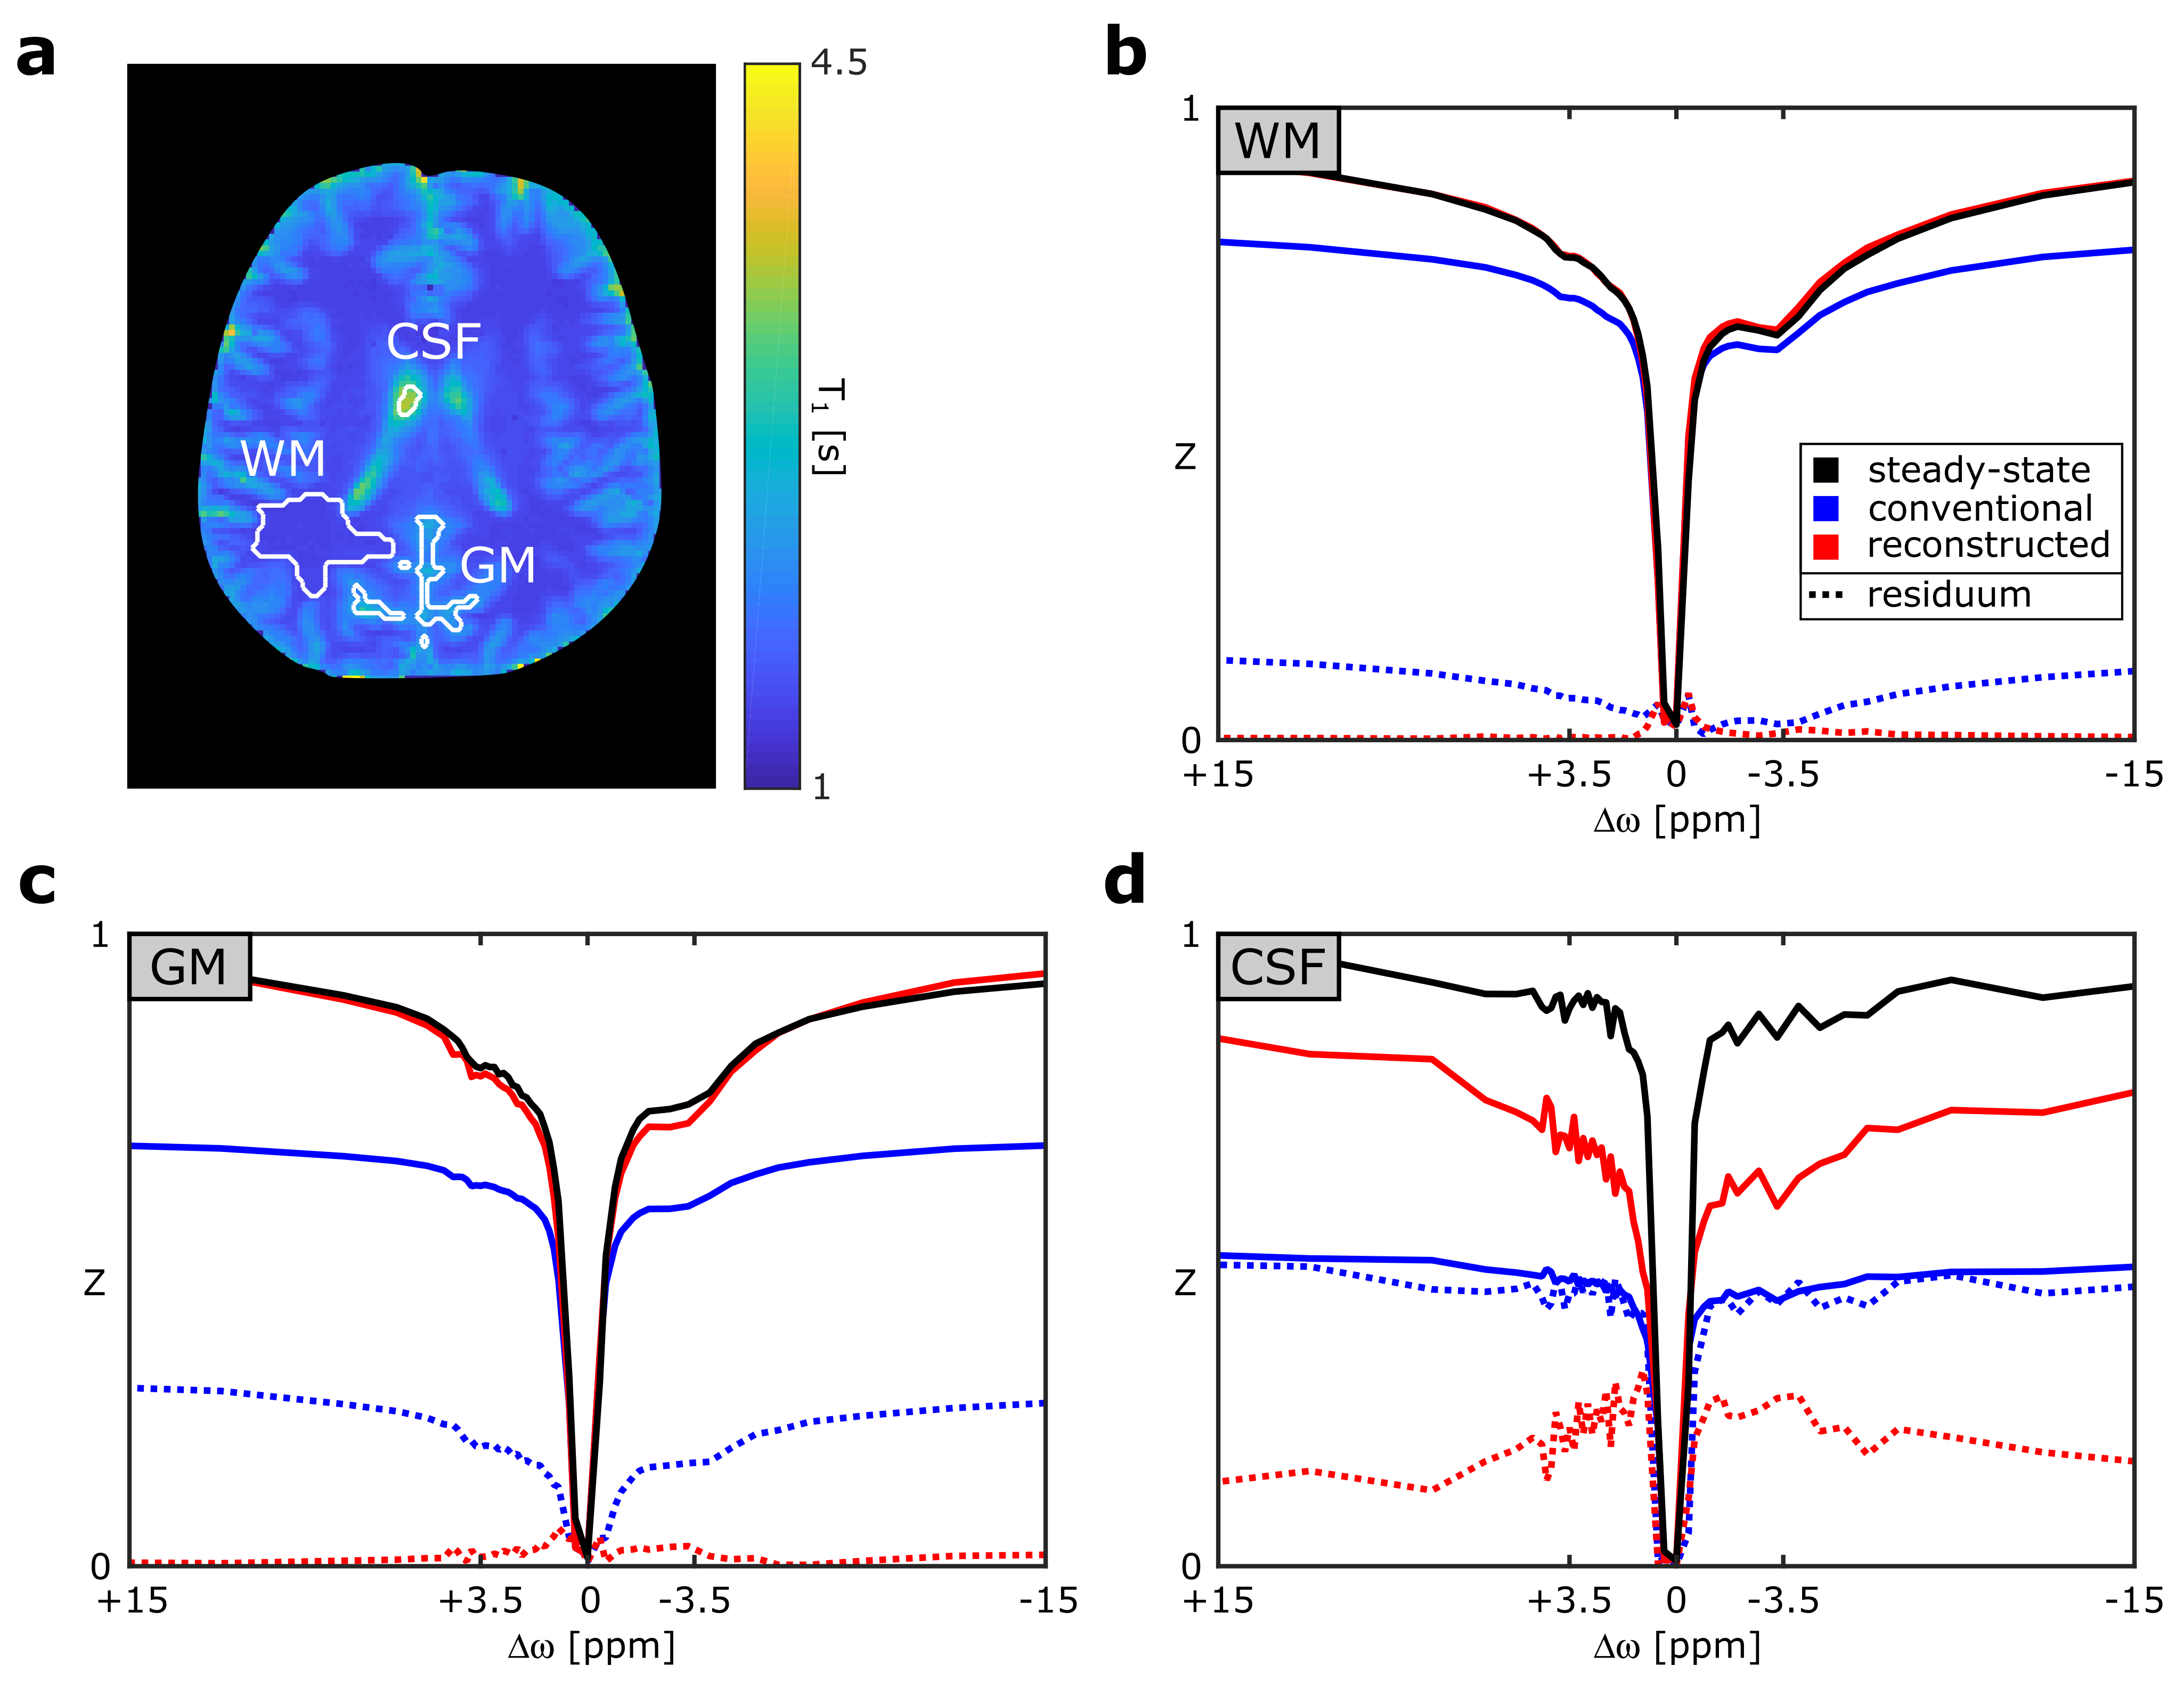
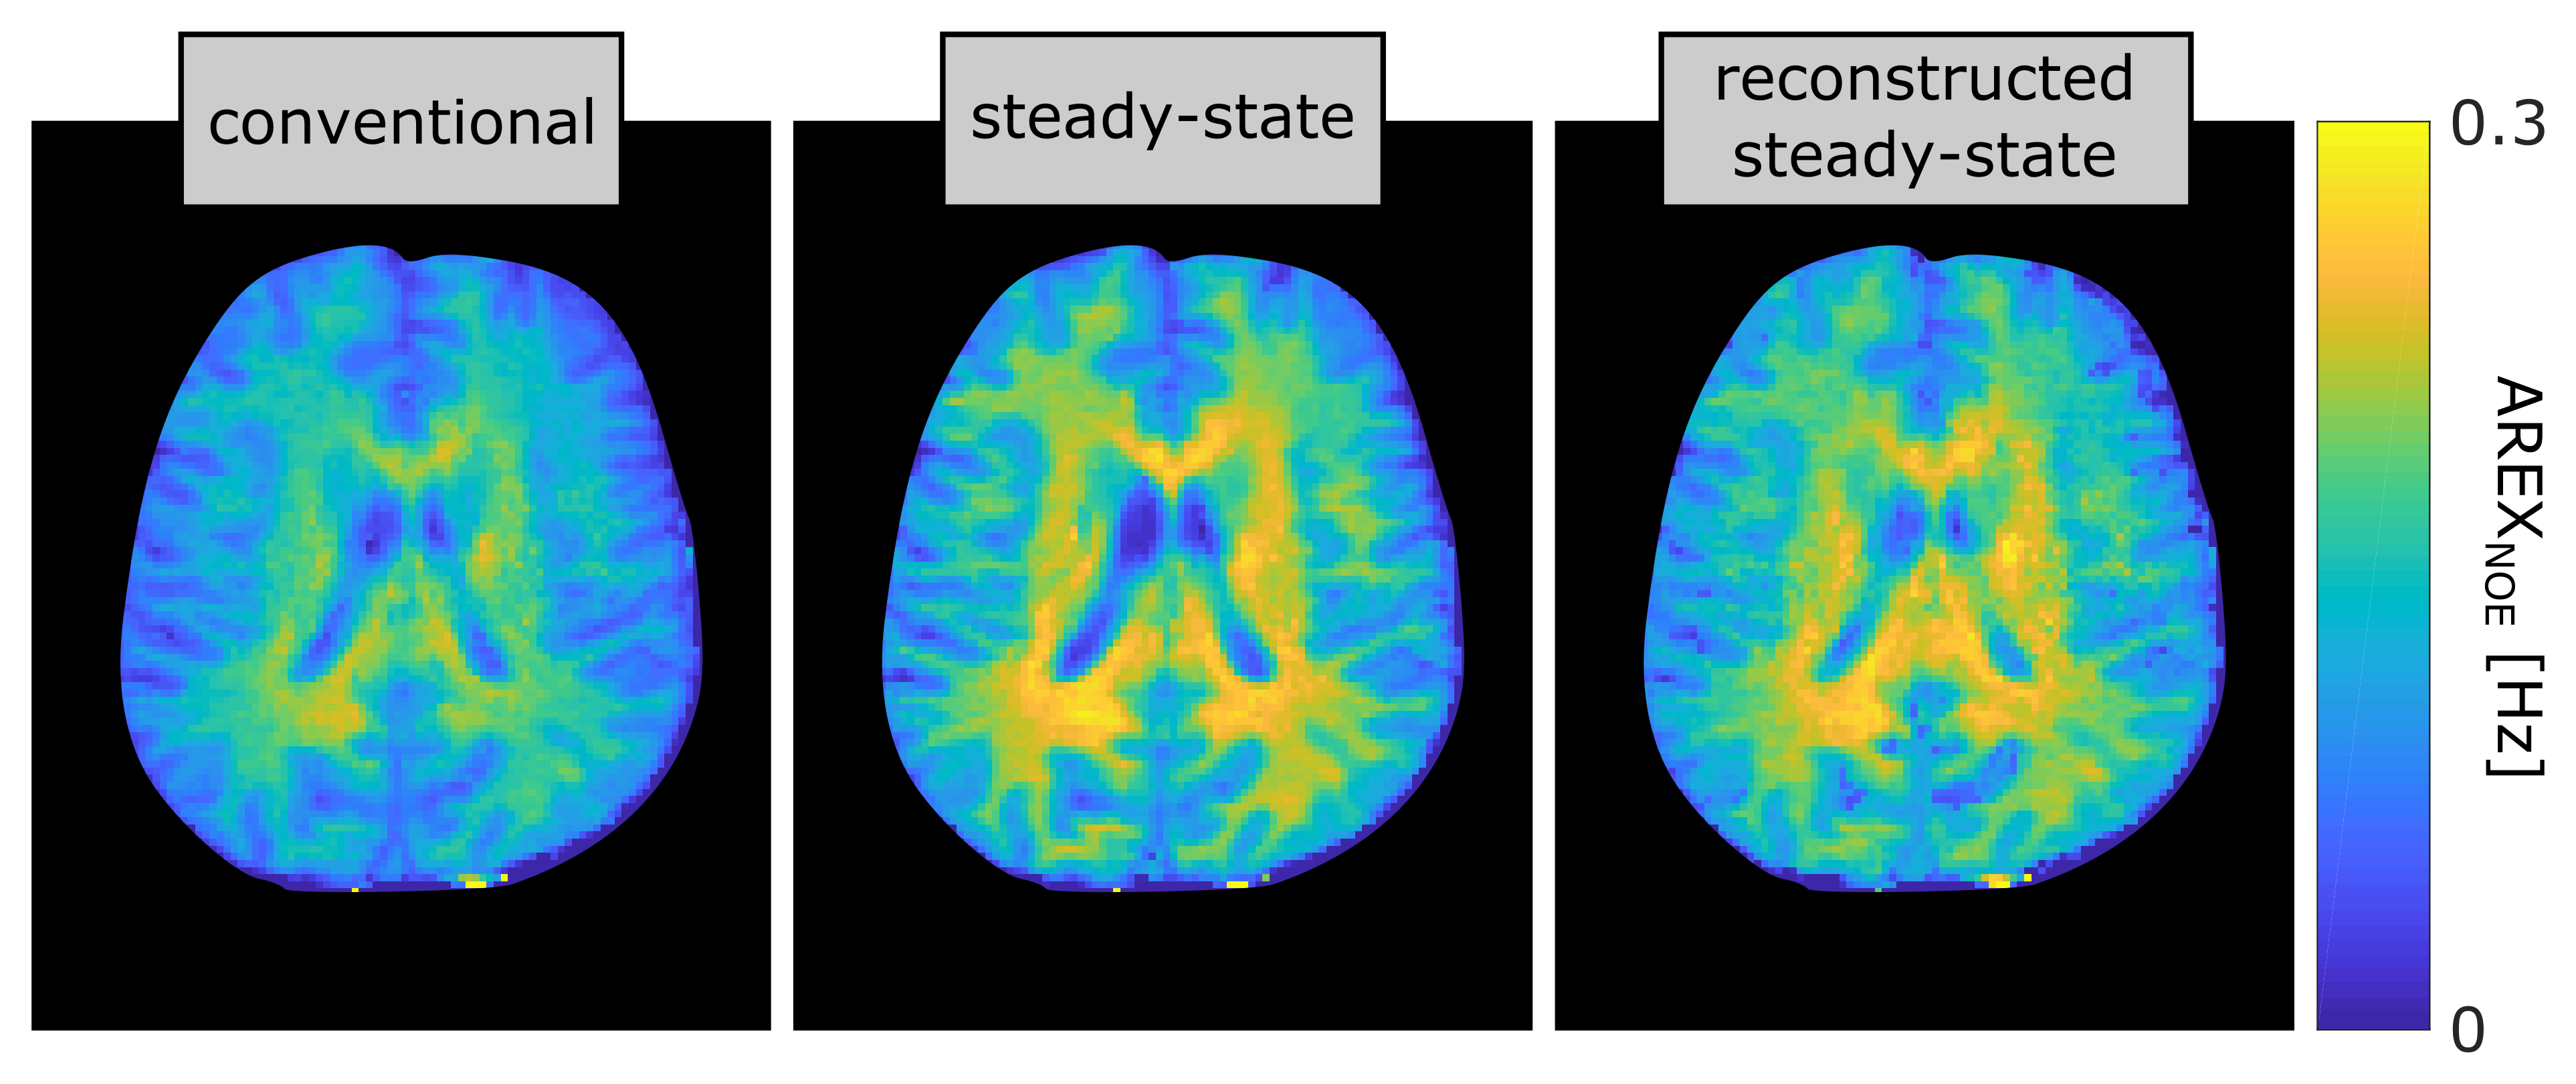
In a region of interest (ROI) analysis (Fig. 2a), the conventional spectra exhibit strong differences in all ROIs (blue lines in Fig.2 b-d). On the contrary, the reconstructed Z-spectra (red lines) exhibit good agreement with negligible deviations in white matter (WM) and only minor ones in grey matter (GM) around Δω = -3.5 ppm. However, in cerebrospinal fluid (CSF) large differences can be observed. The calculated rNOE-CEST images display similar results for the novel approach compared to the steady-state with discrepancies only around the CSF, whereas the rNOE-CEST images acquired by the conventional method show significantly lower signal values across the entire image (Fig. 3).Discussion
In contrast to the conventional approach, the presented method was able to reproduce the steady-state in the main regions of the brain. As expected, the highest agreement can be observed in WM due to a short T1w of 1.4s (≈ tsat). The small deviations around Δω = −3.5 ppm in GM can potentially be explained by a comparably small exchange rate of the rNOE (around 5 Hz)7 in combination with a longer T1w. In this limit, the assumption of a mono-exponential decay does not hold anymore and rotation effects as well as exchange processes in the pauses would have to be considered8. In the reconstructed Z-spectrum of CSF considerable differences to the steady-state remain. This can be understood in terms of a partial volume effect, which does not allow assigning a single decay rate to each voxel and thereby prevents a correct reconstruction. However, in most CEST experiments the main emphasis is on the solid components of the brain (WM and GM) anyhow, for which the novel approach yields reliable results.Conclusion
The proposed method was shown to enable steady-state CEST measurements without application of prolonged saturation periods. The resulting reduction in the required measurement time will eventually enable performing quantitative CEST examinations, allowing for example to assess pH, in a clinical relevant time frame.Acknowledgements
JB acknowledges the financial support of the International Max Planck Research School for Quantum Dynamics in Physics, Chemistry and Biology.References
- McMahon, M. T. et al. Quantifying Exchange Rates in Chemical Exchange Saturation Transfer Agents Using the Saturation Time and Saturation Power Dependencies of the Magnetization Transfer Effect on the Magnetic Resonance Imaging Signal (QUEST and QUESP): pH Calibration for Poly-l-Lysine and a Starburst Dendrimer. Magn Reson Med 55, 836–847 (2006).
- Sun PZ, Wang Y, Dai Z, Xiao G, Wu R. Quantitative chemical exchange saturation transfer (qCEST) MRI - RF spillover effect-corrected omega plot for simultaneous determination of labile proton fraction ratio and exchange rate. Contrast Media Mol Imaging. 2014 Jul;9(4):268–75.
- Zaiss, M. & Bachert, P. Chemical exchange saturation transfer (CEST) and MR Z -spectroscopy in vivo : a review of theoretical approaches and methods. Phys. Med. Biol. 58, R221 (2013).
- Santyr, G. E., Fairbanks, E. J., Kelcz, F. & Sorenson, J. A. Off-resonance spin locking for MR imaging. Magn. Reson. Med. 32, 43–51 (1994).
- Zaiss, M. et al. Inverse Z-spectrum analysis for spillover-, MT-, and T1-corrected steady-state pulsed CEST-MRI – application to pH-weighted MRI of acute stroke. NMR Biomed. 27, 240–252 (2014).
- Schuenke, P. et al. Simultaneous mapping of water shift and B1(WASABI)—Application to field-Inhomogeneity correction of CESTMRI data. Magn. Reson. Med. 77, 571–580 (2017).
- Friedman, J. I., Xia, D., Regatte, R. R. & Jerschow, A. Transfer Rate Edited experiment for the selective detection of Chemical Exchange via Saturation Transfer (TRE-CEST). Journal of Magnetic Resonance 256, 43–51 (2015).
- Roeloffs, V., Meyer, C., Bachert, P. & Zaiss, M. Towards quantification of pulsed spinlock and CEST at clinical MR scanners: an analytical interleaved saturation–relaxation (ISAR) approach. NMR Biomed. 28, 40–53 (2015).
Figures