2239
How Valuable is T1 and T2 Information for Model-based Analysis of CEST MRI in Disease?1Institute of Biomedical Engineering, University of Oxford, Oxford, United Kingdom, 2CRUK & MRC Oxford Institute for Radiation Oncology, University of Oxford, Oxford, United Kingdom, 3Wellcome Centre for Integrative Neuroimaging, FMRIB, Nuffield Department of Clinical Neurosciences, University of Oxford, Oxford, United Kingdom, 4Acute Stroke Programme, Radcliffe Department of Medicine, University of Oxford, Oxford, United Kingdom, 5School of Medicine, Faculty of Health, University of Tasmania, Hobart, Australia
Synopsis
T1 and T2 are often altered by pathology, and while this may have significant impact on quantification of CEST MRI, acquisition of T1 and T2 maps may not be feasible within a clinical setting. However, Bayesian model-based analysis of CEST MRI can incorporate estimation of T1 and T2, with or without quantitative maps. Here we explore how valuable T1 and T2 knowledge is for the detection of pathological alterations in the CEST effect using APT MRI,in both ischaemic stroke and tumours, demonstrating acquisition and analysis of should in part be tailored to the pathology in question.
Introduction
Pathological alterations in T1 and T2 may have a significant impact on quantification of CEST MRI1,2,3. However, acquisition of T1 and T2 maps may not always be feasible within a clinical setting. Bayesian model-based analysis of CEST MRI4,5 is an approach shown to quantitatively outperform other CEST metrics6,7, inherently estimating and compensating for concomitant T1 and T2 effects, macromolecular contributions, and B0-inhomogeneities. While not essential for model-based analysis, inclusion of T1 and T2 maps has been shown to further increase the accuracy of CEST quantification in vitro7. However, impact of separate T1 and T2 acquisition on model-based analysis in vivo is not known. Here, we investigate how valuable T1 and T2 knowledge is for detection of pathological alterations in the CEST effect using APT MRI in both ischaemic stroke and tumours.Methods
Focal ischaemia was induced in six Wistar rats using middle cerebral artery occlusion. In addition, brain metastases (ENU cell-line) were induced in nine BDIX rats, via intracerebral injection. The ischaemia cohort were imaged one hour post-occlusion, and the tumour cohort at 4 weeks post-injection.
Animals were imaged using a 9.4T system (Agilent) with 72mm volume-transmit and 4-channel surface-receive array (Rapid Biomedical). APT data were acquired using a saturation scheme of 50 Gaussian pulses (40ms duration, 184° FA, 50% duty cycle, equivalent continuous wave saturation power 0.55µT), 51 saturation frequencies (optimised sampling schedule: -300 to 300ppm8) and SE-EPI readout (TR/TE=5s/27.2ms). T1 and T2 maps were acquired using IR-EPI (TR/TE=10s/27.22ms, 9TIs:0.013-8s) and SE-EPI (TR=5s, 10 TEs:30-160ms) sequences. For the ischaemia cohort, DWI (TR/TE=3s/27.2ms, 3 directions, b=0/1000s/mm2) was acquired for identification of the ischaemic core. Images were acquired with 0.5x0.5x1mm3 resolution across 10 slices. In addition, a high-resolution post-Gd T1-weighted image was acquired in the tumour cohort for tumour delineation.
Model-based analysis was performed using FSL’s BayCEST1,4, assuming a 3-pool exchange model (water, amide, and magnetisation transfer + Nuclear Overhauser Enhancement). T1 and T2 information can be incorporated in to the model by initialising values according to global or voxelwise estimates. Four analysis permutations were considered; (1) T1 and T2 initialised to global values (no maps); (2) T1 and T2 maps; (3) T1 map only; (4) T2 map only. APTR* was calculated from fitted amide exchange rate and concentration as previously described4,6,7. ADC was automatically generated from DWI images, with ADC threshold of 620×10−6 mm2/s used to define the ischaemic core9, with contralateral tissue manually defined. Tumour and contralateral masks were manually defined on high-resolution T1-weighted images using ITK-SNAP, and subsequently downsampled to EPI resolution. Model performance was assessed using APTR* contrast (APTR*Disease/APTR*Contralateral) and coefficient of variation (σAPTR*contrast/MeanAPTR*Contrast). Statistical differences were assessed using a Student’s t-test, with statistical significance defined as p<0.05.
Results
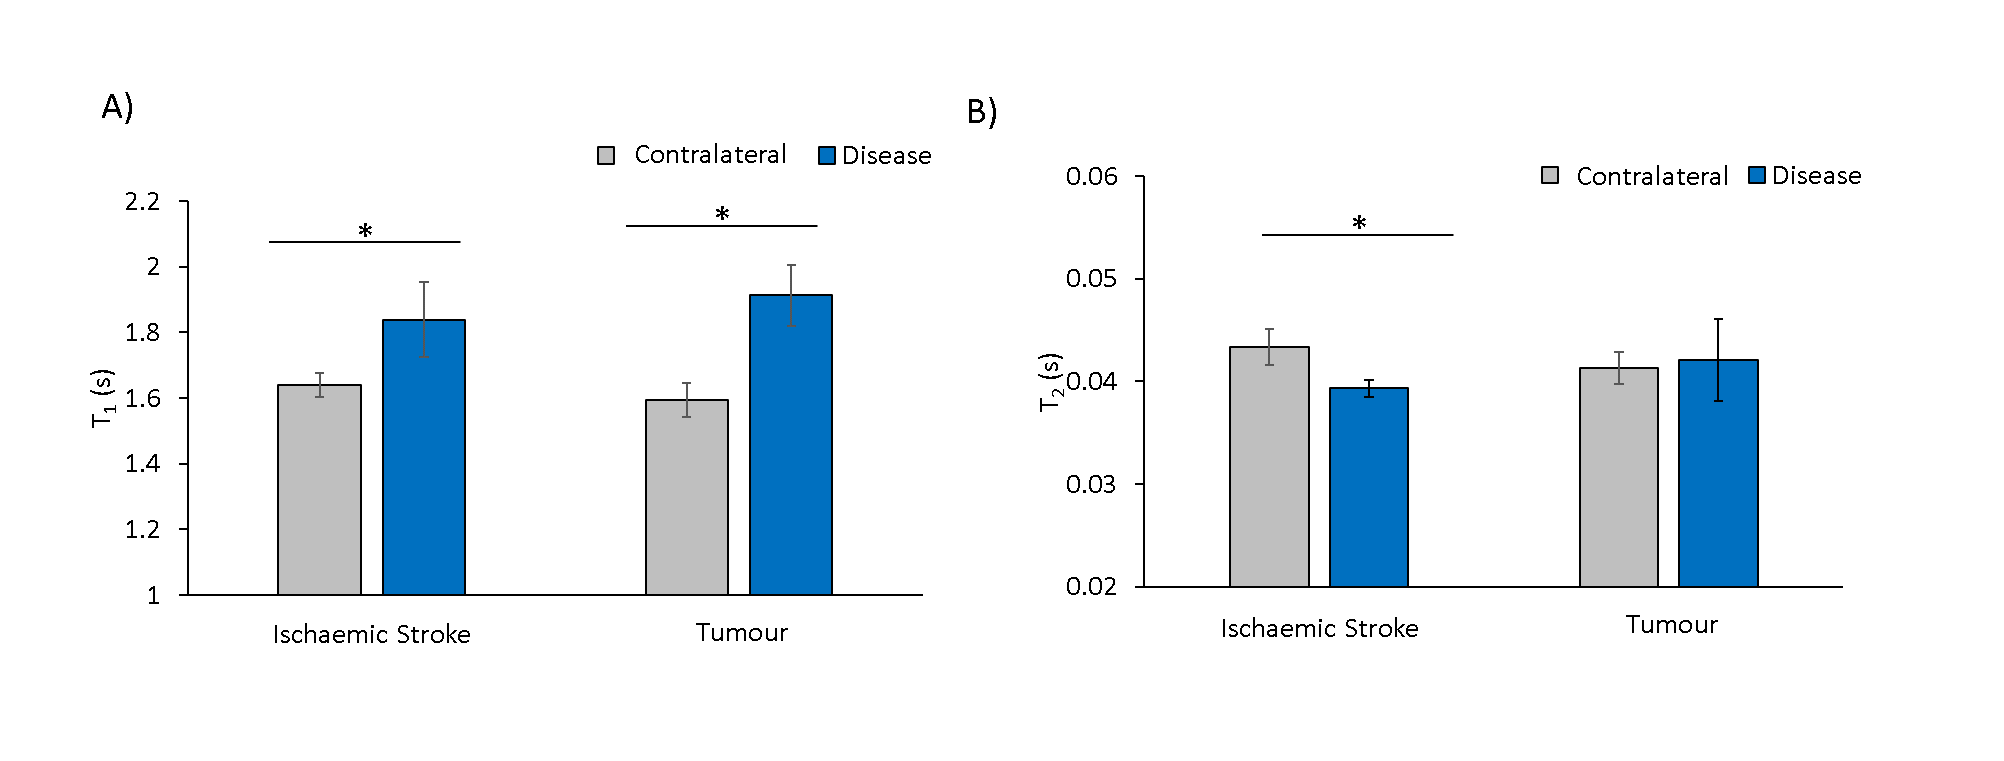
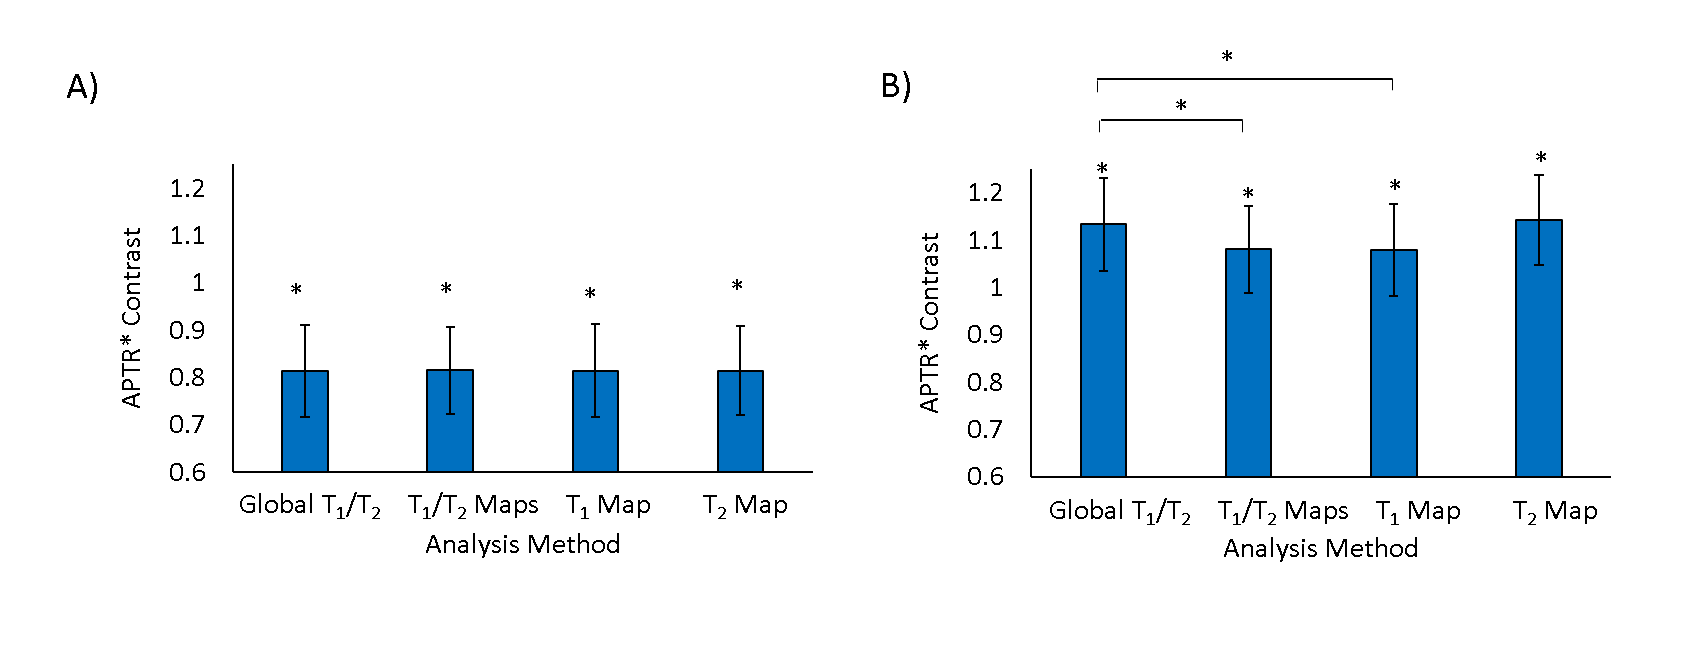
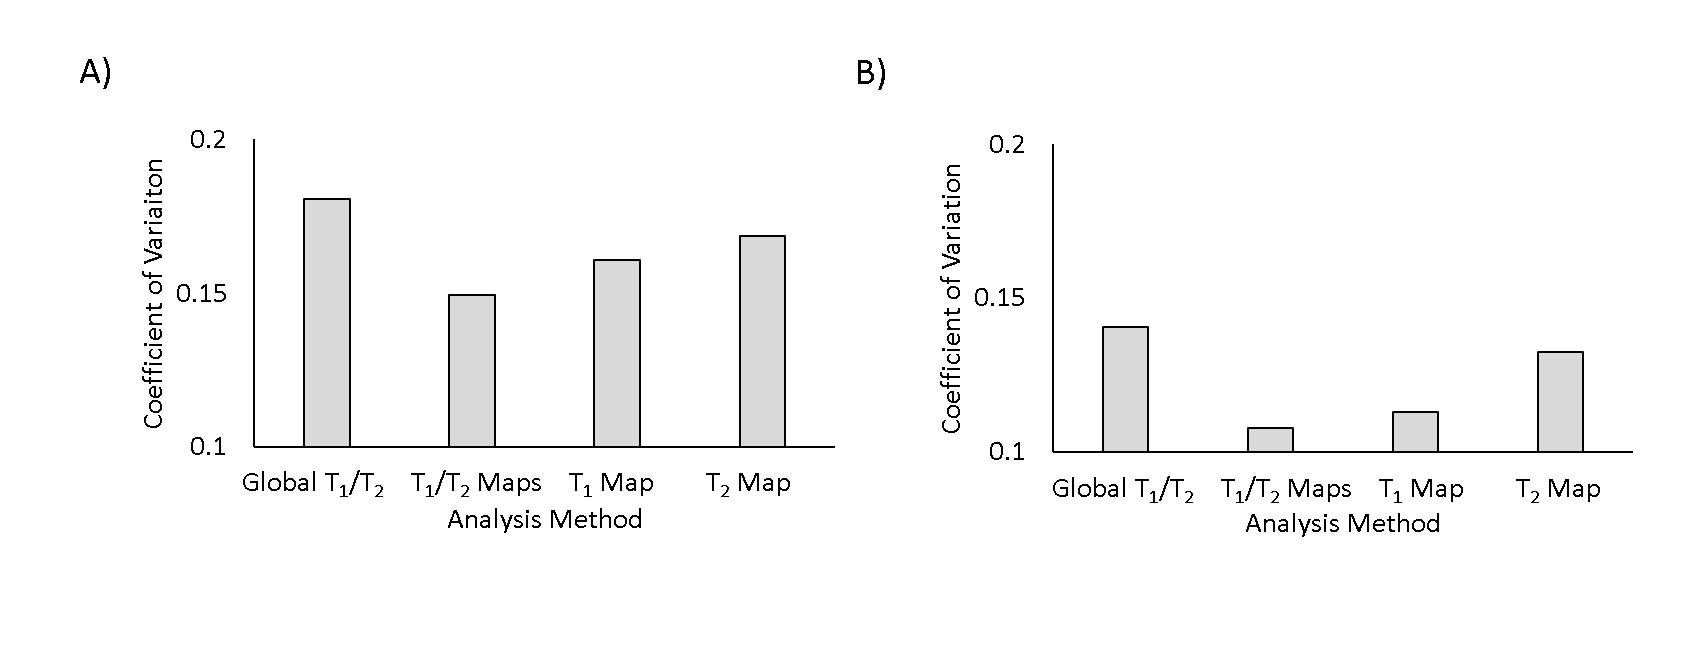
Significant increases in T1 were measured in both stroke and tumours (Fig.1). A significant reduction in T2 was measured in stroke (Fig.1), with no significant change in tumours. APTR* was significantly reduced in ischaemic tissue, and increased in tumour tissue, across all analysis methods (Fig.2). Presence of a T1 map significantly reduced APTR* contrast, while contrast remained constant across methods in stroke (Fig.2). In both diseases, the Coefficient of Variation in APTR* contrast was largest when T1 and T2 were initialised globally, and lowest when both T1 and T2 maps were provided (Fig.3).
Discussion
Results suggest that acquisition and incorporation of T1 and T2 information into model-based analysis of CEST MRI is dependent on the pathology being investigated. While T1 and T2 were both significantly altered in ischaemic tissue, prior knowledge of these parameters had little impact on APTR*, with consistent contrast across subjects. However, in tumours, where T1 elevation is significantly greater and with no alteration in T2, provision of T1 maps significantly impacted APTR* quantification. For both diseases, the coefficient of variation in APTR* contrast was lowest when both T1 and T2 information was provided. Without provision of T1 and T2 information, it is likely that the impact of alterations in T1 and T2 on Z-spectra are partially misattributed to alterations in the CEST effect.
We propose that incorporating voxelwise knowledge of T1 in to Bayesian model-based analysis improves the accuracy of APTR* quantification, particularly for larger changes in T1 such as in tumours. Without inclusion of T1 information, APTR* contrast may be overestimated in tumours. Whilst independent acquisition of T1 maps may not be as critical for ischaemic stroke, they remain useful for reducing inter-subject variability of APTR*. T2 maps may be less critical for estimation of APTR* in both diseases, but if available it is recommended they are incorporated in to analysis to further reduce variability.
Acknowledgements
This work was funded by the Oxford Cancer Imaging Centre, Cancer Research UK, and Engineering and Physical Sciences Research Council.References
[1] Xu et al., On the origins of chemical exchange saturation transfer (CEST) contrast in tumors at 9.4 T, NMR Biomed, 2014, 27(4): 406-16
[2] Scheidegger et al., Contributors to contrast between glioma and brain tissue in chemical exchange saturation transfer sensitive imaging at 3 Tesla, NeuroImage, 2014, 99: 256-268
[3] Li et al., Imaging of amide proton transfer and nuclear Overhauser enhancement in ischemic stroke with corrections for competing effects, NMR Biomed., 2014, 28(2): 200-209
[4] Chappell et al., Quantitative Bayesian Model-Based Analysis of Amide Proton Transfer MRI. MRM., 2013, 70:556-567.
[5] Chappell MA, Groves AR, Whitcher B, Woolrich MW. Variational Bayesian Inference for a Nonlinear Forward Model. IEEE Trans Signal Process., 2009, 223–236.
[6] Tee et al., Comparing difference analysis methods for quantifying the MI amide proton transfer (APT) effect in hyperacute stroke patients. NMR in Biomed., 2014, 27:1019-1029
[7] Ray et al., Determination of an optimally sensitive and specific chemical exchange saturation transfer MRI quantification metric in relevant biological phantoms. NMR in Biomed., 2016, 29:1624-1633
[8] Tee at al., Optimal sampling schedule for chemical exchange saturation transfer. MRM., 2013, 70(5):1251-1262
[9] Harston et al., Identifying the ischaemic penumbra using pH-weighted magnetic resonance imaging. Brain. 2015; 138: 36-42.
Figures