2238
In vivo imaging of Nucleus of the solitary tract at ultra-high field: a preliminary study1Alzheimer Center Limburg, Maastricht University, Maastricht, Netherlands, 2Department of Cognitive Neuroscience, Maastricht University, Maastricht, Netherlands, 3Department of Radiology, Martinos Center for Biomedical Imaging, Massachusetts General Hospital, Boston, MA, United States, 4Department of Anesthesiology, Perioperative and Pain Medicine, Brigham and Women’s Hospital, Harvard Medical School, Boston, MA, United States, 5Department of Radiology, Logan University, Chesterfield, MT, United States, 6Department of Radiology, Division of Nuclear Medicine and Molecular Imaging, Harvard Medical School, Boston, MA, United States
Synopsis
The nucleus of the solitary tract consists of a set of nuclei in medulla oblongata involved in several homeostatic systems. No method has been proposed so far to image it in vivo, due to its low contrast with standard T1 and T2-weighted methods, its small size and its position deep in the medulla. In this study we present preliminary results that indicate that NTS may be sensitive to magnetization transfer effects.
Introduction
The Nucleus of the Solitary Tract (NTS) is a complex of nuclei in the medulla oblongata that is implicated in the cardiovascular, intestinal and respiratory systems and receives vagus nerve afferents1,2. It was recently suggested that functional activation of the NTS can be imaged in response to transcutaneous vagus nerve stimulation (respiratory-gated auricular vagal afferent nerve stimulation (RAVANS))3. However, there is not yet a method for structural imaging that can definitively localize the NTS in vivo. The NTS complex includes the A2 nucleus (a rod shaped nucleus approximately 1mm thick and 6 mm long), consisting of noradrenergic neurons that accumulate neuromelanin4. Neuromelanin-rich neurons have been shown to be less prone to saturation or recover faster from saturation by Magnetization Transfer (MT) compared to surrounding grey matter5; this has been used to image other catecholaminergic nuclei6,7. No such method has been used in the NTS/A2, since the high-energy deposition of MT methods combined with the need for high spatial resolution makes this impractical with commonly available pulse sequence implementations. In this study, we employed an efficient MT-weighted sequence, consisting of a prolonged saturation pulse train interleaved with a turbo flash readout8 to image the A2 nucleus at high resolution at 7T5. In one participant, we employed RAVANS along with BOLD fMRI as a functional localizer for NTS. Our preliminary results show that hyperintensity is visible in an anatomical location expected for purported NTS, and consistent with the lack of saturation of water protons by MT shown in other neuromelanin-rich structures. The location of the hyperintensity also aligns with RAVANS-induced BOLD activation from the fMRI localizer, providing further evidence for the correct anatomical delineation of the NTS by means of high-resolution MT-weighted acquisition.Methods
MR data from 15 healthy participants (8 males, age range=25.6±4.1 years, except for one participant’s age=61) were acquired on a 7T Magnetom scanner (Siemens Healthineers, Erlangen, Germany) with a 32-channel headcoil (Nova Medical, Wilmington, MA, USA). To image the NTS, a MT-weighted Turbo Flash (MT-TFL) sequence was employed, consisting of a multi-shot 3D readout with center-out k-space sampling (TR/TE=823/4.08ms, FA=8°, voxel size=0.4x0.4x0.5mm3, TA=4:38min, 60 slices) preceded by a train of 20 off-resonant Gaussian sinc pulses (3.37μT at 6.72ppm and bandwidth=250Hz); the acquisition was repeated without the MT saturation train. Additionally, an MP2RAGE9 (TR/TE=5000/2.21ms, FA=5°/3°, voxel size=0.7x0.7x0.7mm3, TA=9:42min, 154 slices) was acquired. In one participant (male, 61), a custom-made RAVANS setup was employed to provide stimulation, while obtaining a T2*-weighted EPI (TR/TE=2000/17ms, FA=90°, voxel size=1.25x1.25x1.25mm3, GRAPPA=3, partial Fourier=6/8, 50 slices). The stimulation consisted of a TENS-dental stimulator that provided pulses 200μs long in a pulse train maximally 0.5s long, gated for exhalation, through custom-made electrodes to the concha of the left ear. The fMRI data were motion- and distortion-corrected and denoised in FSL with FLIRT, TOPUP and FIX, respectively and masked for brainstem. The stimulation timing and duration was convolved with a double gamma and employed as a regressor in subsequent GLM analysis. The results were projected to the NTS scan.Results
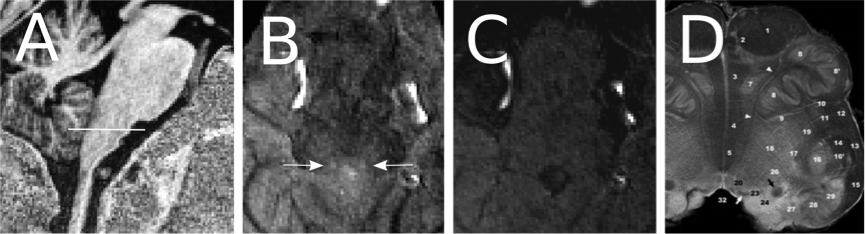
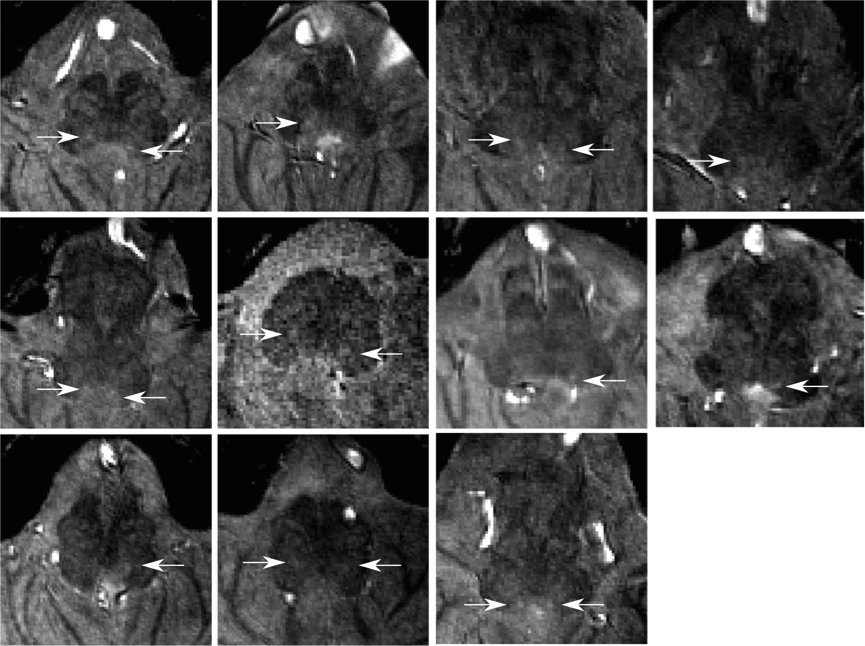
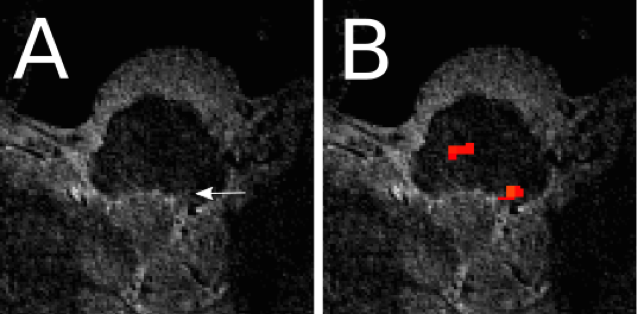
A hyperintensity, specific to the MT scan, was observed in the location consistent with the anatomical description of the NTS (Figure 1) in 11 of 15 participants, though not always bilaterally (Figure 2) (mean volume=2.61mm3, SD=0.9mm3). Two scans were motion corrupted and in two no hyperintensity could be detected. In the one participant that received RAVANS as functional localizer, a set of voxels with Z>2 (8 voxels, peak Z=3.09) were found at the position of the hyperintensity, ipsilateral to the ear stimulated (as expected since the vagus nerve does not decussate) (Figure 3). Additionally, clusters were observed in the contralateral purported NTS and at the approximate position of olivary and arcuate nuclei.Discussion
Our high resolution, efficient energy deposition MT-TFL sequence showed a hyperintensity consistent with the NTS region at 7T that co-localized with RAVANS activation. This was feasible for most (75%) participants of the group. With some additional optimization, these preliminary results indicate that NTS imaging will be feasible in vivo. To improve NTS contrast for robust detectability, MT parameters should be systematically set with regards to saturation frequency, intensity and recovery time, as those may well differ depending on the precise chemical makeup of the specific target regions.Conclusion
NTS imaging is of high interest due to its involvement in several homeostatic systems. Our preliminary results show promise for NTS imaging in the future.Acknowledgements
This work is supported by an NWO VENI [016.158.084] to HILJ and NWO VIDI [016. 178.052] to BA.References
1. Totola, L.T., et al., Commissural nucleus of the solitary tract regulates the antihypertensive effects elicited by moxonidine. Neuroscience, 2013. 250: p. 80-91.
2. Sclocco, R., et al., Neuroimaging brainstem circuitry supporting cardiovagal response to pain: a combined heart rate variability/ultrahigh-field (7 T) functional magnetic resonance imaging study. Philosophical Transactions of the Royal Society of London A: Mathematical, Physical and Engineering Sciences, 2016. 374(2067).
3. Garcia, R.G., et al., Modulation of brainstem activity and connectivity by respiratory-gated auricular vagal afferent nerve stimulation in migraine patients. Pain, 2017.
4. Naidich, TP, BN Delman, AG Sorensen, Duvernoy's Atlas of the Human Brainstem and Cerebellum, ed. Springer. 2009.
5. Priovoulos, N., et al., High-resolution in vivo imaging of human locus coeruleus by magnetization transfer MRI at 3T and 7T. NeuroImage, 2017.
6. Trujillo, P., et al. High-resolution quantitative imaging of the substantia nigra. in Engineering in Medicine and Biology Society (EMBC), 2015 37th Annual International Conference of the IEEE. 2015.
7. Chen, X., et al., Simultaneous imaging of locus coeruleus and substantia nigra with a quantitative neuromelanin MRI approach. Magn Reson Imaging, 2014. 32(10): p. 1301-6.
8. Mougin, O., et al., High-resolution imaging of magnetisation transfer and nuclear Overhauser effect in the human visual cortex at 7 T. NMR Biomed, 2013. 26(11): p. 1508-17.
9. Marques, J.P., et al., MP2RAGE, a self bias-field corrected sequence for improved segmentation and T1-mapping at high field. Neuroimage, 2010. 49(2): p. 1271-81.
Figures