2237
Ammonia-weighted imaging by chemical exchange saturation transfer – MRI at 3 THelge Jörn Zöllner1,2, Markus Butz1, Gerald Kircheis3, Stefan Klinker4, Dieter Häussinger3, Benjamin Schmitt5, Alfons Schnitzler1, and Hans-Jörg Wittsack2
1Institute of Clincial Neuroscience and Medical Psychology, Heinrich Heine University, Düsseldorf, Germany, 2Department of Diagnostic and Interventional Radiology, Heinrich Heine University, Düsseldorf, Germany, 3Department of Gastroenterology, Hepatology and Infectiology, Heinrich Heine University, Düsseldorf, Germany, 4Institute of Physical Biology, Heinrich Heine University, Düsseldorf, Germany, 5160 Herring Road, Siemens Healthcare Pty Ltd., Macquarie Park NSW 2113, Australia
Synopsis
Chemical exchange saturation transfer (CEST) is an advanced MR contrast, which is sensitive to metabolic parameters as pH or protein content. The present study shows the ammonia-sensitivity of amide proton CEST imaging at a fixed pH value. The in vivo applicability is tested in a population of patients suffering from hepatic encephalopathy (HE), which is linked to ammonia accumulation within the brain. In HE, the CEST signal is especially reduced within occipital and cerebral regions. This reduction may be related to increased ammonia levels in HE patients.
Introduction
Hepatic encephalopathy (HE) is a common complication in patients with liver cirrhosis. It comprises a variety of neuropsychiatric and motor symptoms1 and leads to an increase of ammonia within the brain2. Therefore, it is desirable to create 3D metabolic images of the whole brain to reflect the content of ammonia non-invasively. The present study tests the feasibility of chemical exchange saturation transfer imaging (CEST) to display changes in protein CEST signal depending on the content of ammonia.Methods
In vivo acquisition was performed on a clinical 3 T whole-body MRI scanner (Siemens MAGNETOM Trio A TIM System, Siemens Healthcare GmbH, Erlangen, Germany) using a 12-channel head matrix coil. A prototype 3D gradient echo sequence (echo time TE=3.06ms; repetition time TR=1390ms; FA=10°; FoV=(230x230)mm2; 24 slices; 5mm slice thickness; 1mm gap) with a pre-saturation block (5 gaussian shaped pulses; pulse duration PD=100ms; inter pulse delay IPD=100ms; 22 equidistant frequency offsets between ±5ppm; B1=1.5µT; 3s break) was used for in vivo CEST imaging and B0 correction via WASSR3 (changed parameters: 1 gaussian shaped pulse; PD=5ms; IPD=6ms; equidistant offset ±1ppm; B1=0.3µT). B1 correction was performed using a one-point correction method4 with a relative B1 map5. In vitro measurements were performed within the steady state, using 48 gaussian shaped pulses at 44 equidistant frequency offsets between ±5ppm. In addition, nine different B1 amplitudes (B1 = 0.4, 0.7, 1, 1.3, 1.4, 1.5, 1.6, 1.7, 2 µT) were used for B1 correction4. We evaluated our approach in a two-step procedure: First, bovine serum albumin (BSA) solutions (2.5%) and brain samples consisting of one part of diluted and homogenized pig brain tissue (tissue:water ≡ 1:2) and two parts of buffered ammonia solutions at fixed pH=7 were tested with varying ammonia concentrations ([0, 0.5, 5, 50, 500] µM, [5, 50, 500] mM). Fluorescence spectroscopy was used to determine possible changes in protein folding in the BSA phantom. In a second step, 32 participants (11 female; mean age ± standard deviation: 58 ± 6.6 years) were examined after written informed consent, including 14 healthy control, 7 minimal HE (mHE), and 9 HE I patients, graded according to the West-Haven criteria. Anatomical imaging for segmentation purpose and relative B1 correction4 were performed. Post processing was realised with an in-house written MATLAB script (MathWorks Inc, Natrick, MA, USA). All images were smoothed by Gaussian kernel and normalized to S0. Interpolation of CEST and WASSR z-spectra was done with MATLAB interp1 algorithm (step size of h=0.001). CEST z-spectra were shifted by the calculated WASSR offset to reduce B0 inhomogeneity effects. The magnetization transfer ratio asymmetry (MTRasym) was determined for amide protons around (3.5 ± 0.5) ppm. The in vivo measurements were coregistered onto the first offset image (S0) with SPM12 (Wellcome Trust Centre for Neuroimaging, University College London, UK) to reduce movement artefacts. In vivo 3D MTRasym maps were coregistered onto the anatomical images and normalized to MNI-152-space to create group atlases. MATLAB students’ t-test was used for statistics.Results
In the phantom measurements the mean MTRasym value decreases significantly with increasing ammonia concentrations (Figure 1 & Figure 2). No protein unfolding was visible for concentrations <50 mM (data not shown). Representative slices of the group MTRasym atlases are depicted in Figure 3, showing that the MTRasym values within the representative slice of the control, mHE and HE patient decrease with severity of HE. The mean MTRasym values within the whole cerebellum decreased significantly from 0.9 ± 1.1 % (control), 0.8 ± 1 % (mHE) to 0.6 ± 0.7 % (HE I).Discussion
The measurements revealed a significant decrease of the CEST signal with increasing concentration of ammonia within the phantom. Possible confounders to this effect are reduction of water T2 values6 due to ammonia as it is known to suppress MR water signal or small changes in protein structure7. In the in vivo measurements in patients with HE a decrease in the MTRasym signal occurred in comparison to healthy controls, which may be due to ammonia uptake or protein aggregation in astrocytes8.Conclusion
The Chemical Saturation Transfer (CEST) signal shows an ammonia concentration dependent contrast, which allows for investigations of patients with hepatic encephalopathy. Future investigations with larger patient groups should confirm the current findings and may allow analysing regional alterations within the HE patient brains.Acknowledgements
This study was supported by the Sonderforschungsbereich (SFB) 974 (TP B07) of the Deutsche Forschungsgemeinschaft (DFG).References
- Häussinger D, Blei AT. Hepatic encephalopathy. In: Textbook of Hepatology. Wiley-Blackwell Publ.; 2007:728-760.
- Lockwood AH, Yap EW, Wong WH. Cerebral ammonia metabolism in patients with severe liver disease and minimal hepatic encephalopathy. J Cereb Blood Flow Metab Off J Int Soc Cereb Blood Flow Metab. 1991;11(2):337-341. doi:10.1038/jcbfm.1991.67.
- Kim M, Gillen J, Landman BA, Zhou J, van Zijl PCM. WAter Saturation Shift Referencing (WASSR) for chemical exchange saturation transfer experiments. Magn Reson Med. 2009;61(6):1441-1450. doi:10.1002/mrm.21873.
- Windschuh J, Zaiss M, Meissner J-E, et al. Correction of B1-inhomogeneities for relaxation-compensated CEST imaging at 7 T. NMR Biomed. 2015;28(5):529-537. doi:10.1002/nbm.3283.
- Sabati M, Maudsley AA. Fast and high-resolution quantitative mapping of tissue water content with full brain coverage for clinically-driven studies. Magn Reson Imaging. 2013;31(10):1752-1759. doi:10.1016/j.mri.2013.08.001.
- Rabenstein DL, Fan S. Proton nuclear magnetic resonance spectroscopy of aqueous solutions: complete elimination of the water resonance by spin-spin relaxation. Anal Chem. 1986;58(14):3178-3184. doi:10.1021/ac00127a057.
- Goerke S, Zaiss M, Kunz P, et al. Signature of protein unfolding in chemical exchange saturation transfer imaging. NMR Biomed. 2015;28(7):906-913. doi:10.1002/nbm.3317.
- Norenberg MD. The role of astrocytes in hepatic encephalopathy. Neurochem Pathol. 1987;6(1-2):13-33.
Figures
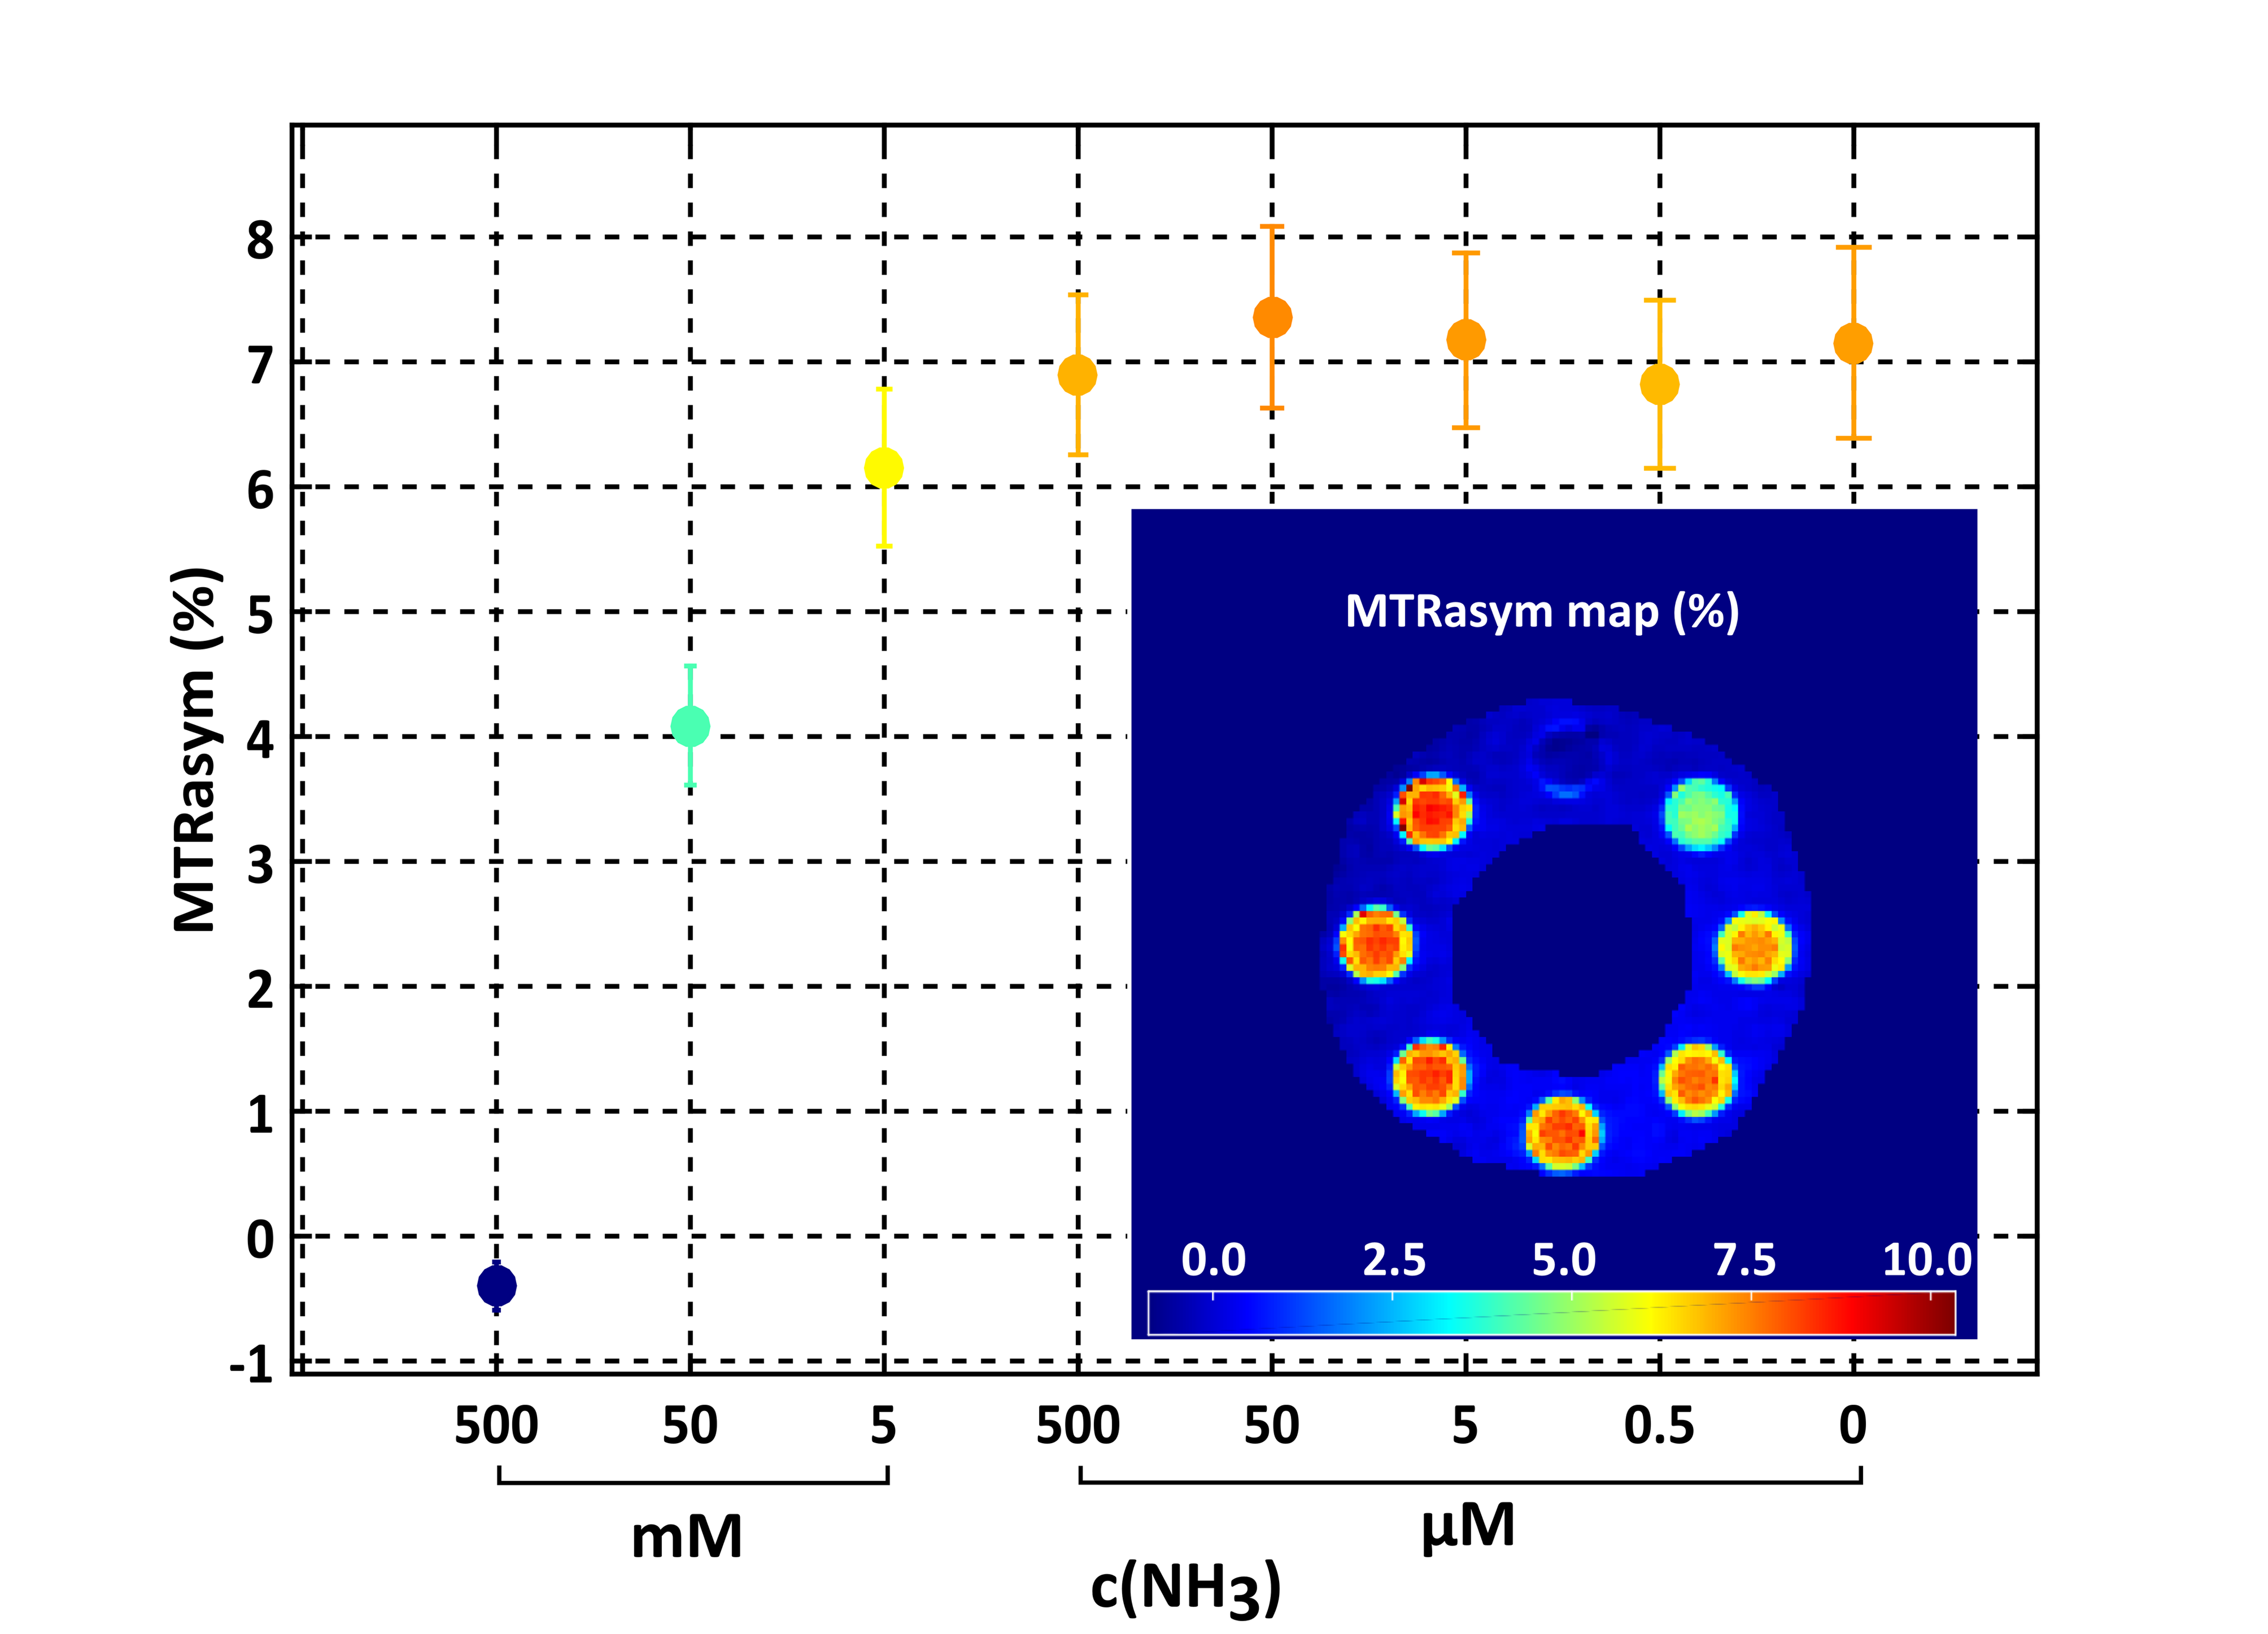
Concentration dependency plot of the measured MTRasym (3.5 ±
0.5 ppm) values of 2.5
% BSA solution with different ammonia concentrations. B1-contrast corrected MTRasym
(3.5 ± 0.5 ppm)
map of 2.5 % BSA solution with different ammonia concentrations. All
calculations were performed with nominal B1,nom = 1.5 µT.
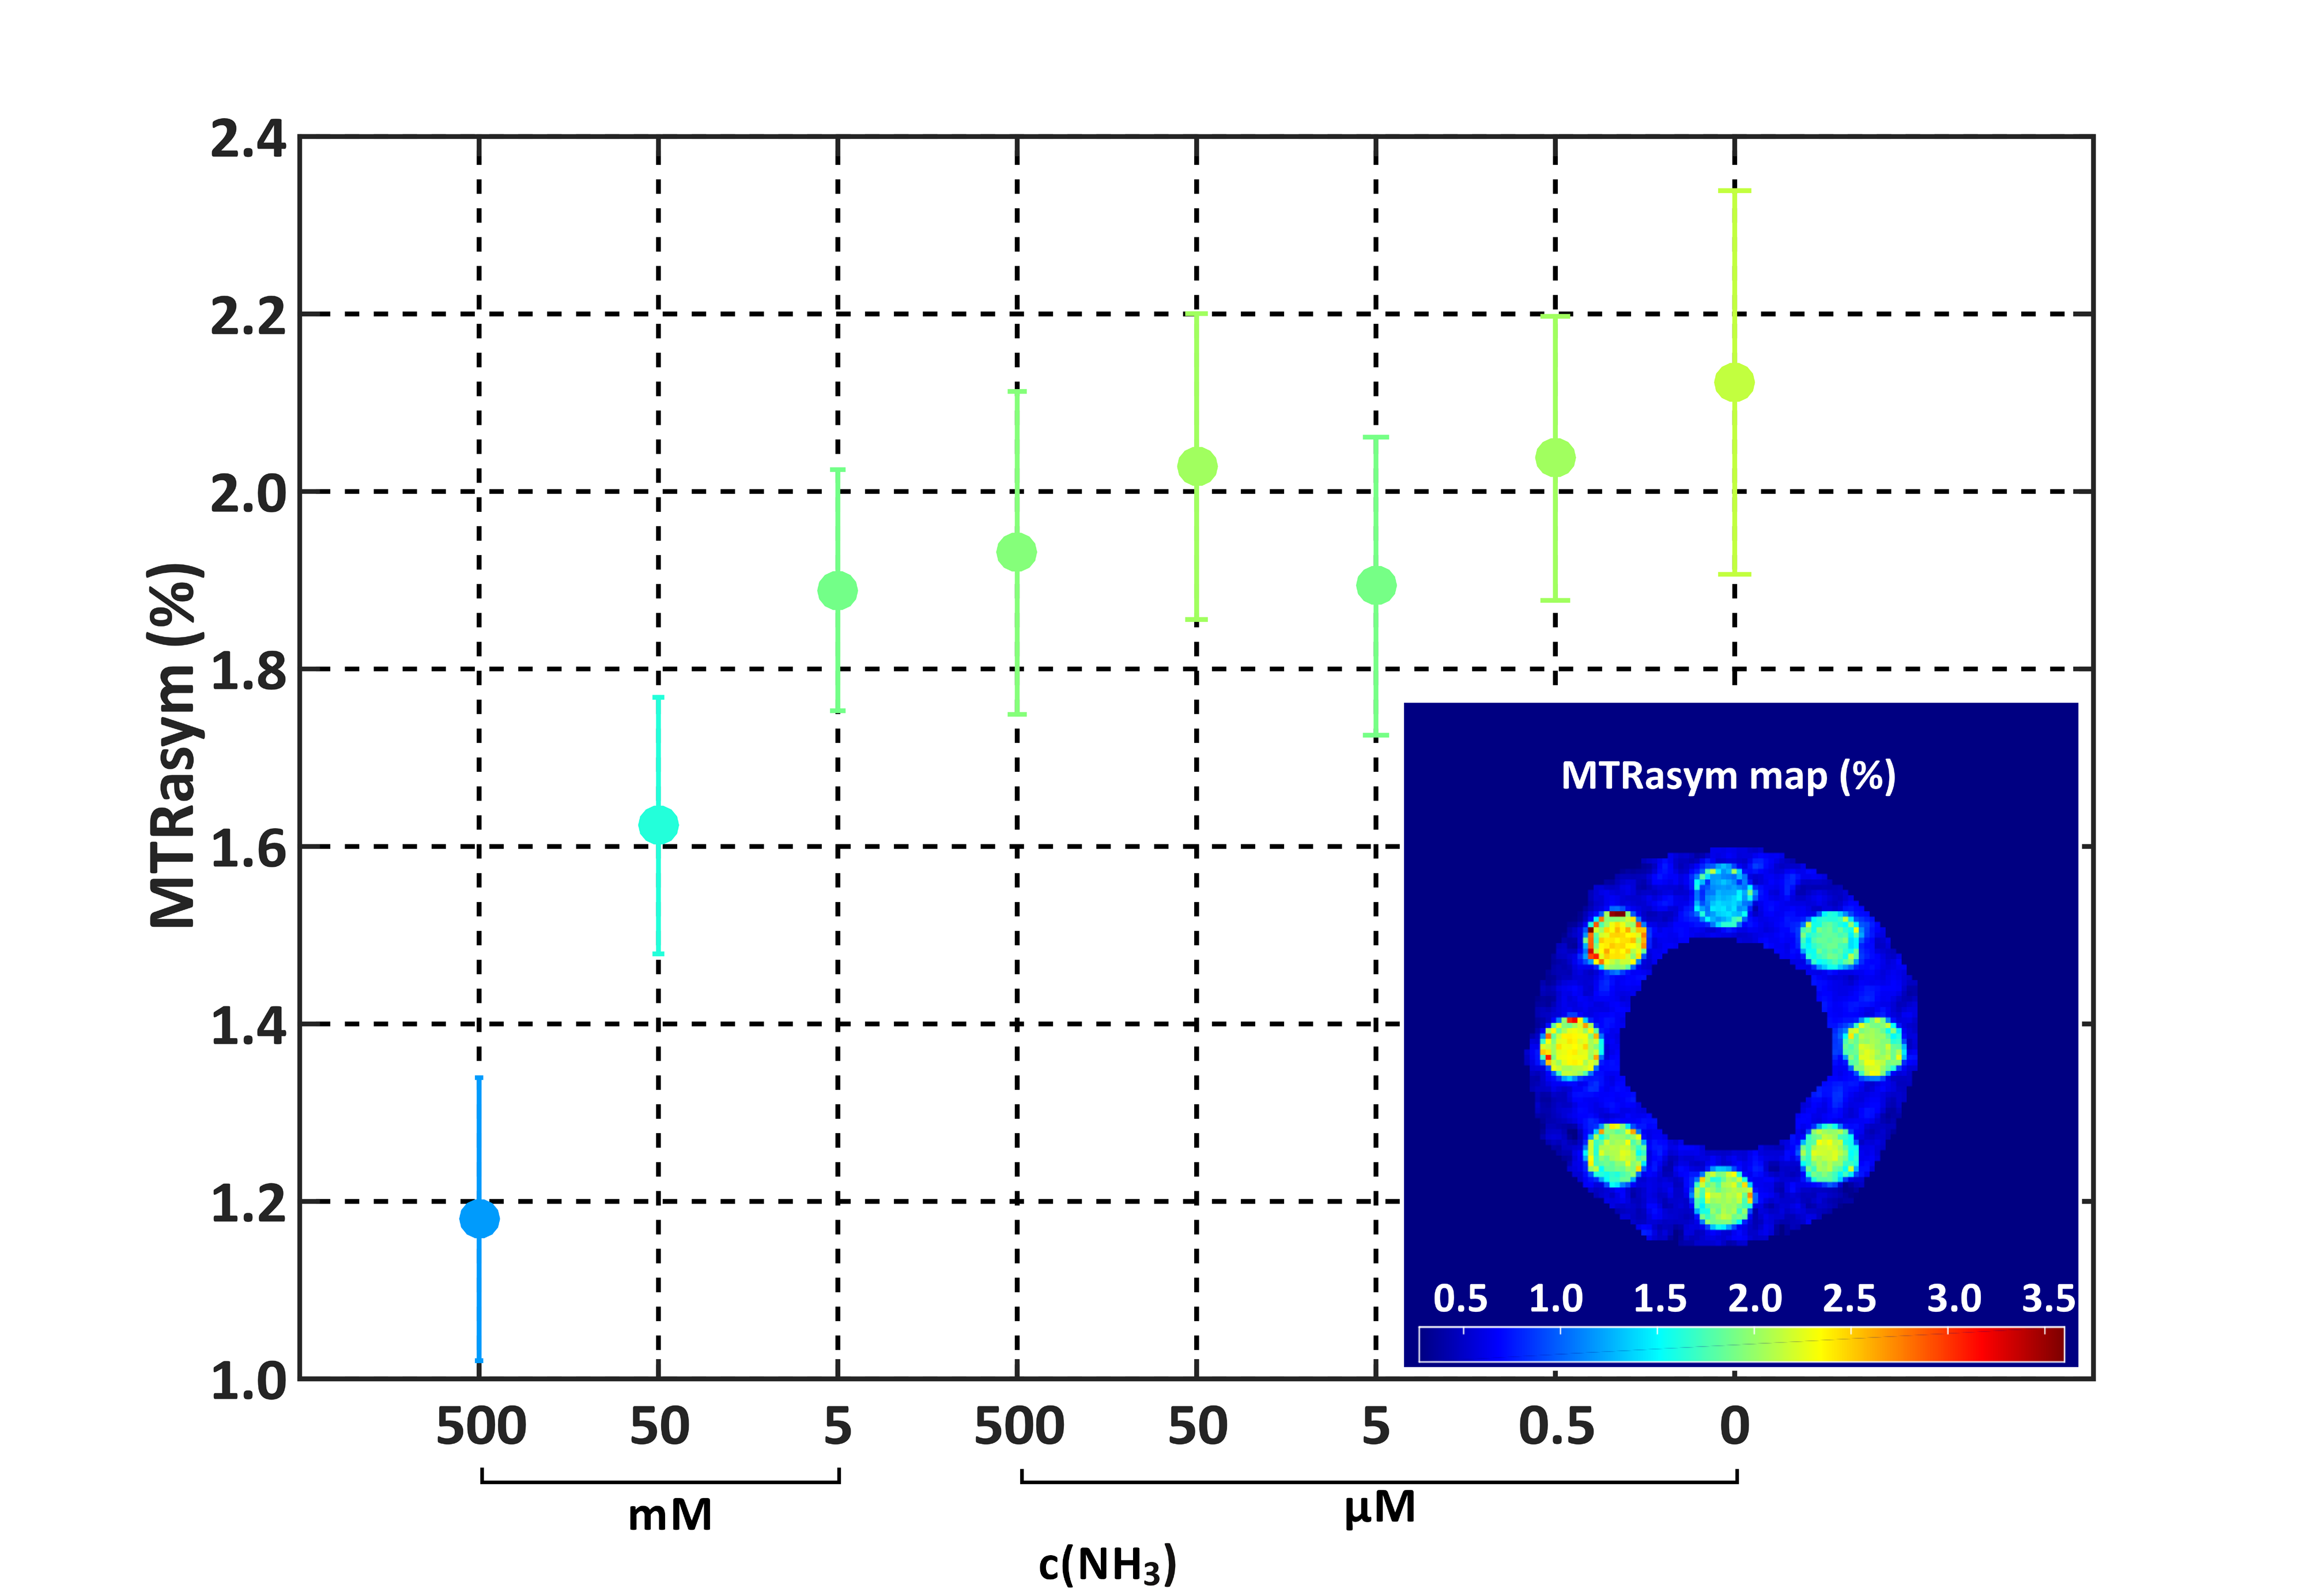
Concentration dependency plot of the measured B1-contrast
corrected MTRasym (3.5 ± 0.5 ppm) values of the pig brain tissue homogenates.
Calculated B1-contrast corrected MTRasym (3.5 ±
0.5 ppm) map. All
calculations were performed with nominal B1,nom = 1.5 µT.
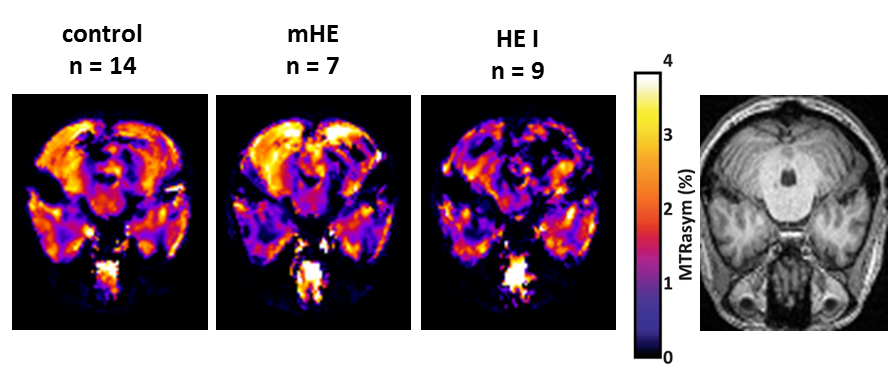
In vivo B1-contrast corrected MTRasym (3.5 ± 0.5
ppm) mean atlases with nominal B1,nom
= 1.5 µT of patients with different severities of HE and control group.
The subclinical patients are graded using critical flicker frequency (CFF) and psychometric testing, while the
HE I patients are rated according to West-Haven-Criteria.
Assumed disease severity increases from left to right.
The corresponding anatomical image is depicted on the right hand side.