2234
Concentration and relaxation rate independent clinical pH-weighted metabolic imaging at 3T using pulsed radiofrequency chemical exchange saturation transfer spin-and-gradient-echo echoplanar imaging (CEST-SAGE-EPI)1UCLA Brain Tumor Imaging Laboratory, Center for Computer Vision and Imaging Biomarkers, Department of Radiological Sciences, University of California, Los Angeles, Los Angeles, CA, United States, 2Department of Bioengineering, University of California, Los Angeles, Los Angeles, CA, United States
Synopsis
Noninvasive pH measurement with chemical exchange saturation transfer (CEST) MRI often suffers from various confounding factors. In this study, we investigate the feasibility of using a “ratiometric method” to obtain tissue relaxation rates and concentration independent pH-weighted MR image contrast at clinical field strengths using short RF saturation pulse trains and a multi-echo echoplanar readout. Results from numerical simulation and phantom experiments indicate that the new metric R(Δω1,Δω2) has an approximately linear relationship with pH, and is not sensitive to water relaxation rates or amino acid concentration. This approach will be highly valuable for investigating metabolic changes in many diseases.
Introduction
Decrease in tissue pH is associated with many diseases including ischemic stroke, cancer, and seizure disorders1. Noninvasive pH measurement with chemical exchange saturation transfer (CEST) MRI can be challenging due to a variety of confounding factors. In this study, we investigate the feasibility of using a “ratiometric method” to obtain tissue relaxation rates and concentration independent pH-weighted MR image contrast at clinical field strengths using short RF saturation pulse trains and a multi-echo echoplanar readout.Methods
Theory: A new metric $$$R(\Delta\omega_1,\Delta\omega_2)$$$ was calculated as the ratio of two inverse Z values2 (Z is the normalized magnetization) at two different offset frequencies $$$\Delta\omega_1$$$ and $$$\Delta\omega_2$$$, normalized with respect to a reference frequency $$$\Delta\omega_{ref}$$$:
$$R(\Delta\omega_1,\Delta\omega_2) = \frac{Z(\Delta\omega_2)\left( Z(\Delta\omega_{ref}) - Z(\Delta\omega_1)\right)}{Z(\Delta\omega_1)\left( Z(\Delta\omega_{ref}) - Z(\Delta\omega_2)\right)}$$
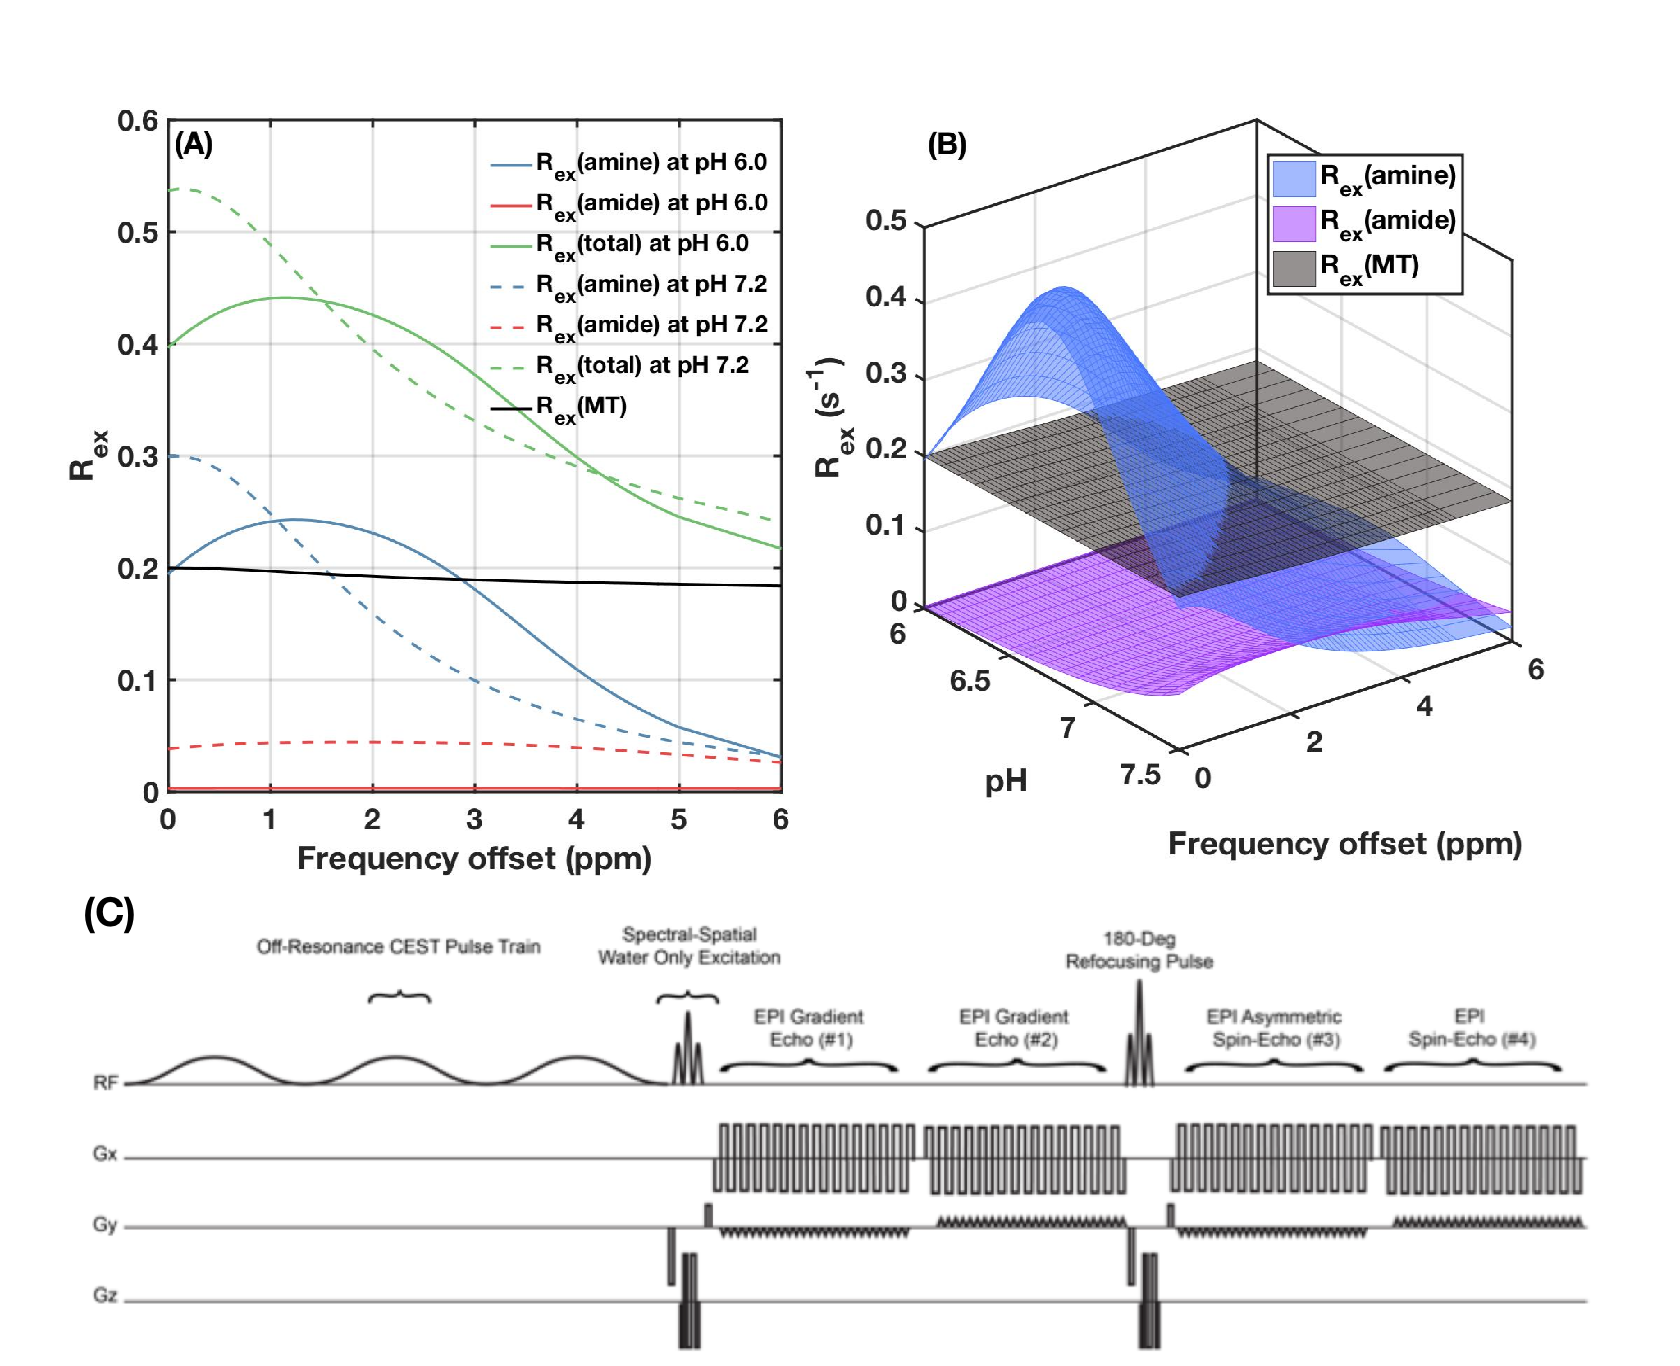
The dependency of $$$R(\Delta\omega_1,\Delta\omega_2)$$$ on factors other than pH are mitigated by: (1) normalization of the inverse Z value with respect to a reference frequency to reduce the dependency on transverse water relaxation T2w and macromolecule magnetization transfer (MT) effects; (2) use of short and high amplitude saturation pulses to ensure much stronger saturation effects on fast exchanging amine protons and lower effects on slower exchanging proton groups (Figure 1(A)(B)); (3) cancellation of longitudinal water relaxation T1w and concentration effects through calculation of a ratio of inverse Z values. Simulation: Numerical simulation was performed on a four-pool chemical exchange system with bulk water pool, macromolecular bound water pool, amine proton pool, and amide proton pool. Ratiometric CEST values were calculated from the simulated spectra. The dependencies of $$$R(\Delta\omega_1,\Delta\omega_2)$$$ on water relaxation rates, amine and amide proton pool sizes, MT effect and saturation pulse amplitudes were subsequently investigated. Phantom experiments: Phantoms with different glutamine (amine) and protein (amide) concentrations were prepared with varying pH. A CEST echoplanar (EPI) sequence with multiple spin-and-gradient echo (SAGE) readouts (Figure 1(C)) was applied using three 100ms Gaussian saturation pulses4. $$$R(\Delta\omega_1,\Delta\omega_2)$$$ values were calculated with different MRI acquisition parameters (B1=3μT/6μT), different choice of offset frequencies: $$$\Delta\omega_1 / \Delta\omega_2$$$ = 3.0ppm/3.5ppm, 3.0ppm/3.8ppm, and mean(2.8-3.0ppm)/mean(3.8-4.0ppm) and different reference frequencies (6.0ppm or 20.0ppm), to evaluate the sensitivity and signal-to-noise ratio, and to find the optimum metric formulation. In vivo MRI: One healthy volunteer and one glioma patient were scanned with the same sequence and parameters as the phantom experiments. The pH maps were calculated from the phantom $$$R(\Delta\omega_1,\Delta\omega_2)$$$-pH calibration.
Results
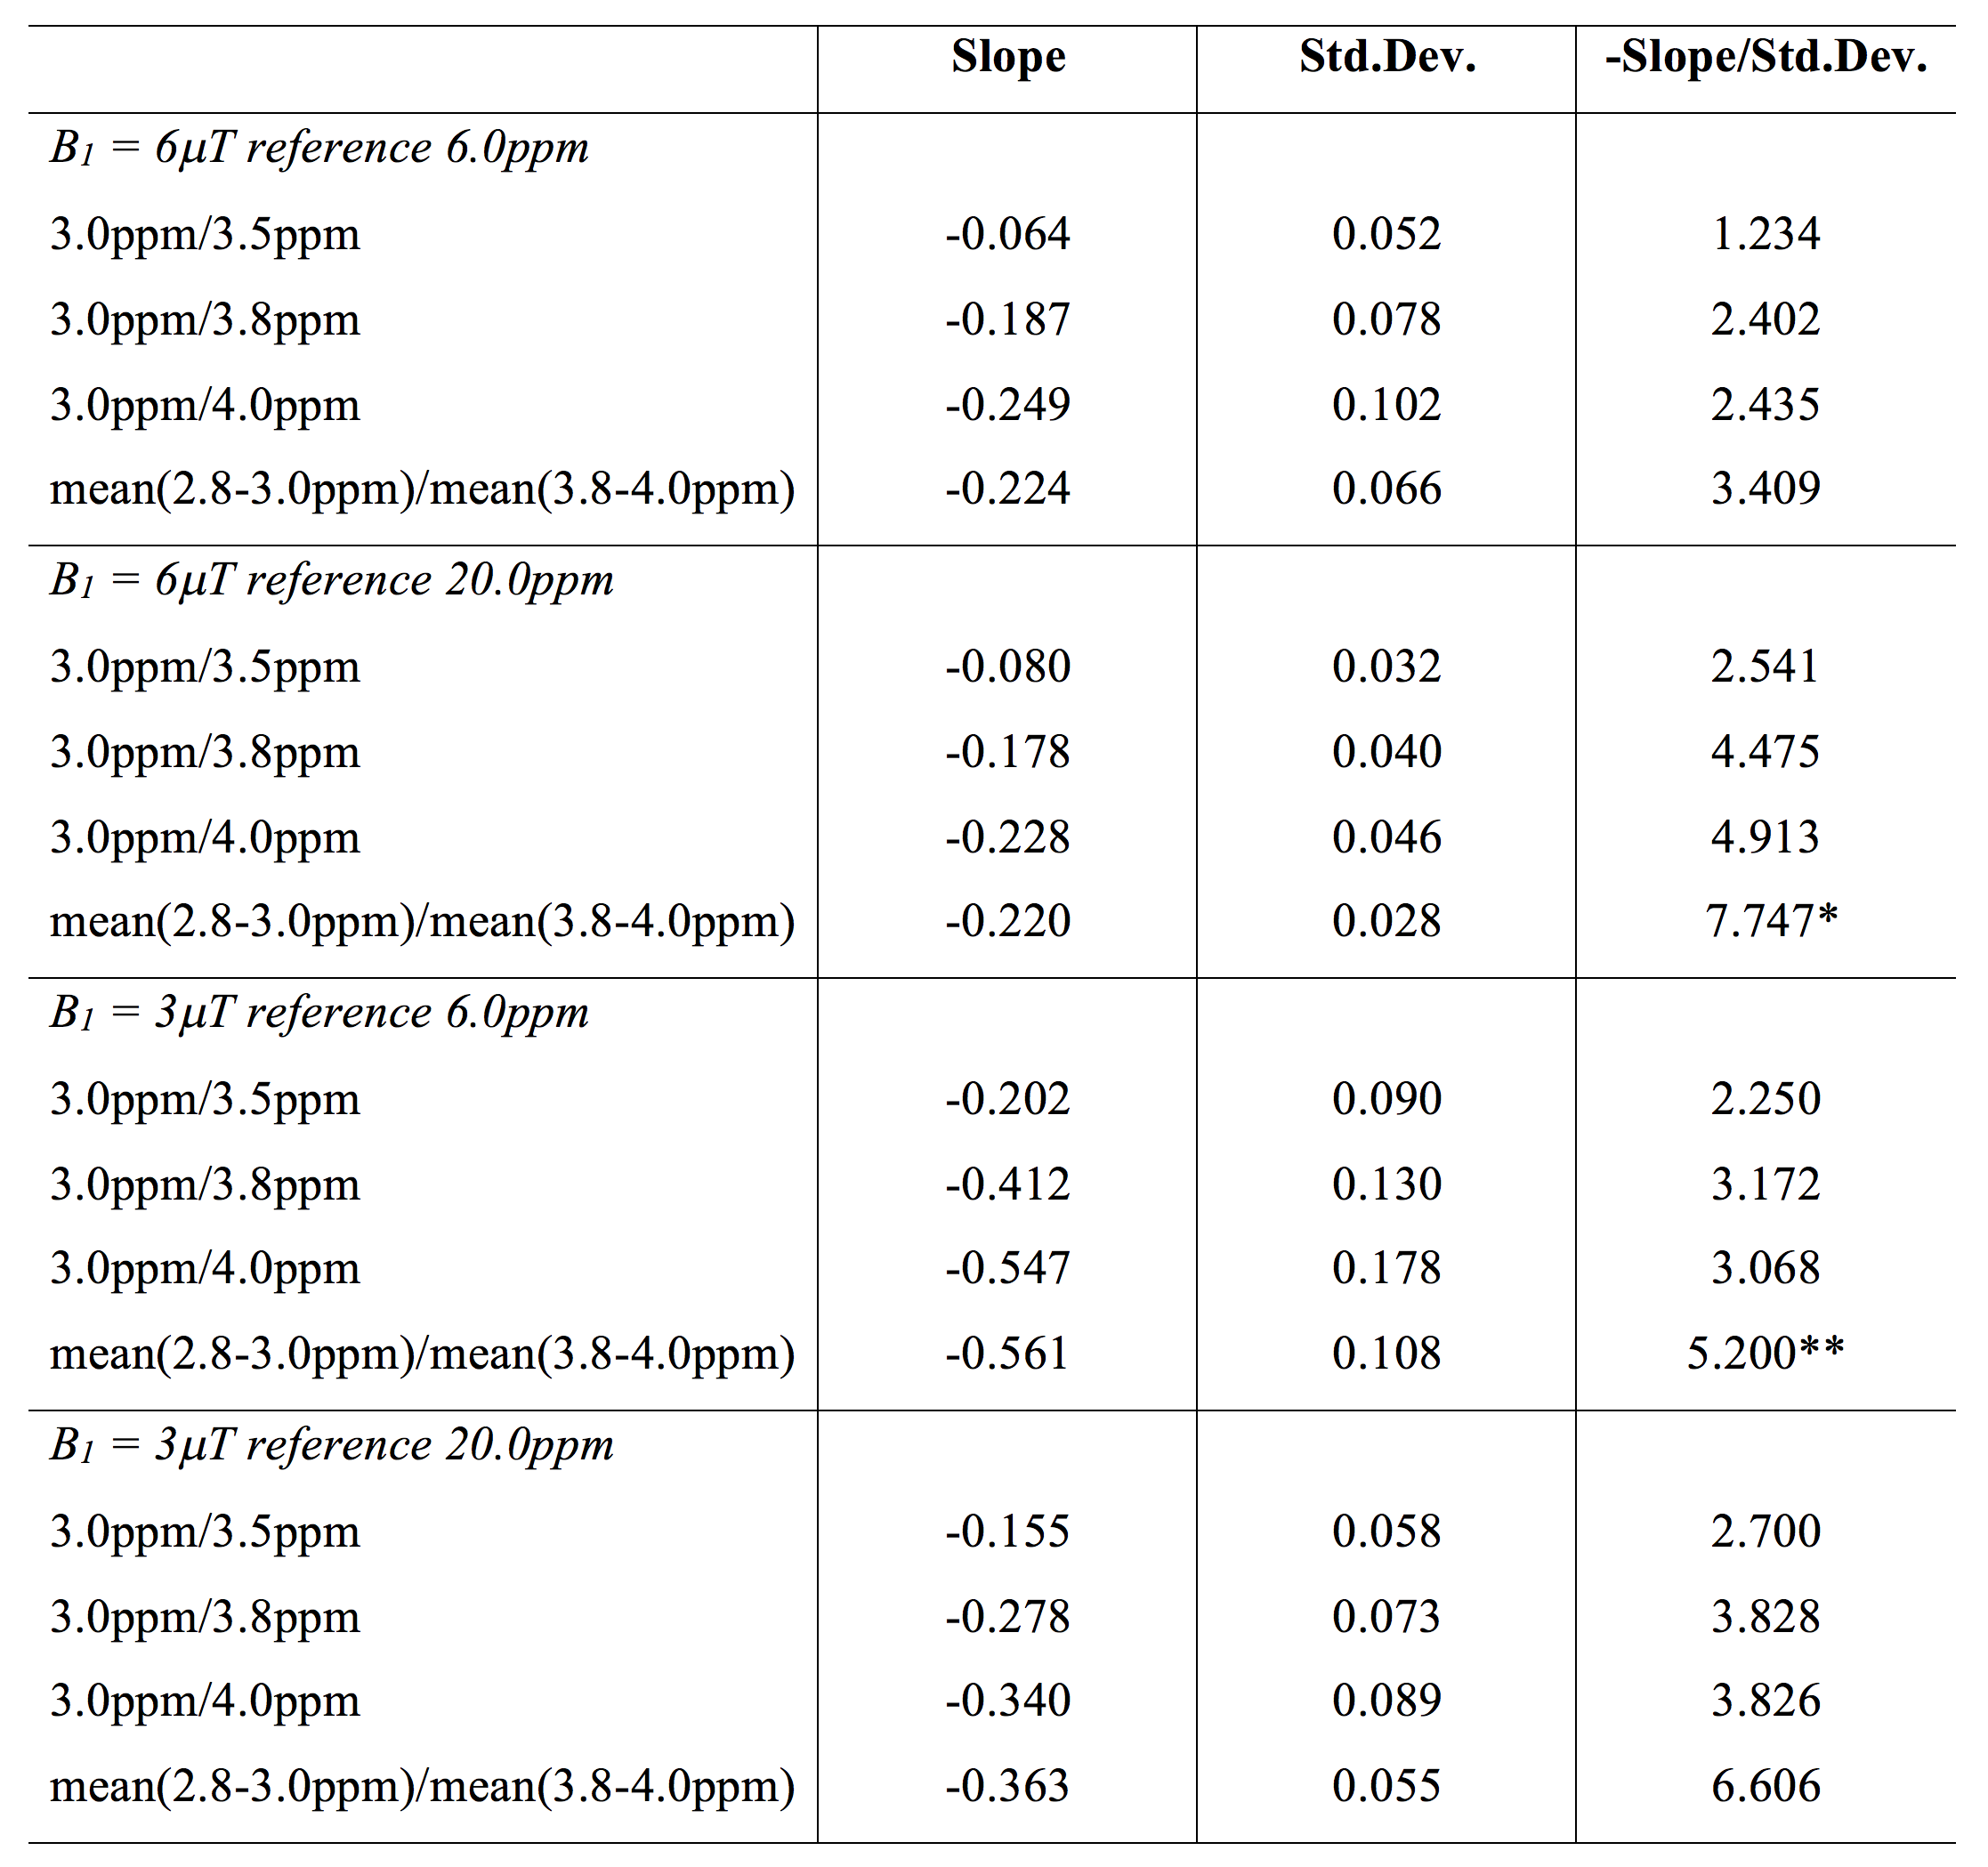
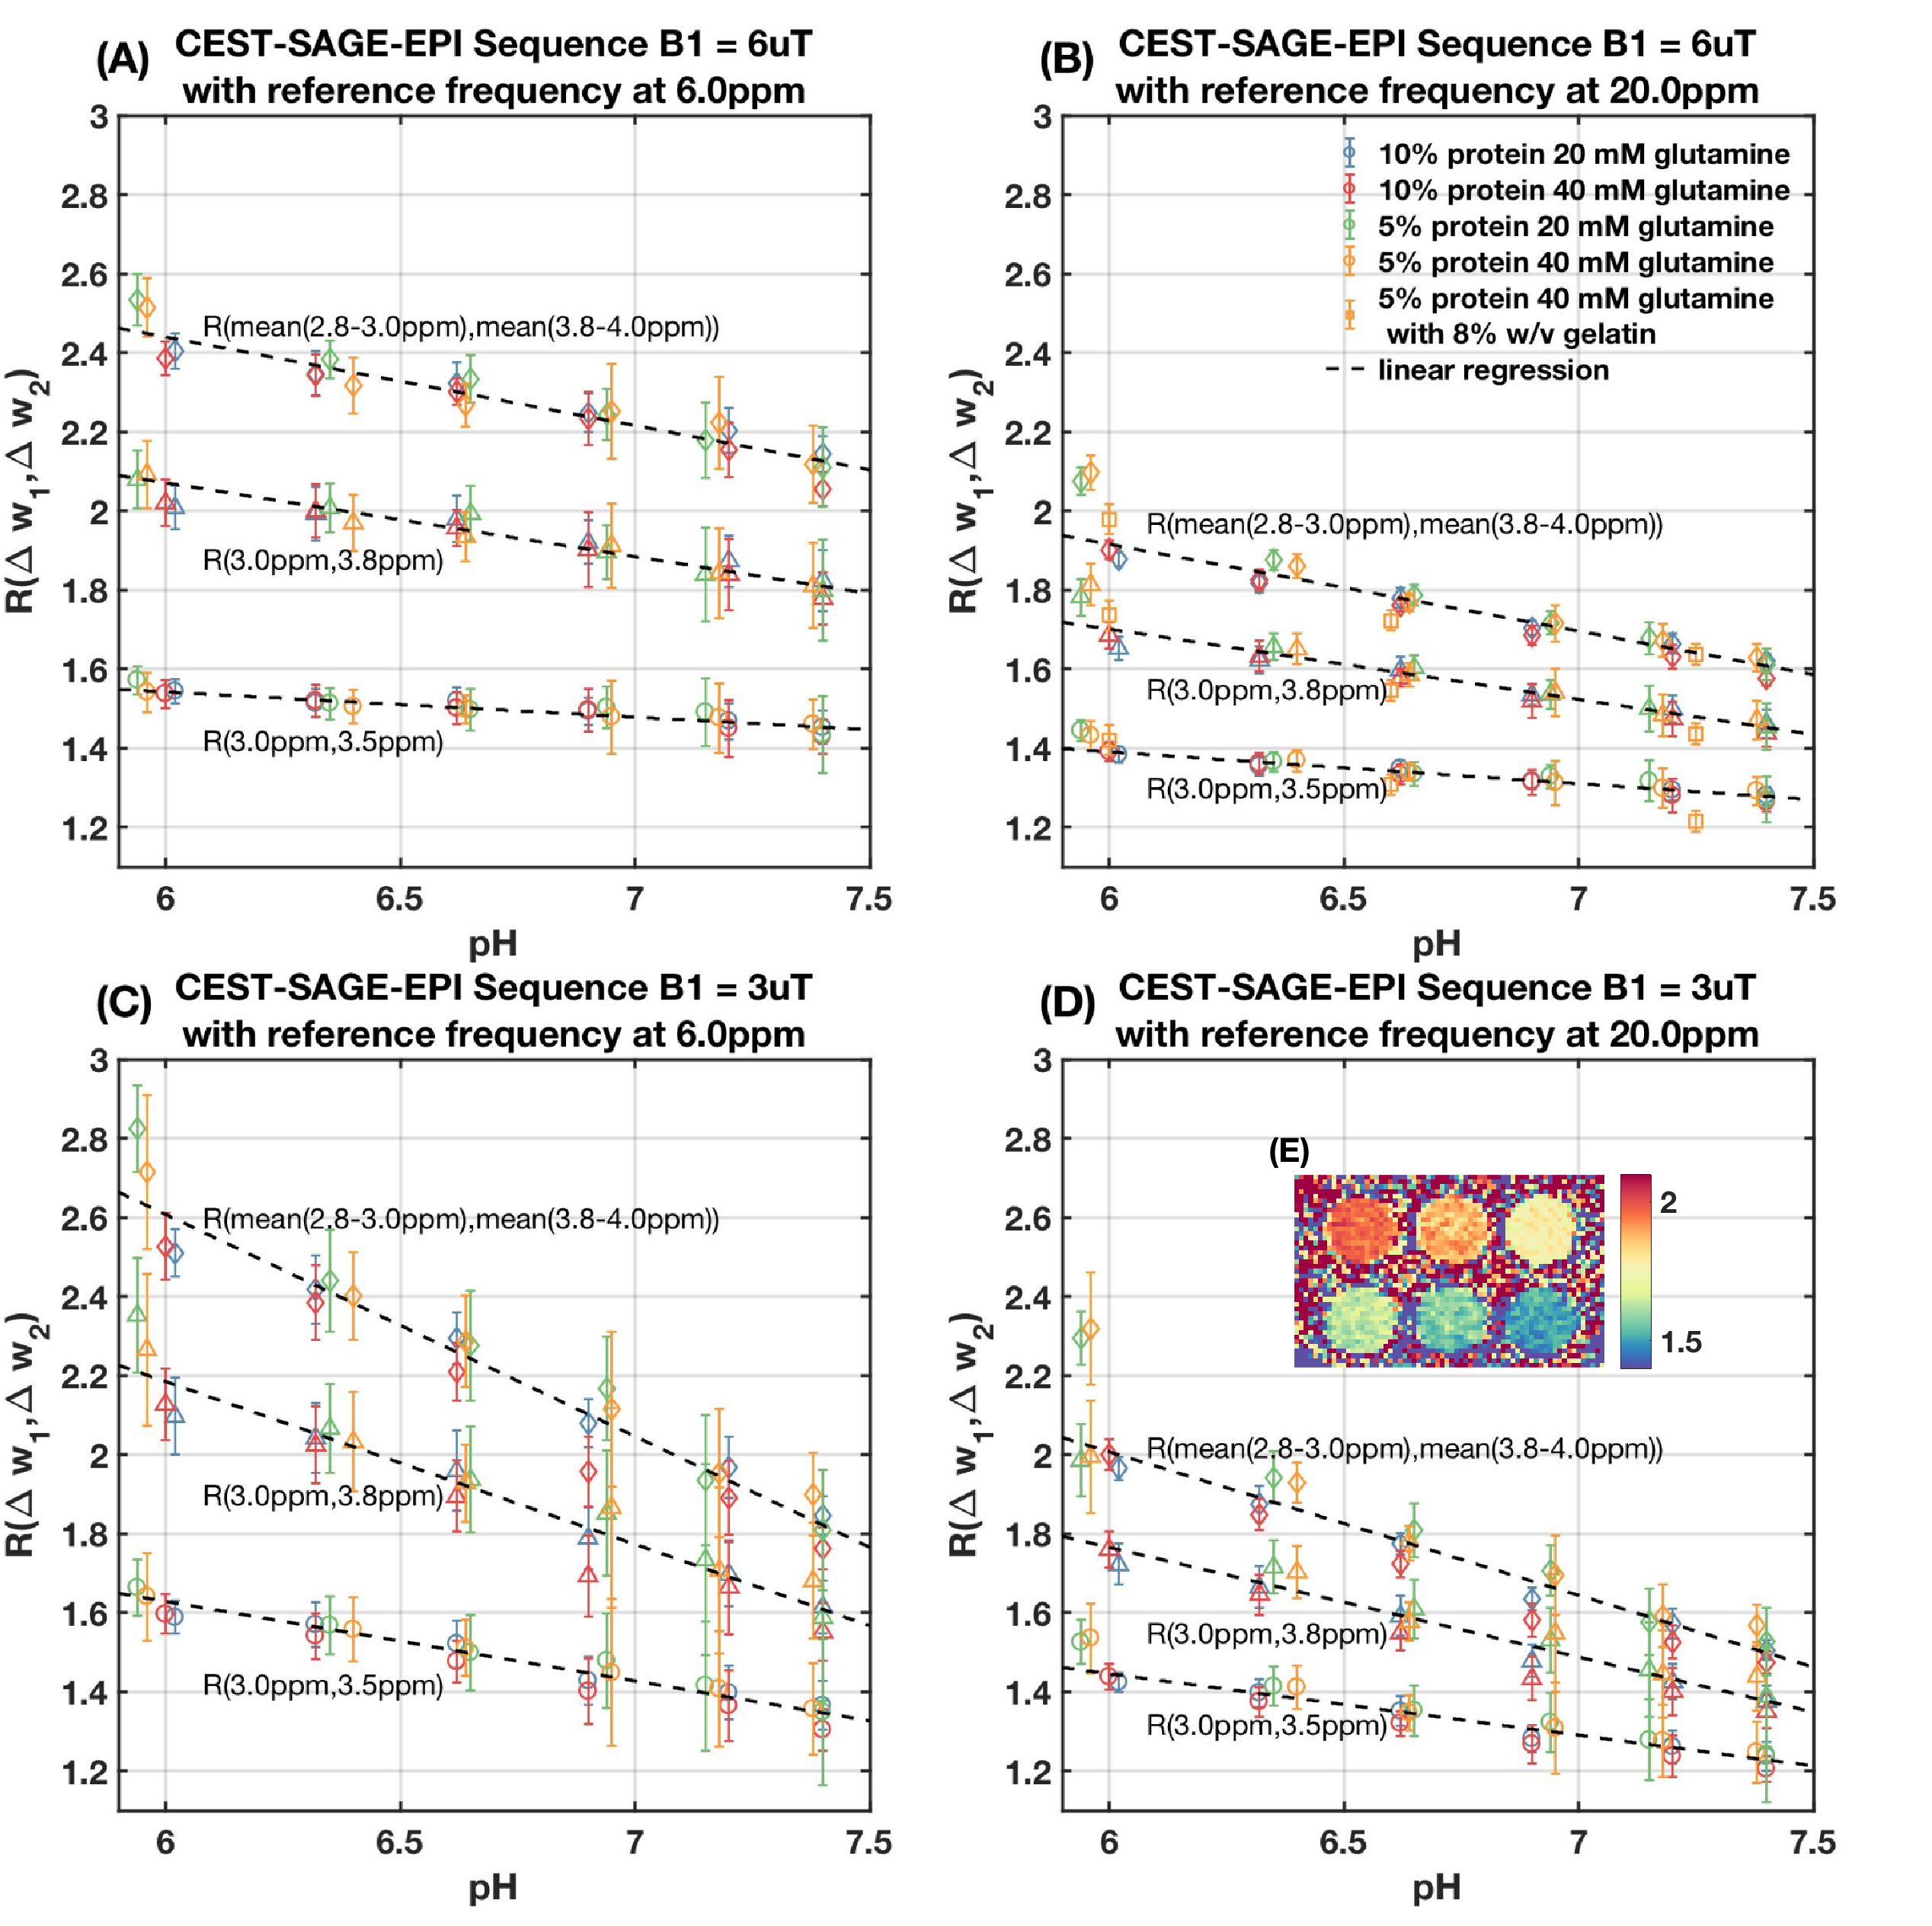
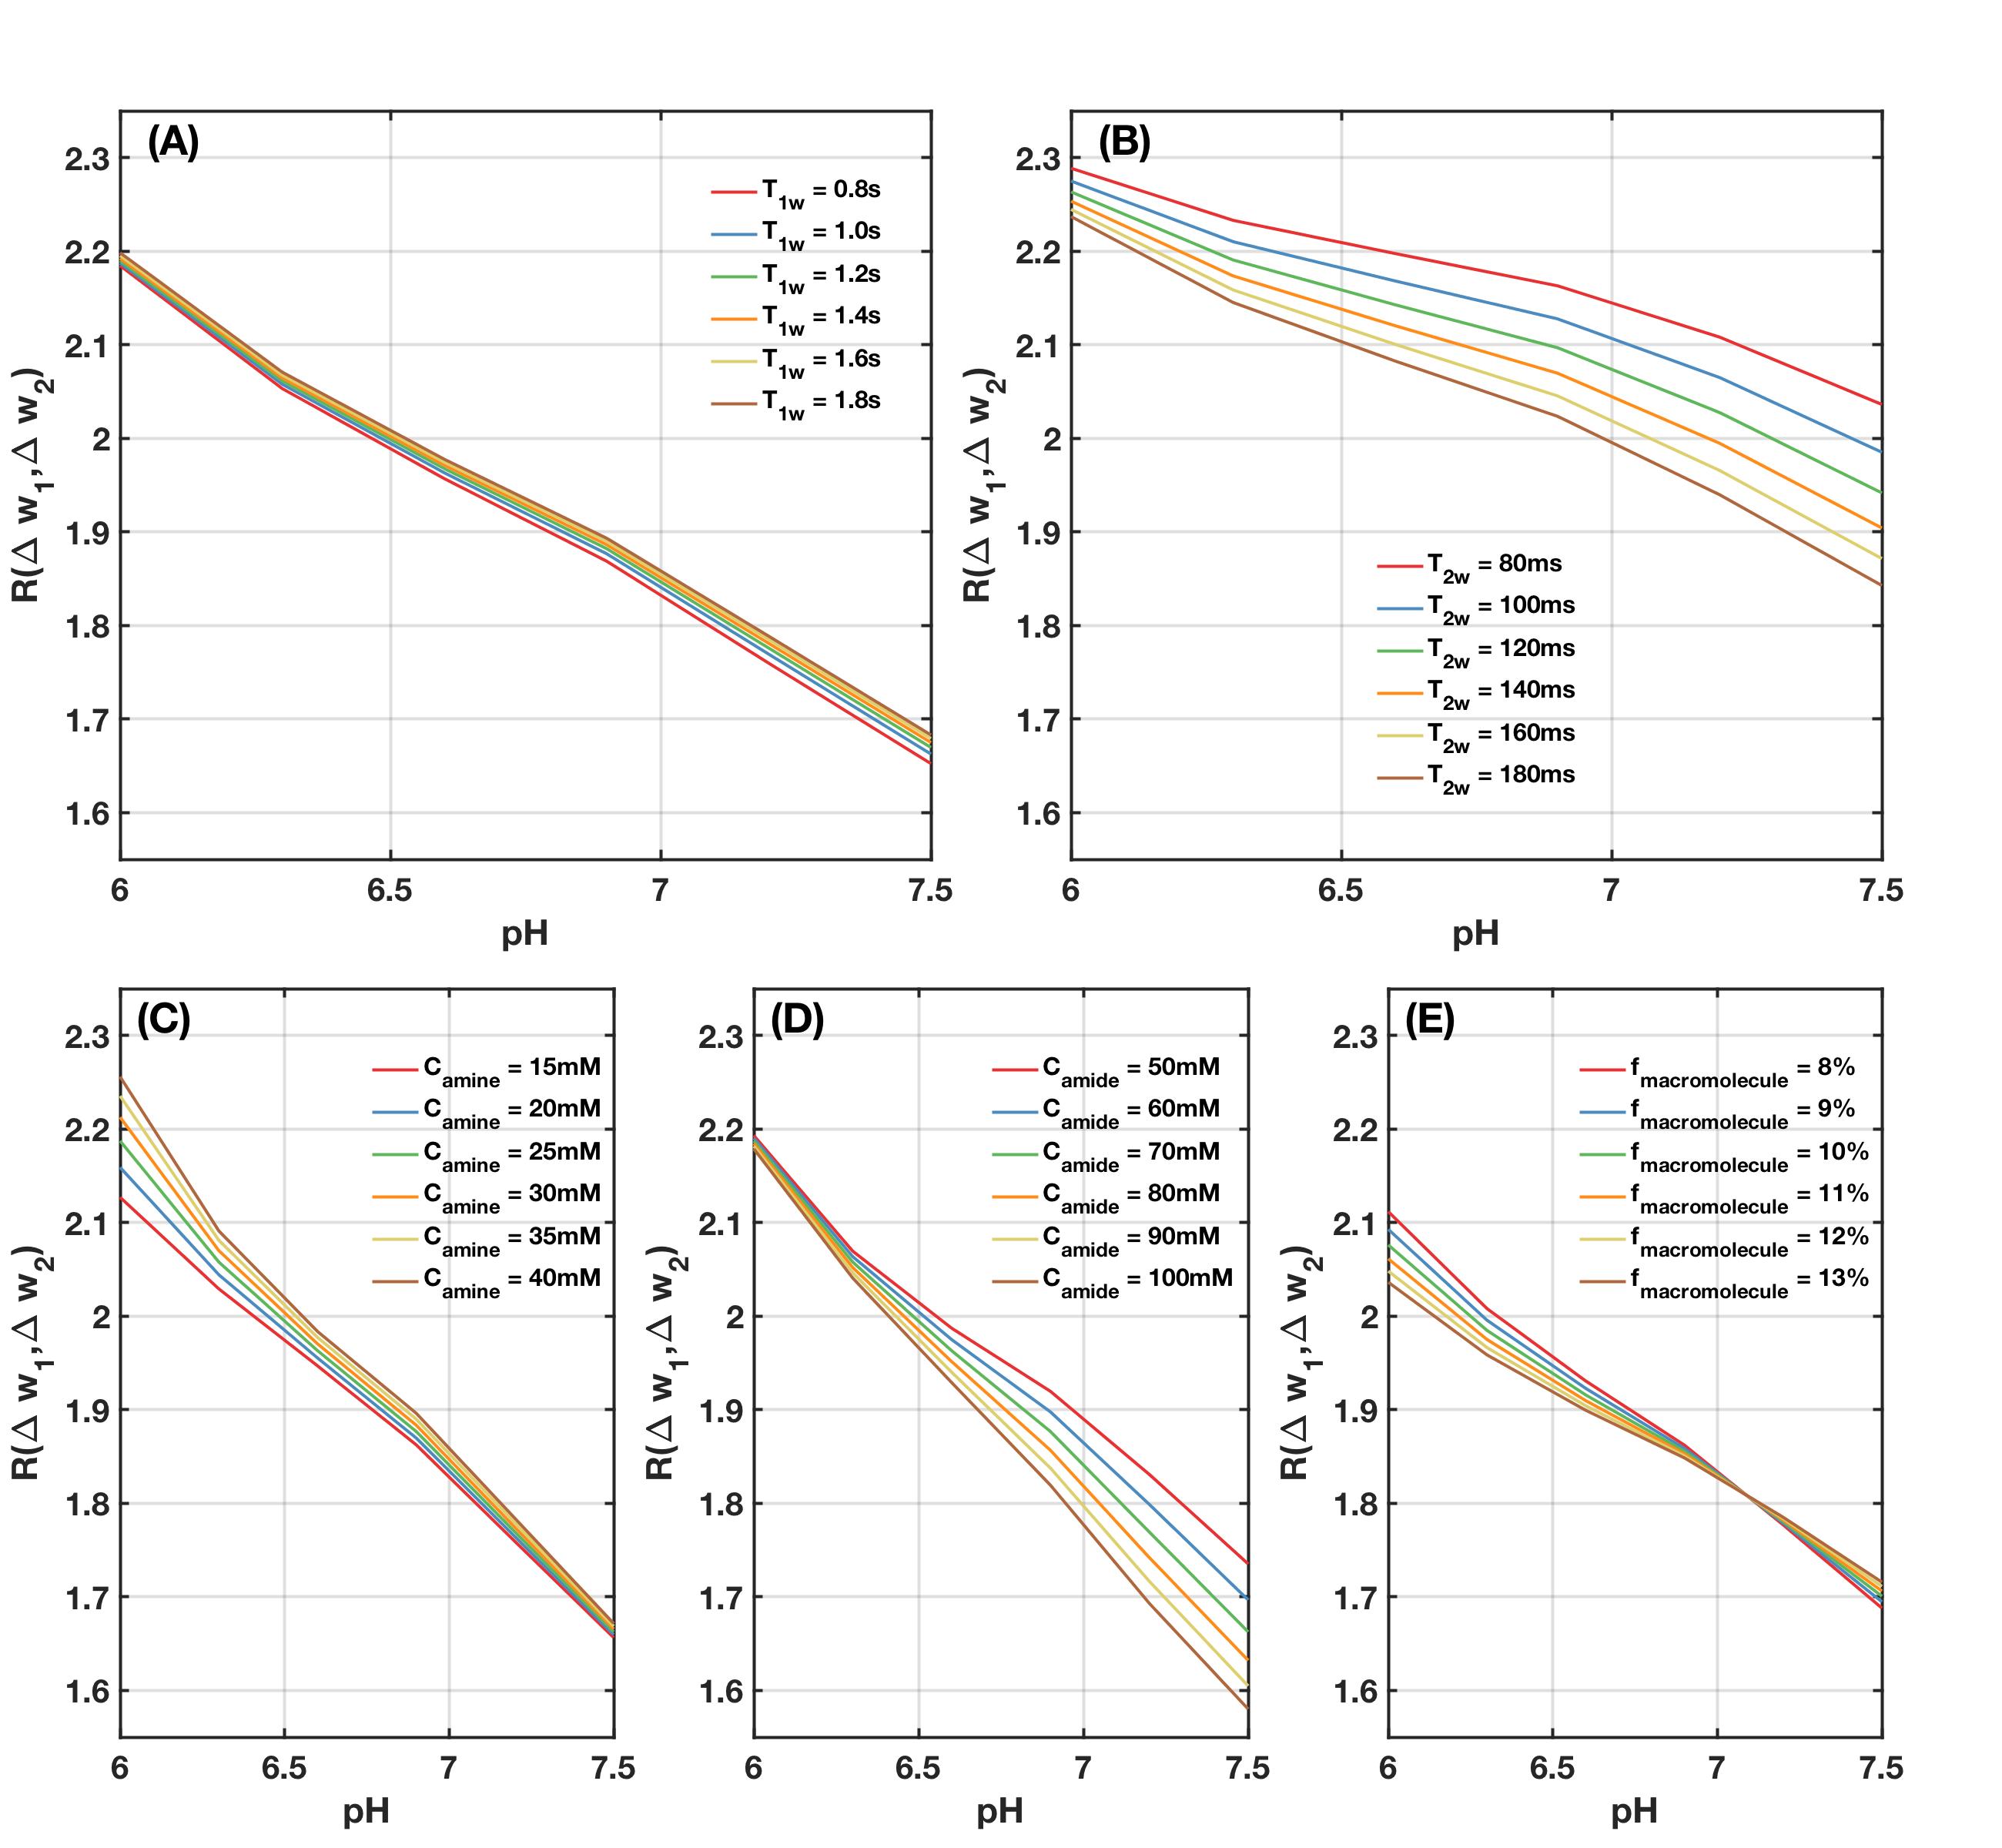
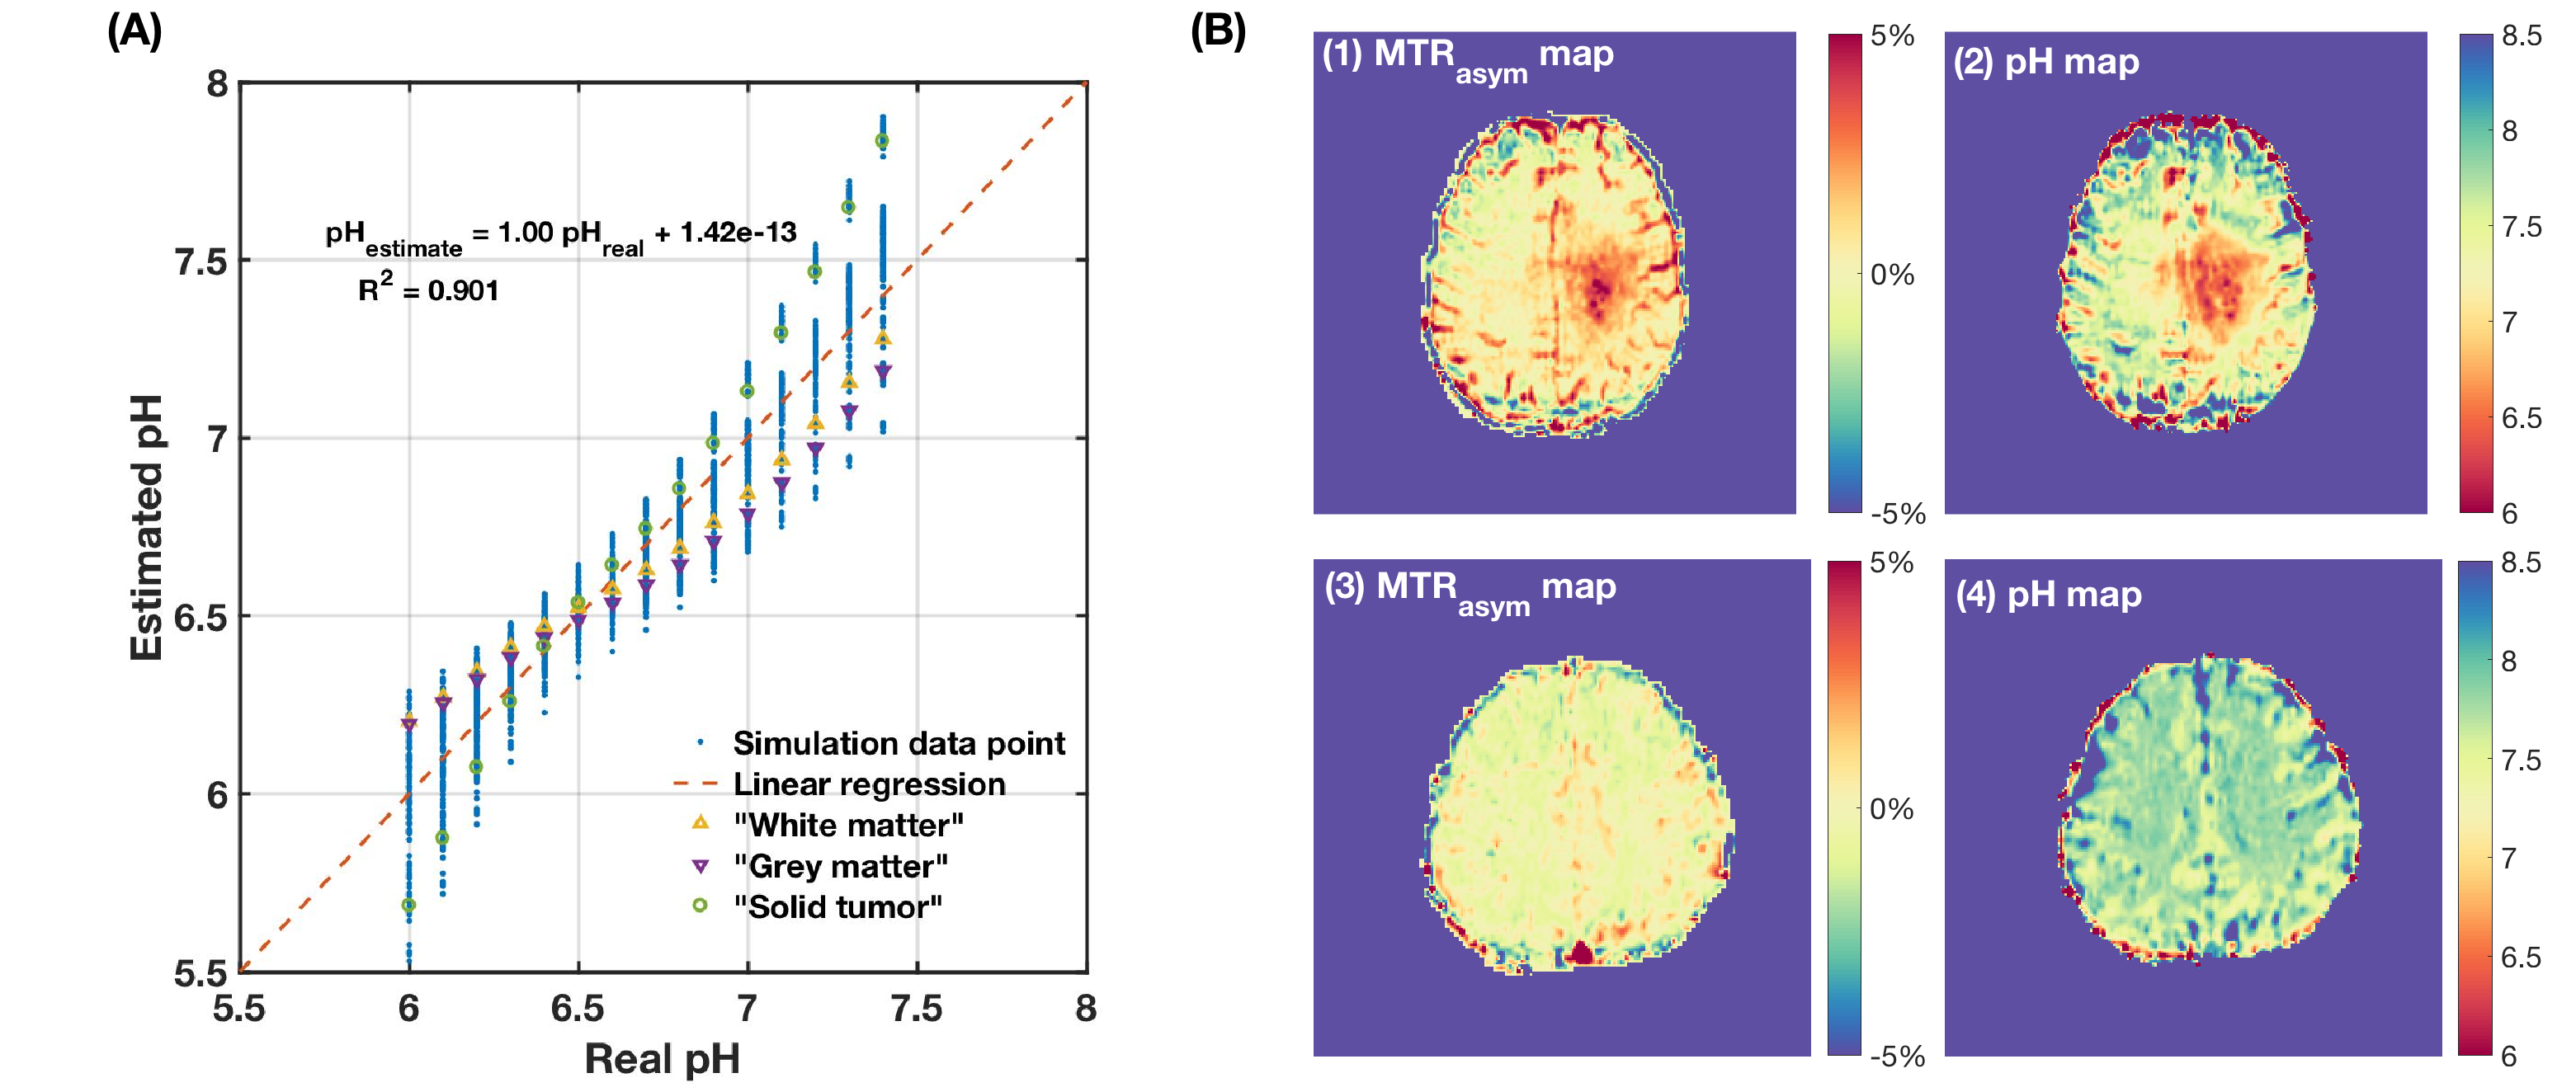
Results from numerical simulation and phantom experiments indicate that $$$R(\Delta\omega_1,\Delta\omega_2)$$$ has an approximately linear relationship with pH. The $$$R(\Delta\omega_1,\Delta\omega_2)$$$-pH relationship has little dependency on T1w, amine and amide concentration, and macromolecular MT effect (Figure 2 and 3). However, change in T2w noticeably alters $$$R(\Delta\omega_1,\Delta\omega_2)$$$-pH relationship (Figure 3(B)) due to the incomplete cancellation of T2w effect at high saturation pulse amplitude. This potential limitation can be mitigated through estimates of T2w using multi-echo readout and T2w-correction with a simple bilinear fitting of $$$R(\Delta\omega_1,\Delta\omega_2)$$$ against pH and T2w (Figure 4). From the phantom experiment results, the ratio of the $$$R(\Delta\omega_1,\Delta\omega_2)$$$-pH slope and the mean standard deviation of within regions of interest (ROIs) was calculated to assess the quantitative resolution of pH measurement (Table 1). The optimum sensitivity of pH measurement is found under the experimental condition of B1=3μT, with $$$\Delta\omega_1 / \Delta\omega_2$$$ = mean(2.8-3.0ppm)/mean(3.8-4.0ppm)and reference frequency at 6.0ppm, resulting in a $$$R(\Delta\omega_1,\Delta\omega_2)$$$-pH slope of -0.561. The optimum resolution of pH measurement is found with B1=6μT, with the same $$$\Delta\omega_1 / \Delta\omega_2$$$ and frequencies of interest, resulting in a quantitative resolution of 0.13 pH units. Example in vivo MTRasym maps and pH maps are shown in Figure 4(B).Discussion
Compared to existing CEST-based pH quantification methods, the metric $$$R(\Delta\omega_1,\Delta\omega_2)$$$ has several advantages: (1) the short saturation pulse in combination with EPI readout makes it possible to acquire whole brain coverage high resolution pH-weighted CEST images in a clinically allowable scan time; (2) using only the positive Z-spectra points for calculation avoids the contamination from nuclear Overhauser effects (NOE), which can complicate contrast based on asymmetry analyses (e.g. MTRasym); (3) $$$R(\Delta\omega_1,\Delta\omega_2)$$$ does not require a priori knowledge of water relaxation rates, since the metric is independent of T1w and T2w correction can be achieved using a multi-echo SAGE-EPI readout; (4) little dependency on amine and amide concentration; and (5) straightforward post-processing. Additionally, the approximate linear relationship between $$$R(\Delta\omega_1,\Delta\omega_2)$$$ and pH allows for quantitative pH estimation to be performed after initial calibration (e.g. 31P-MRS).Conclusion
This study proposed a new metric $$$R(\Delta\omega_1,\Delta\omega_2)$$$ as a noninvasive and easy-to-translate pH imaging technique that is not sensitive to water relaxation rates or amino acid concentration. This approach will be highly valuable for investigating metabolic changes in patients with a variety of diseases.Acknowledgements
No acknowledgement found.References
[1] Chesler M. Regulation and modulation of pH in the brain. Physiol Rev 2003;83(4):1183-221.
[2] Zaiss M, Xu J, Goerke S, Khan IS, Singer RJ, Gore JC, et al. Inverse Z-spectrum analysis for spillover-, MT-, and T1-corrected steady-state pulsed CEST-MRI-application to pH-weighted MRI of acute stroke. NMR in biomedicine 2014;27(3):240-52.
[3] Zaiss M, Bachert P. Exchange-dependent relaxation in the rotating frame for slow and intermediate exchange-modeling off-resonant spin-lock and chemical exchange saturation transfer. NMR in Biomedicine 2013;26(5):507-18.
[4] Harris RJ, Cloughesy TF, Liau LM, Nghiemphu PL, Lai A, Pope WB, et al. Simulation, phantom validation, and clinical evaluation of fast pH-weighted molecular imaging using amine chemical exchange saturation transfer echo planar imaging (CEST-EPI) in glioma at 3 T. NMR in Biomedicine 2016;29(11):1563-76.
Figures