2231
Single-shot whole-brain CEST imaging using centric-reordered 3D-EPI1German Center for Neurodegenerative Diseases (DZNE), Bonn, Germany, 2Max-Planck Institute for Biological Cybernetics, Tübingen, Germany, 3Department of Physics and Astronomy, University of Bonn, Germany
Synopsis
We present a 3D CEST sequence that allows 2mm isotropic whole-brain acquisition within 6s per frequency offset. The 4.5s CEST preparation is followed by a 1.5s centric-reordered 3D-EPI readout with water excitation. The single-shot readout improves robustness against physiological noise and provides complete freedom in the design of the saturation block. We acquired whole-brain CEST data at 7T and show metabolite maps obtained from a Lorentzian fit to the Z-spectra.
Introduction
Chemical exchange saturation transfer (CEST) data contain relevant information about the molecular microenviroment1 that may provide new insight into neurodegeneration. Since neurodegenerative diseases are not restricted to a certain brain area, it may be beneficial to observe the chemical exchange of metabolites in the whole brain. High-resolution whole-brain imaging requires a fast readout in order to be robust against motion and other sources of physiological noise. To this end, we combined a CEST preparation with a centric-reordered, accelerated 3D-EPI2,3 readout at 7T. Since the whole imaging volume is acquired rapidly following preparation (single-shot), there exist no inter-slice artifacts induced by slow to medium motion, e.g. respiration. Motion that occurs across different CEST contrasts can be removed using retrospective motion correction. Finally, in order to minimize fat-related chemical shift artifacts, a recently proposed water excitation module3 with reduced specific-absorption rate and RF peak power was utilized.Methods
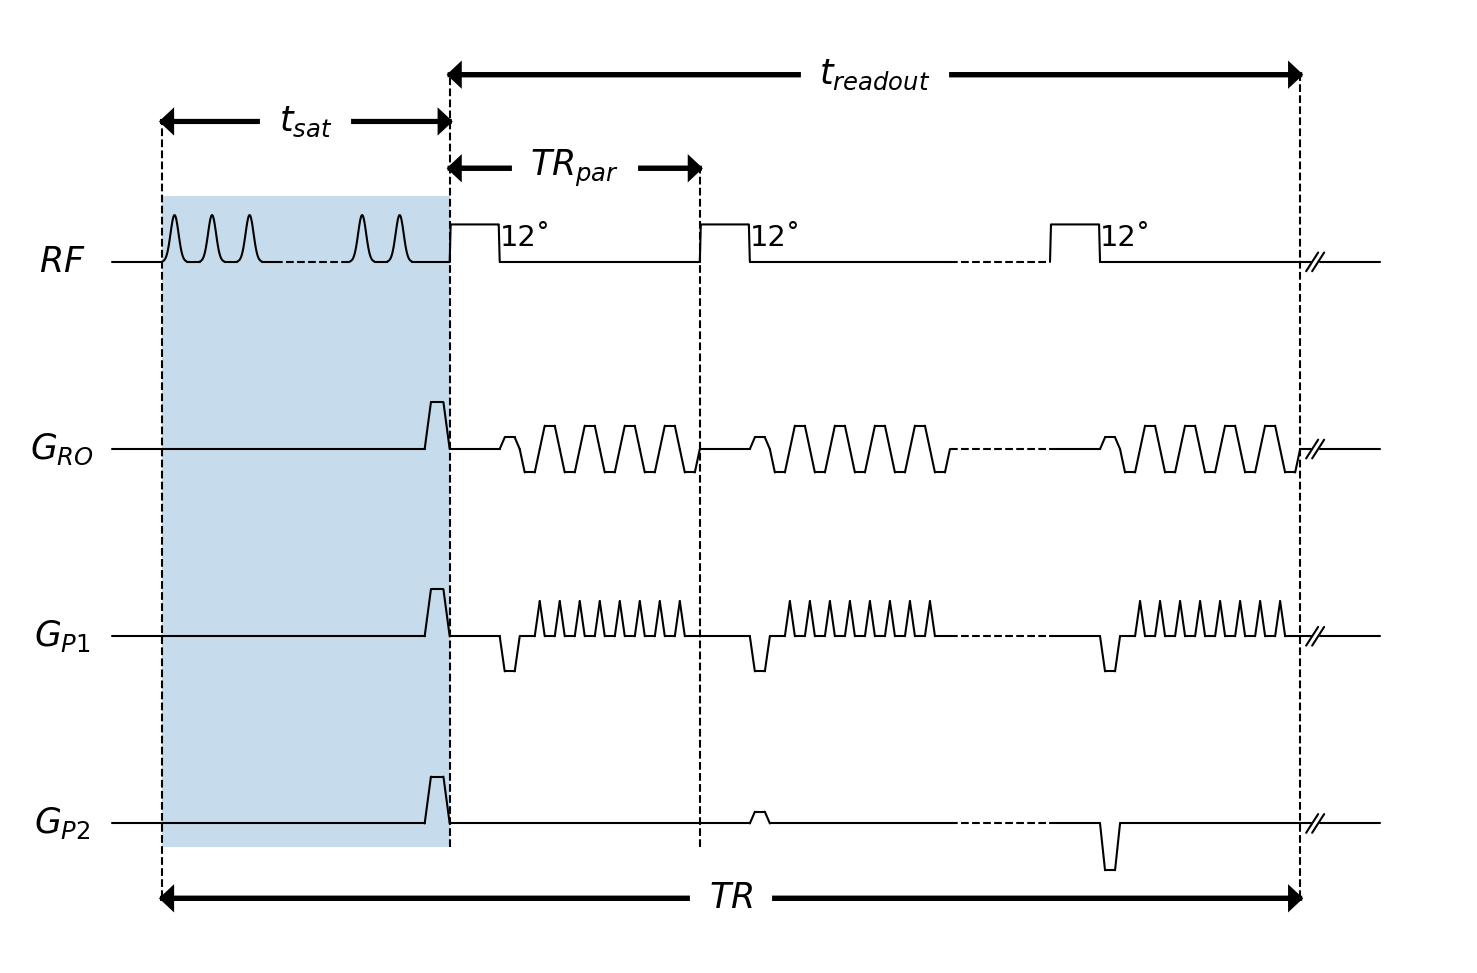
CEST saturation4 was performed using a train of 150 Gaussian-shaped RF pulses before each volume acquisition (tpulse=15ms, tsat=4.5s, duty-cycle=50, 52 frequency offsets between -6 and 6ppm). Data were acquired using a centric-reordered 3D-EPI readout with water excitation (Fig. 1; resolution=2.0x2.0x2.0mm3, sagittal FOV=212x160x212mm3, TRpar/TE=17.6/6[ms], treadout=1.5s, TR=6s, BW=2358Hz/Px, FAnominal=12˚, GRAPPA 3x1, partial Fourier=6/8x1, total acquisition time = 5:46min). The experiment was repeated three times with different saturation fields (B1nominal=[1.4,1.0,0.7]µT) in order to allow for B1 correction of the CEST spectra. In vivo data were acquired on a 7T MRI research scanner (Siemens) using a 32-channel head coil (Nova medical) on a healthy subject with informed consent and approval by the local ethics committee. Z-spectra and CEST-maps were obtained from a Lorentzian fit5 after motion correction (FSL6) and B0/B1-correction5,7 using WASSR8 B0 and 3DREAM9 B1 maps, respectively.Results
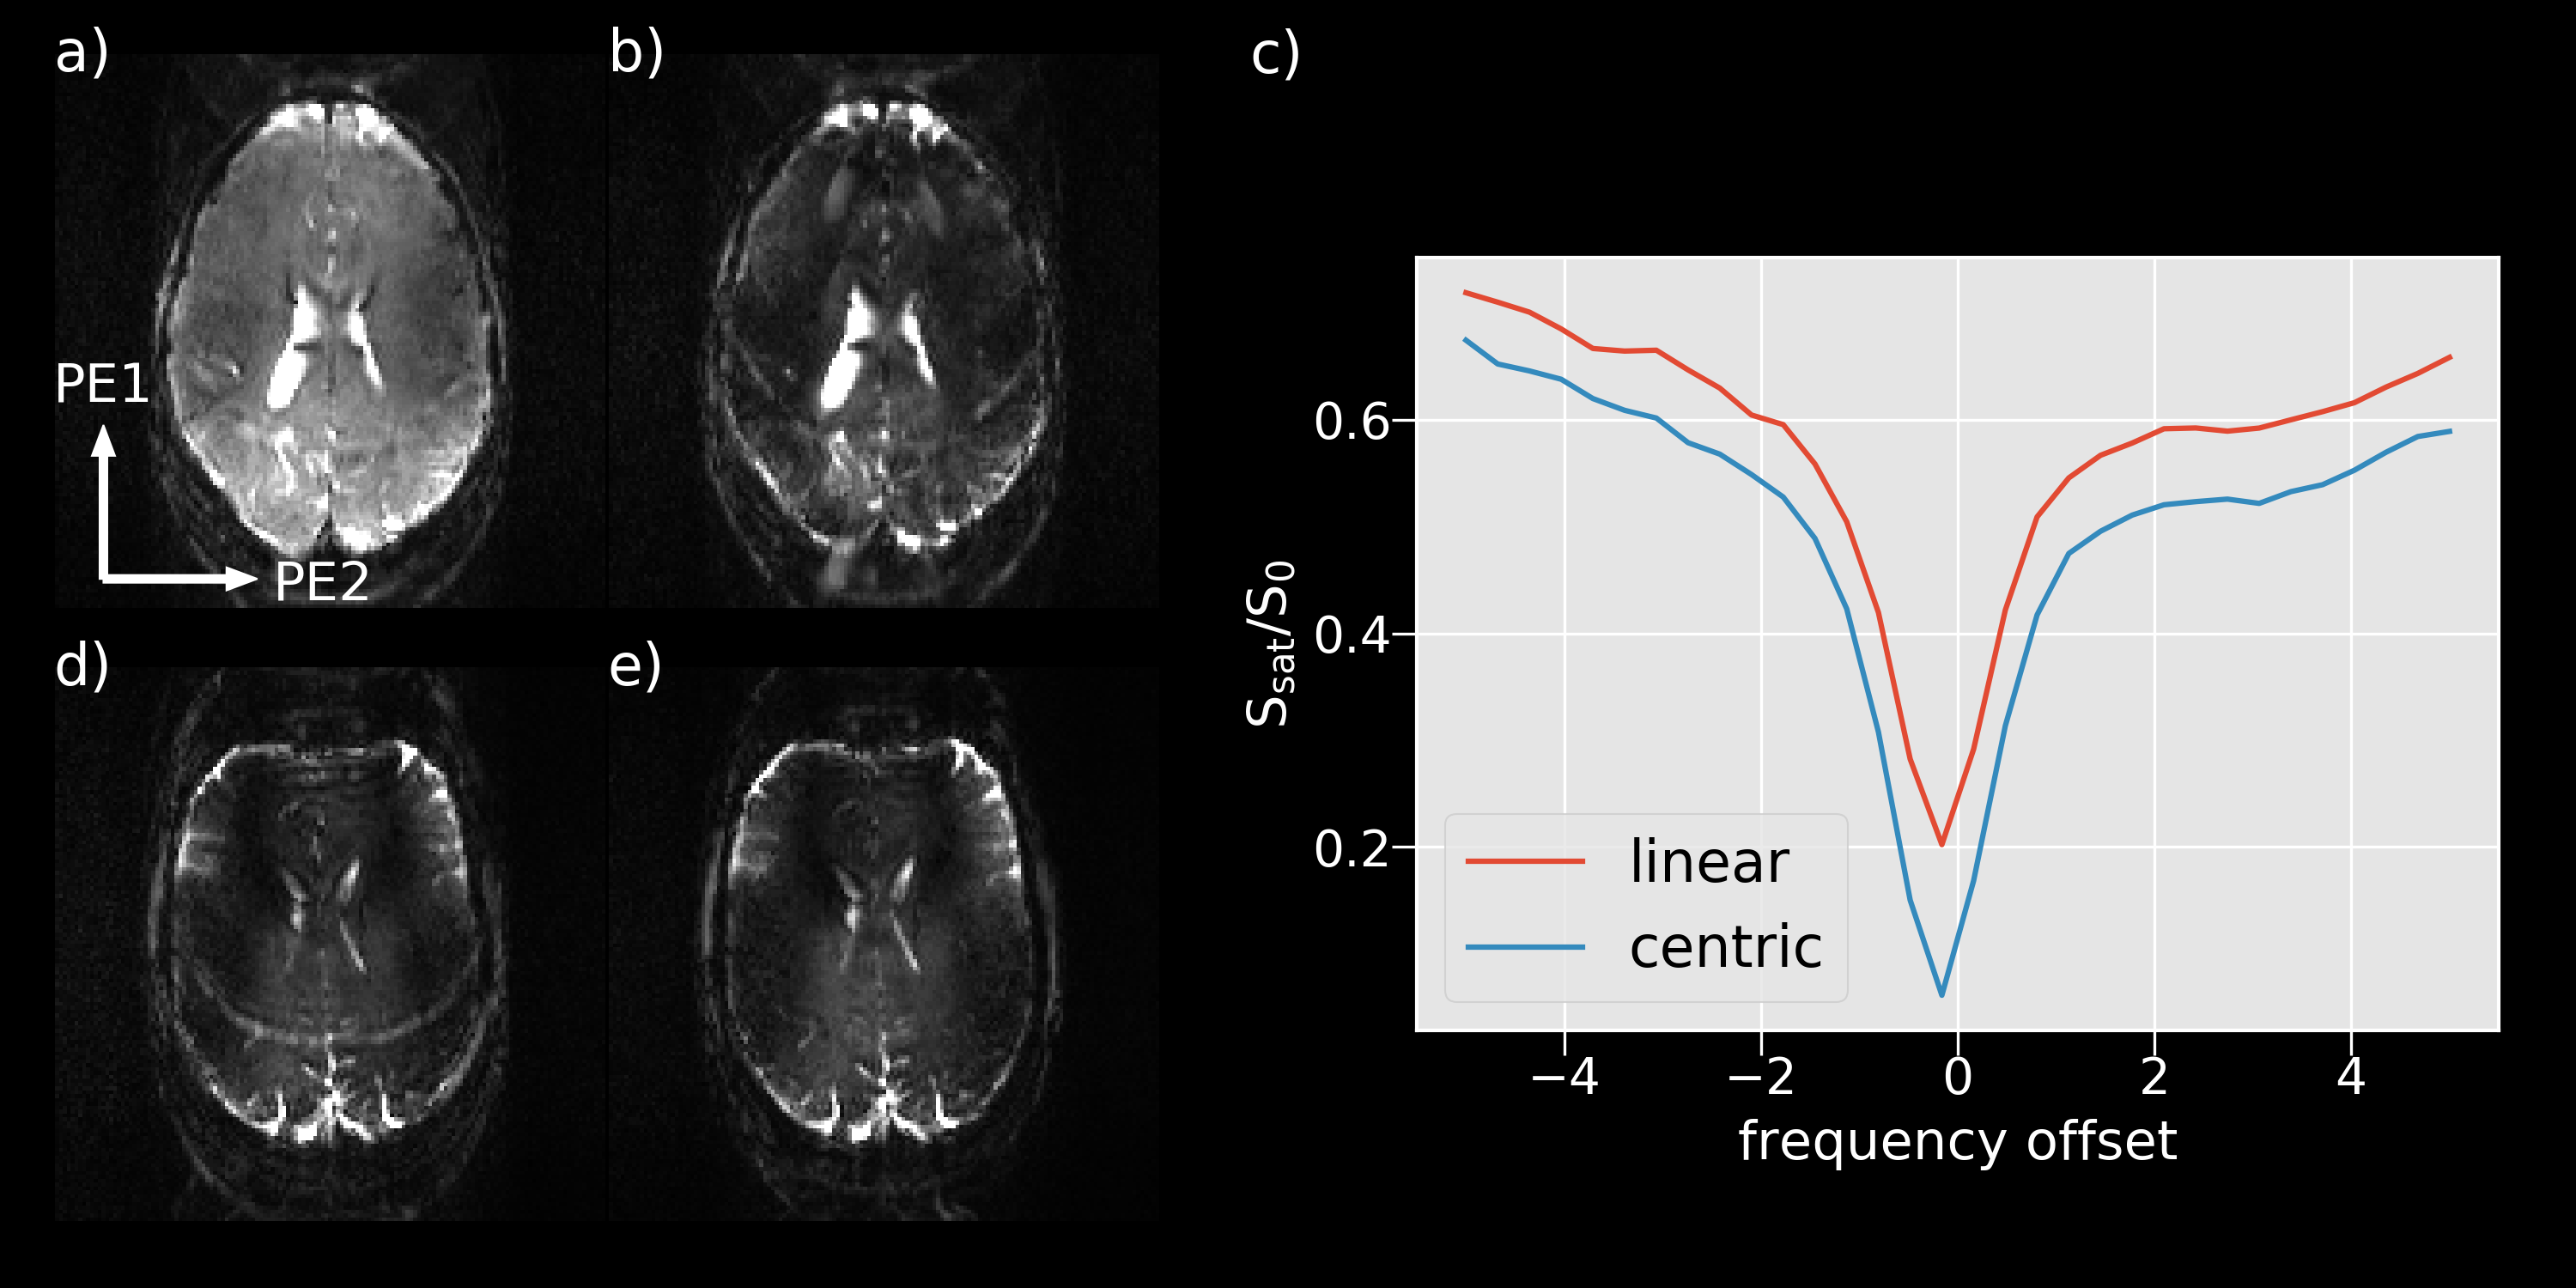
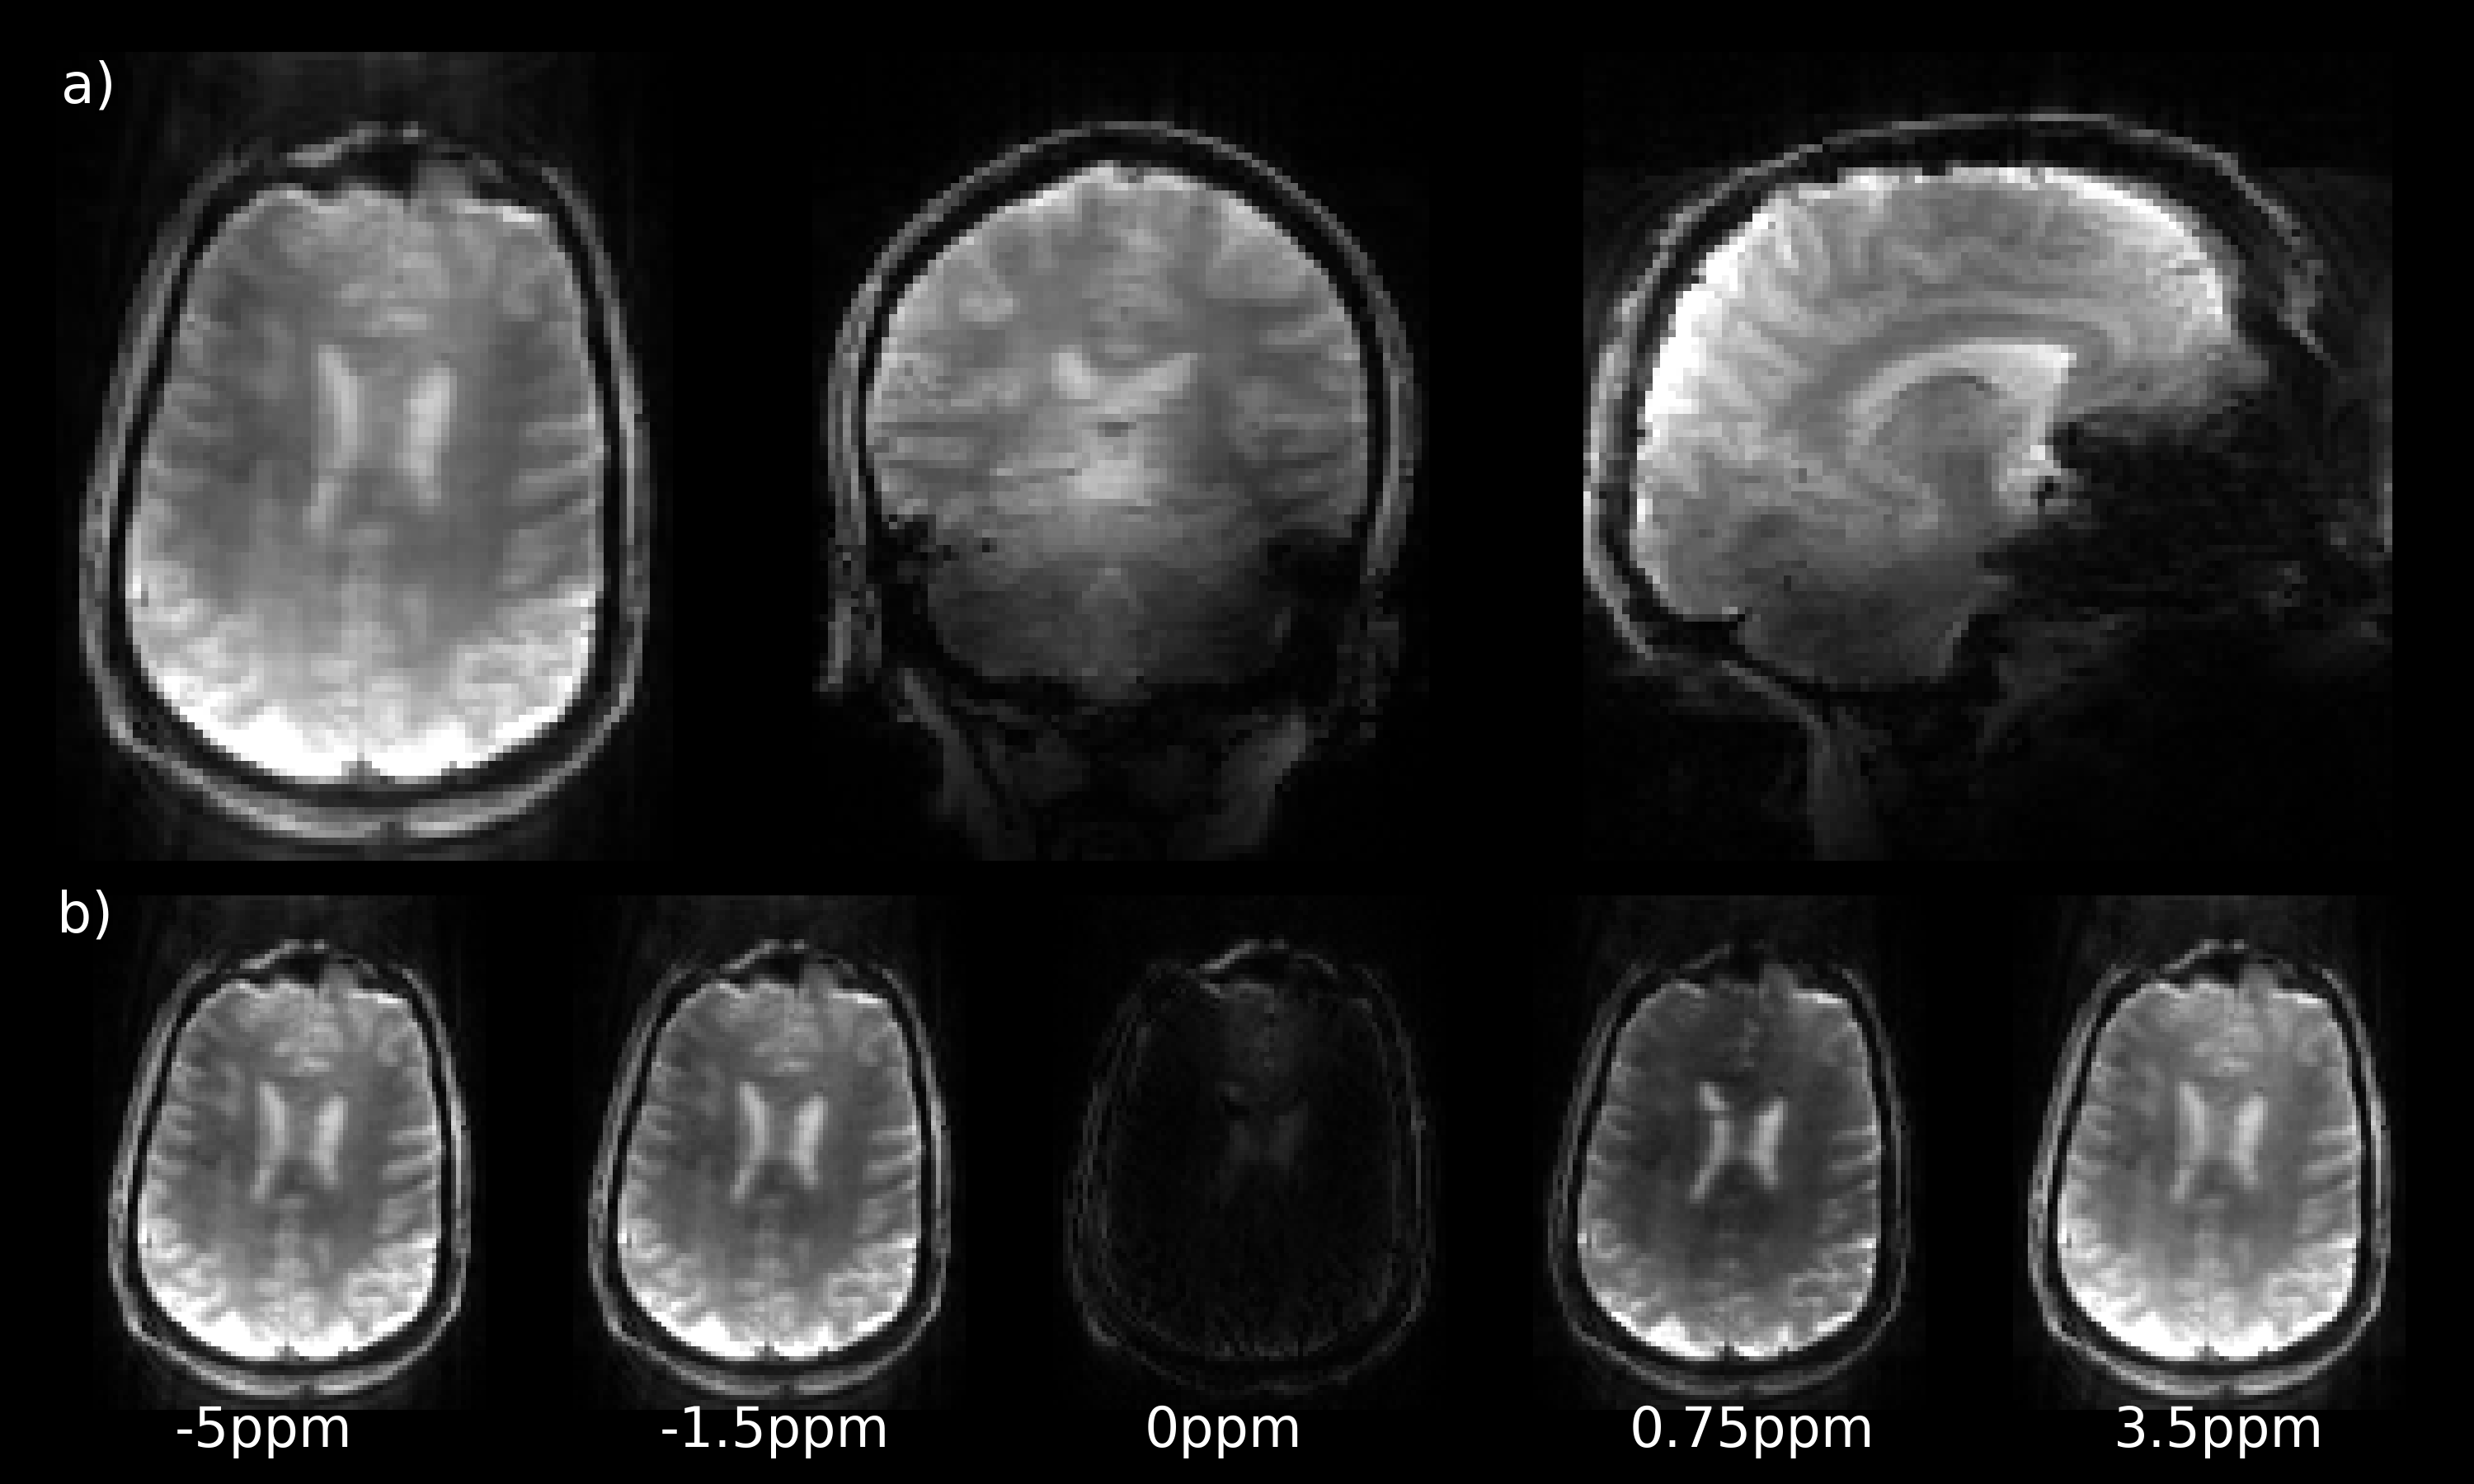
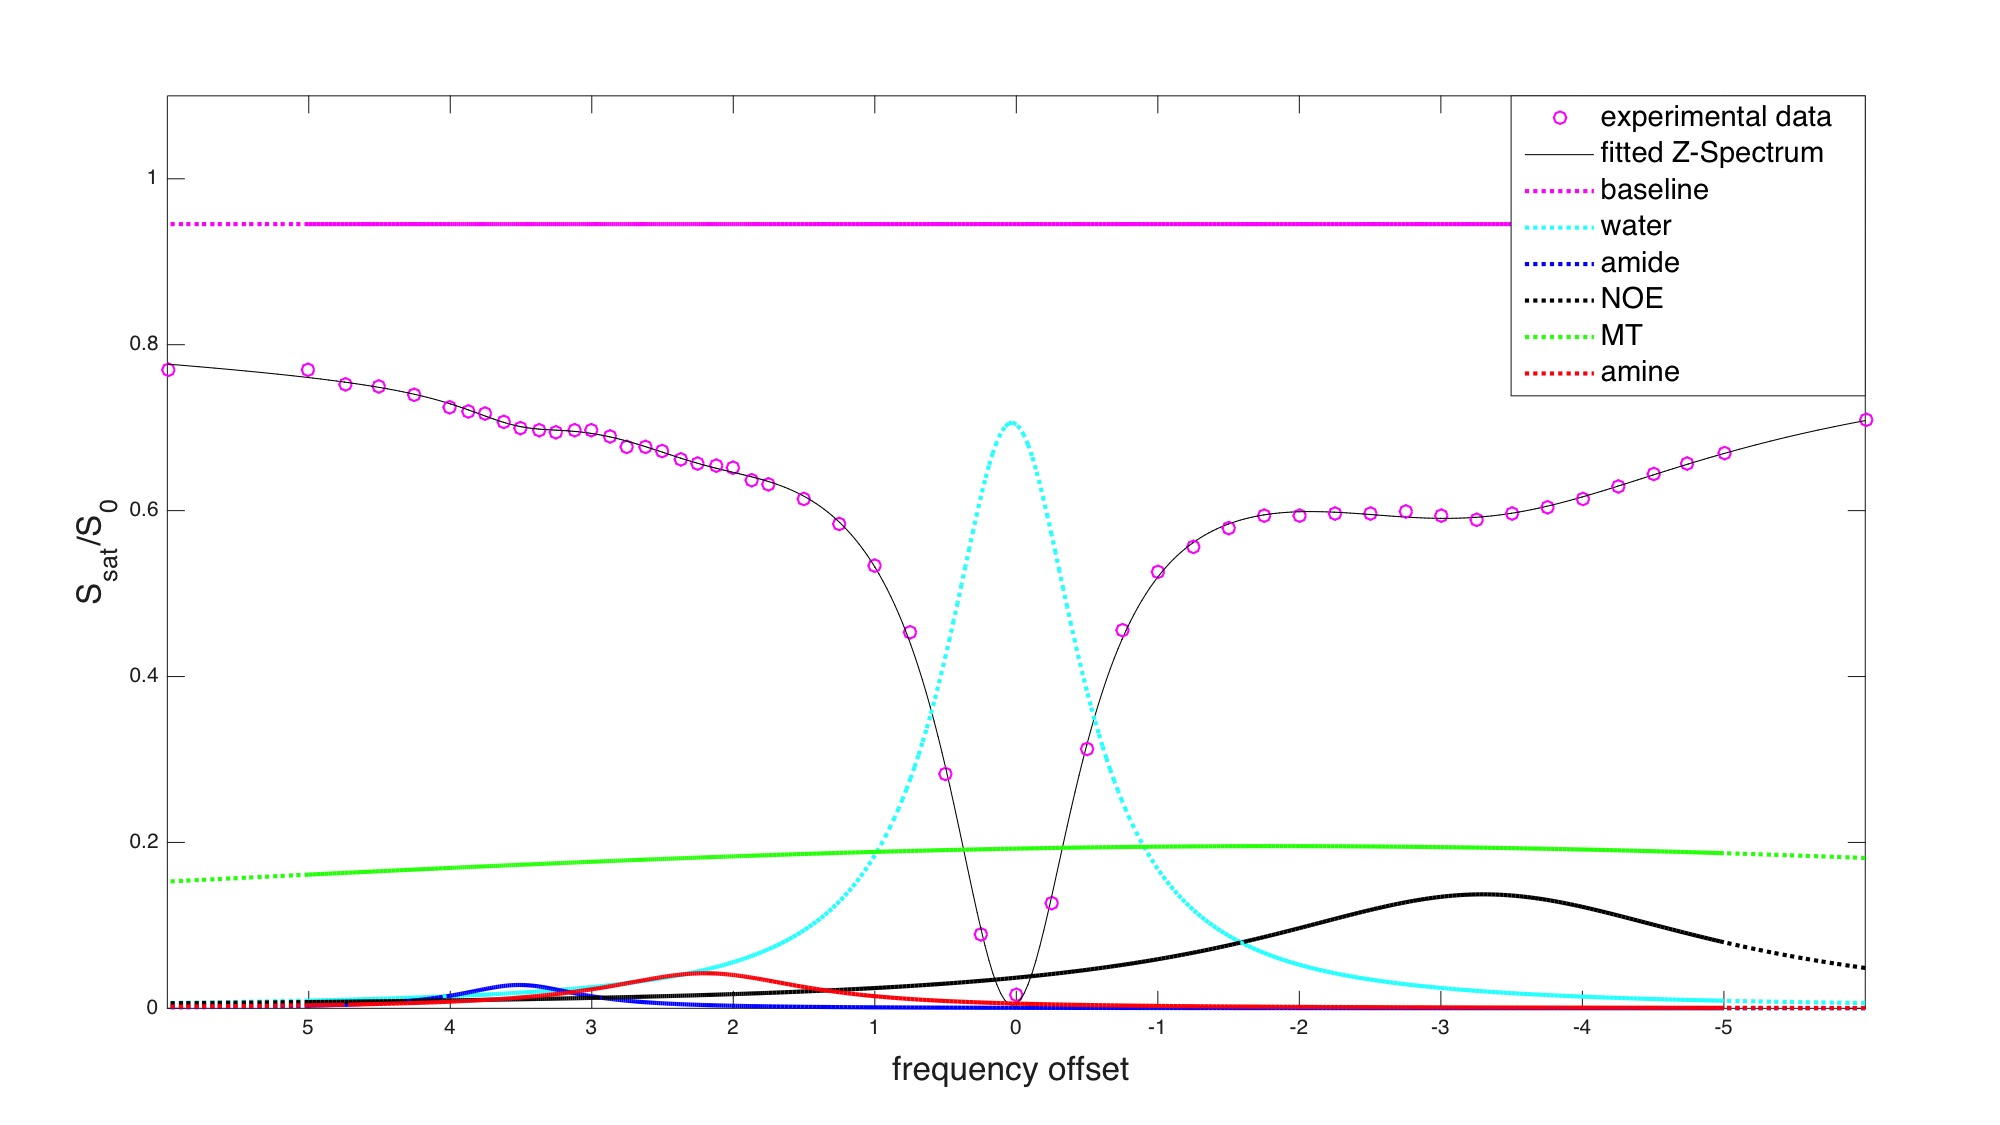
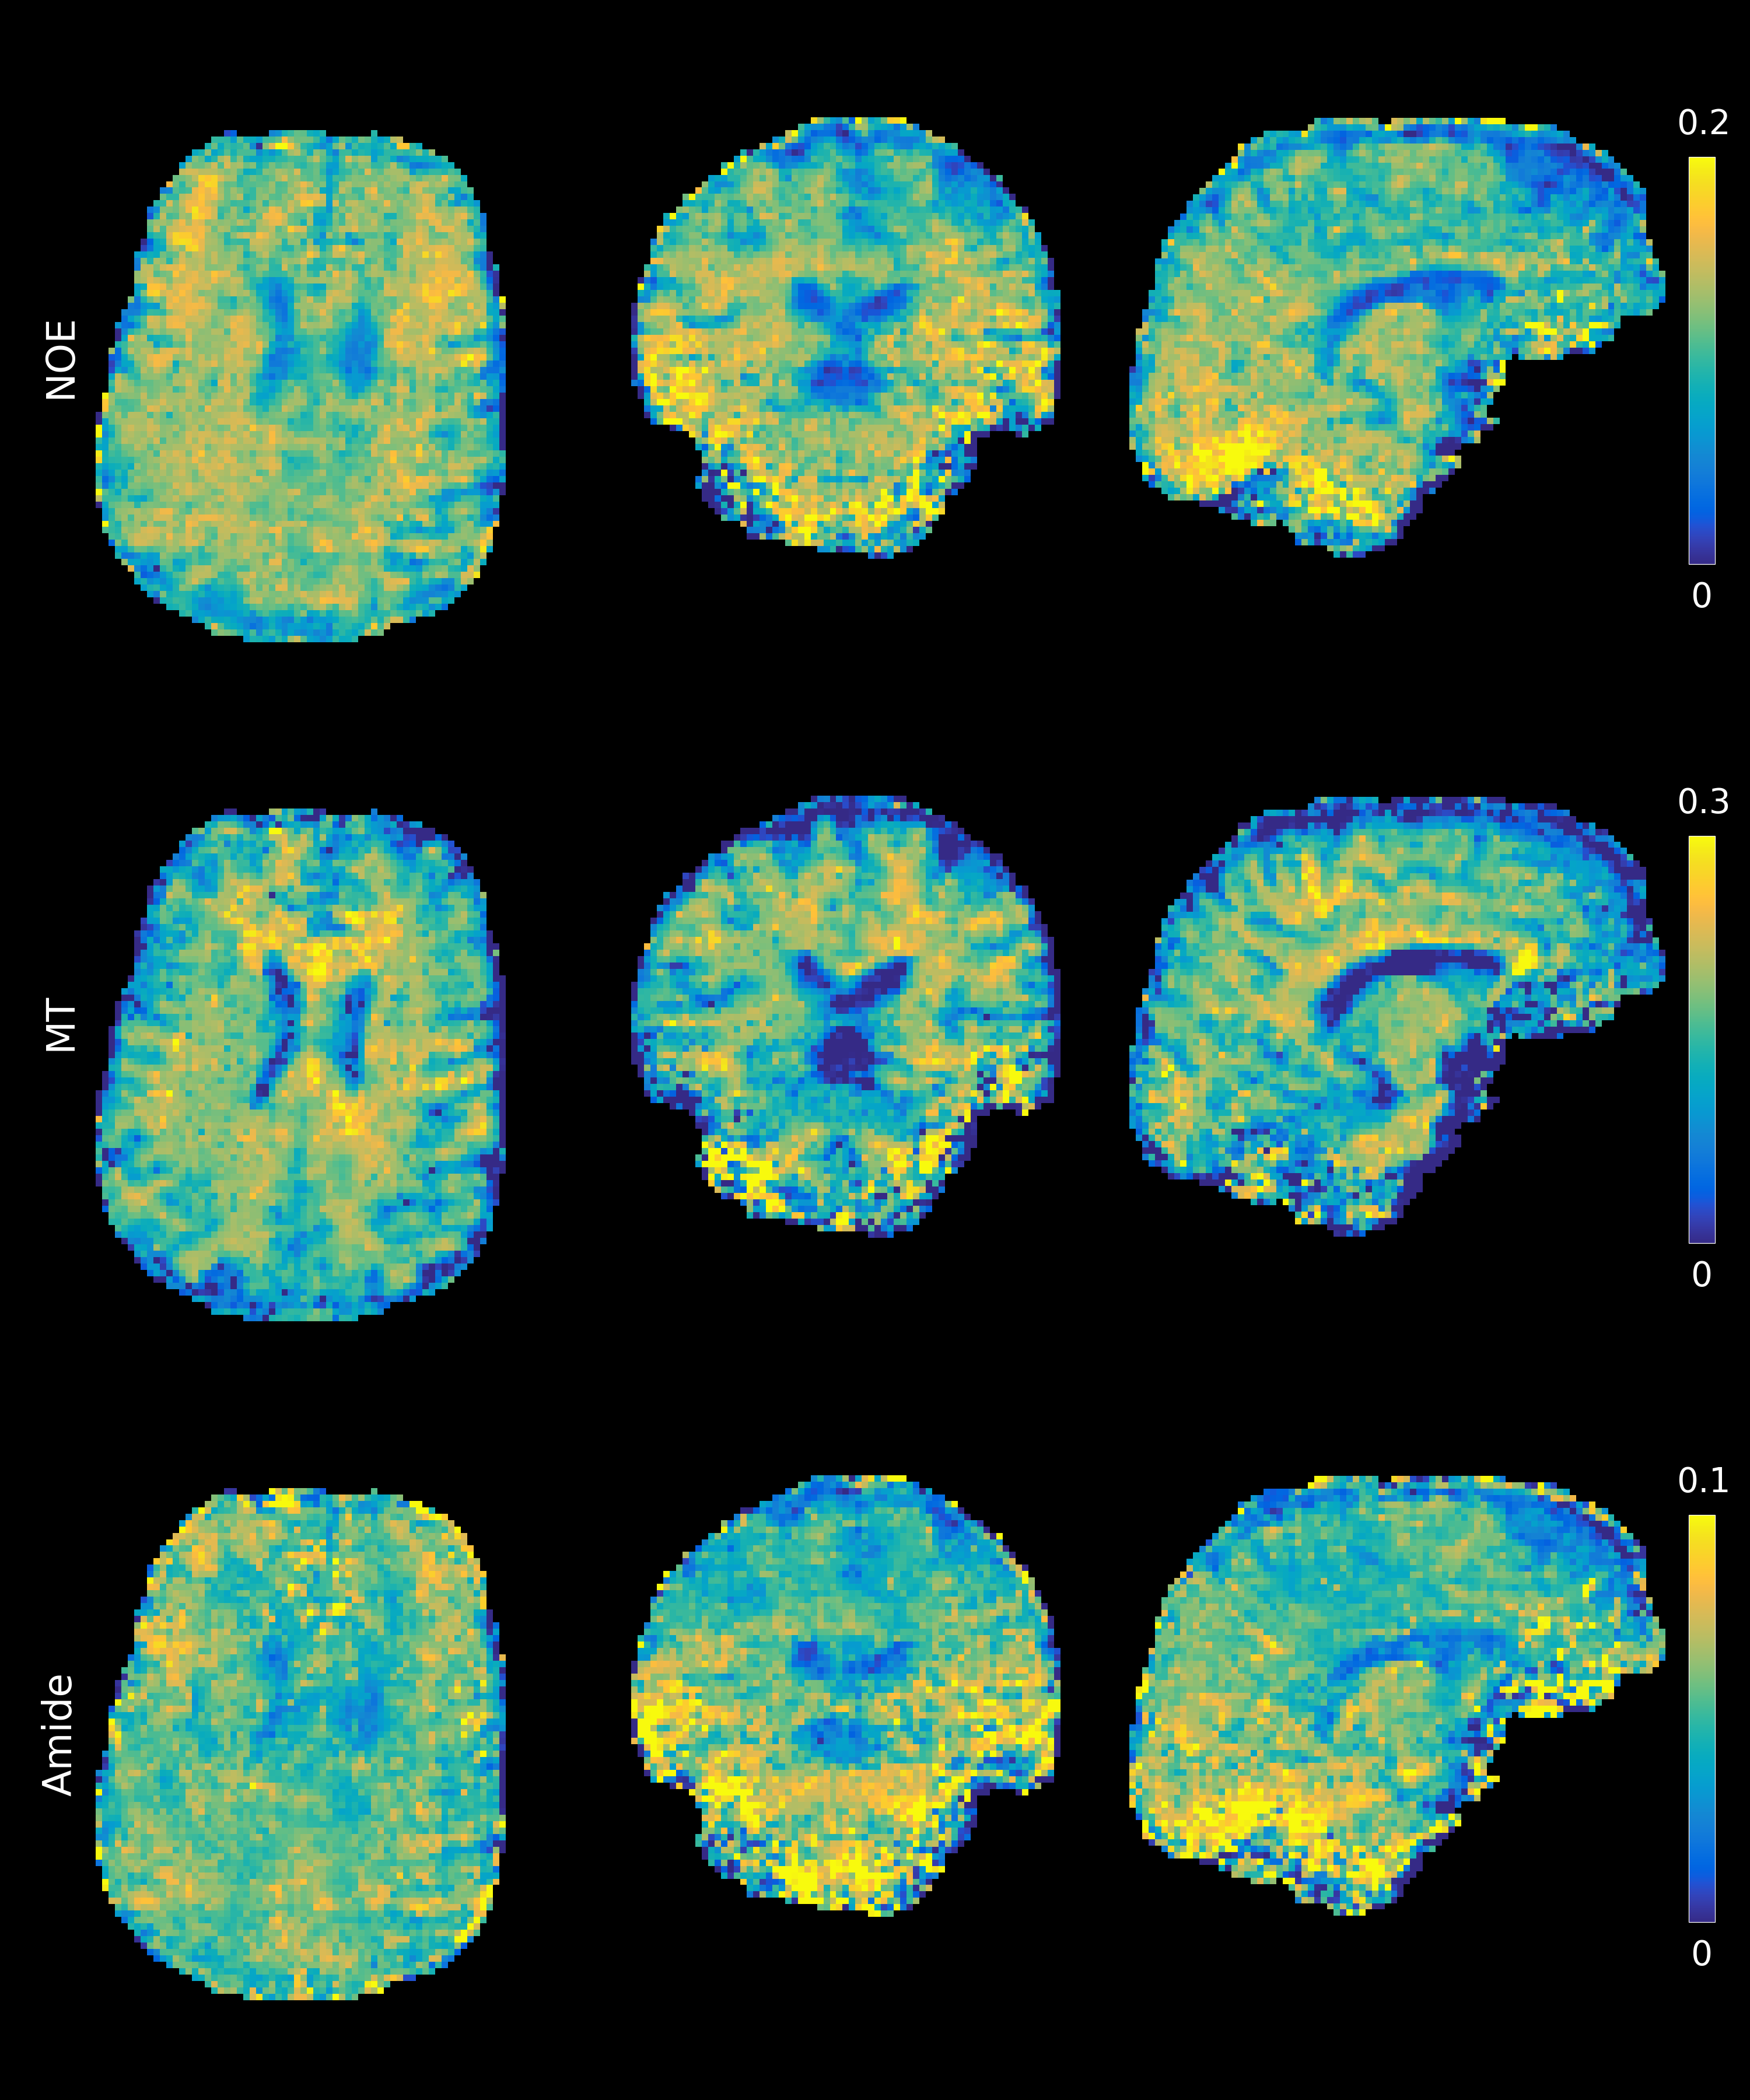
Figure 2a-c illustrates the improved saturation level of centric-reordered 3D-EPI by comparing centric versus linear reordering for one slice of a 3D CEST volume close to the water frequency. The suppression of chemical shift artifacts is illustrated in figure 2d-e on the basis of a single slice from 3D-EPI data measured with and without water excitation. In figure 3a, example slices of the unsaturated volume are shown in transverse, sagittal and coronal orientation. The second panel displays an example slice of the stack for different saturation frequencies (fig. 3b). Figure 4 shows the Z-spectrum of a white matter voxel and the fitted Lorentzians for Δωwater=0ppm, ΔωMT =-1ppm, ΔωNOE =-3.5ppm, ΔωAmide =3.5ppm and ΔωAmine =2.2ppm. The resulting maps for ΔωMT, ΔωNOE and ΔωAmide are shown in all orientations (fig. 5), demonstrating the full brain coverage of the proposed CEST technique.Discussion and Conclusion
We have shown that the combination of CEST saturation with an accelerated centric-reordered 3D-EPI readout provides high quality whole-brain data in an acquisition time as short as 6s per offset frequency (1.5s readout). Chemical shift artifacts were successfully suppressed by means of water excitation.
Compared to a 2D multi-slice acquisition after a single CEST preparation, the 3D approach has the advantage of a homogeneous saturation level between slices and the inherent SNR benefit of volumetric over slice-based sequences2. In contrast to segmented 3D CEST EPI10, we used a centric-reordered 3D-EPI readout that requires only a single preparation per image volume acquisition. This improves robustness against motion and respiration and, moreover, provides complete freedom in the design of the saturation block in terms of recovery delay, duty-cycle as well as pulse width. To counteract susceptibility-induced geometric distortion artifacts along the primary phase encode direction, which can be a major problem of EPI, we employed a high readout bandwidth in combination with parallel imaging. In future work, remaining distortions may be corrected by employing suitable correction techniques.
Furthermore, data quality is sufficient to create maps for the individual CEST pools. GM is clearly distinguishable from WM in the NOE and MT maps. However, especially the Amide map appears noisy, which might be caused by physiology-induced signal changes between the single-shot acquisitions11. In the future, this may be improved by including physiological recordings in the fit. In addition, an insufficient B1 field in the caudal part of the brain causes a contrast change in the maps. B1 shimming or parallel transmit excitation may be employed to mitigate this problem.
In summary, this work demonstrates the feasibility of centric-reordered single-shot 3D CEST EPI, which may be an important step towards the application of whole-brain CEST imaging studies on neurodegenerative diseases.
Acknowledgements
No acknowledgement found.References
1. van Zijl PCM, Lam WW, Xu J, et al. Magnetization Transfer Contrast and Chemical Exchange Saturation Transfer MRI. Features and analysis of the field-dependent saturation spectrum. NeuroImage. 2017;04:1053-8119
2. Poser BA, Koopmans, PJ, Witzel, T., et al. Three dimensional echo-planar imaging at 7 Tesla. NeuroImage. 2010;51:261–266.
3. Stirnberg R, Brenner D, Stöcker T, Shah NJ. Rapid fat suppression for three-dimensional echo planar imaging with minimized specific absorption rate. Magn. Reson. Med. 2016;76:1517–1523.
4. Zaiss M, Windschuh J, Paech D, et al. Relaxation-compensated CEST-MRI of the human brain at 7T: Unbiased insight into NOE and amide signal changes in human glioblastoma. NeuroImage. 2015;112:180-188.
5. Windschuh J, Zaiss M, Meissner JE, et al. Correction of B1-inhomogeneities for relaxation-compensated CEST imaging at 7 T. NMR in Biomed. 2015;28(5):529-537.
6. Smith SM, Jenkinson M, Woolrich MW, et al. Advances in functional and structural MR image analysis and implementation as FSL. NeuroImage, 2004;23:208-219.
7. Zaiss M. CEST sources. www.cest-sources.org. Accessed November 5, 2017.
8. Kim M, Gillen J, Landman BA, et al. Water saturation shift referencing (WASSR) for chemical exchange saturation transfer (CEST) experiments. Magn Reson. Med. 2009;61(6): 1441-1450.
9. Brenner D, Tse DHY, Pracht ED, Freiweier T, Stirnberg R, Stöcker T. (2014) 3DREAM – A Three-Dimensional Variant of the DREAM Sequence. Proc. Intl. Soc. Mag. Reson. Med. 22, 1455
10. Jones CK, Polders D, Hua J, et al. In vivo three‐dimensional whole‐brain pulsed steady‐state chemical exchange saturation transfer at 7 T. Magn. Reson. Med. 2012;67(6):1579-1589.
11. Van Der Zwaag W, Marques JP, Kober T, et al. Temporal SNR characteristics in segmented 3D-EPI at 7T. Magn. Reson. Med. 2012;67:344–352.
Figures