2229
Optimization and acceleration of Selective Inversion Recovery imaging for practical whole-brain quantitative Magnetization Transfer measurements1Institute of Imaging Science, Vanderbilt University Medical Center, Nashville, TN, United States
Synopsis
Selective inversion recovery quantitative magnetization transfer (SIR-qMT) imaging offers increased efficiency relative to conventional pulsed-saturation qMT due to its ability to quantify MT parameters without the need for independent estimates of B0, B1+, and T1. Despite this, qMT acquisition at a reasonable resolution over a large field of view remains prohibitively time consuming. Here, we employ an optimised acquisition strategy and accelerated readouts to acquire whole-brain SIR-qMT data at 2 x 2 x 3 mm3 resolution in ~10 minutes; opening the door to qMT imaging on a time scale practical for clinical application.
Introduction
Conventional magnetization transfer (MT) imaging probes the macromolecular content of biological tissue through the application of an off-resonance saturation pulse and measurement of the resulting attenuation of the water proton signal. The most commonly used metric to quantify this phenomenon is the magnetization transfer ratio (MTR). While MTR has been shown to correlate with macromolecular content (e.g. myelin content in brain tissue [1-4]), it is also sensitive to experimental parameters and other tissue properties such as relaxation times [5,6]; thus, its specificity and reproducibility are limited.
Quantitative magnetization transfer (qMT) approaches [6,7] usually employ a two-pool model of the MT effect between free and macromolecular water protons to isolate and quantify a number of distinct tissue parameters including the pool size ratio (PSR). PSR has been shown to correlate more closely with myelin content than does MTR [4,8,9]. While qMT parameters are more specific than conventional MTR measurements, the need for multiple measurements, and in some cases independent estimates of B0, B1+, and T1, can make whole-brain qMT prohibitively time-consuming, even when optimized acquisition strategies are employed.
Selective inversion recovery (SIR) [7,10] is a qMT imaging method that uses a low-power, on-resonance inversion pulse to invert the water protons with minimal effect on the macromolecular protons. The resulting biexponential recovery of the free water signal is then sampled at various inversion times (tI) typically using a 2D turbo spin echo (TSE) readout [11] to estimate four qMT parameters: PSR, kmf (the rate of exchange between pools), R1f (transverse relaxation rate of the free pool), and M0f (equilibrium magnetization of the free pool). While SIR has the advantage of not requiring additional scans to estimate model parameters, 2D SIR-TSE acquisitions are still relatively lengthy, hindering their application over any significant number of slices.
Here, we use an optimized SIR approach utilizing a 4-point model with fixed kmf in combination an an accelerated 3D EPI readout to achieve whole-brain coverage in ~10 minutes, making it for clinical usage.
Methods
SIR parameters ti and td are the inversion time the delay between end of the readout and subsequent inversion pulse respectively. A set of four ti/tD values were optimized using Cramer-Rao Lower Bound Theory and data reduction strategies. A healthy volunteer was scanned using a 3T Philips MR system. Three datasets were acquired with numerically-optimized tI/tD= 10/684, 10/4171, 278/2730, and 1007/10 ms; and with 2D TSE, 3D TSE, and 3D EPI readouts. All data were acquired at 2 x 2 x 3 mm3 resolution over a 216 x 216 x 99 mm3 FOV. Scan times were ~32 minutes (2D SIR-TSE), ~15 minutes (3D SIR-TSE), and ~10 minutes (3D SIR-EPI). SIR-EPI data were distortion corrected using topup in FSL [12]. Maps of PSR, R1f, and Sf were calculated with kmf fixed at 12.5 s-1. Eight ROIs were drawn in the corona radiata, occipital white matter, frontal white matter, genu, splenium, internal capsule caudate nucleus, and putamen; and the mean PSR and R1f were calculated.Results
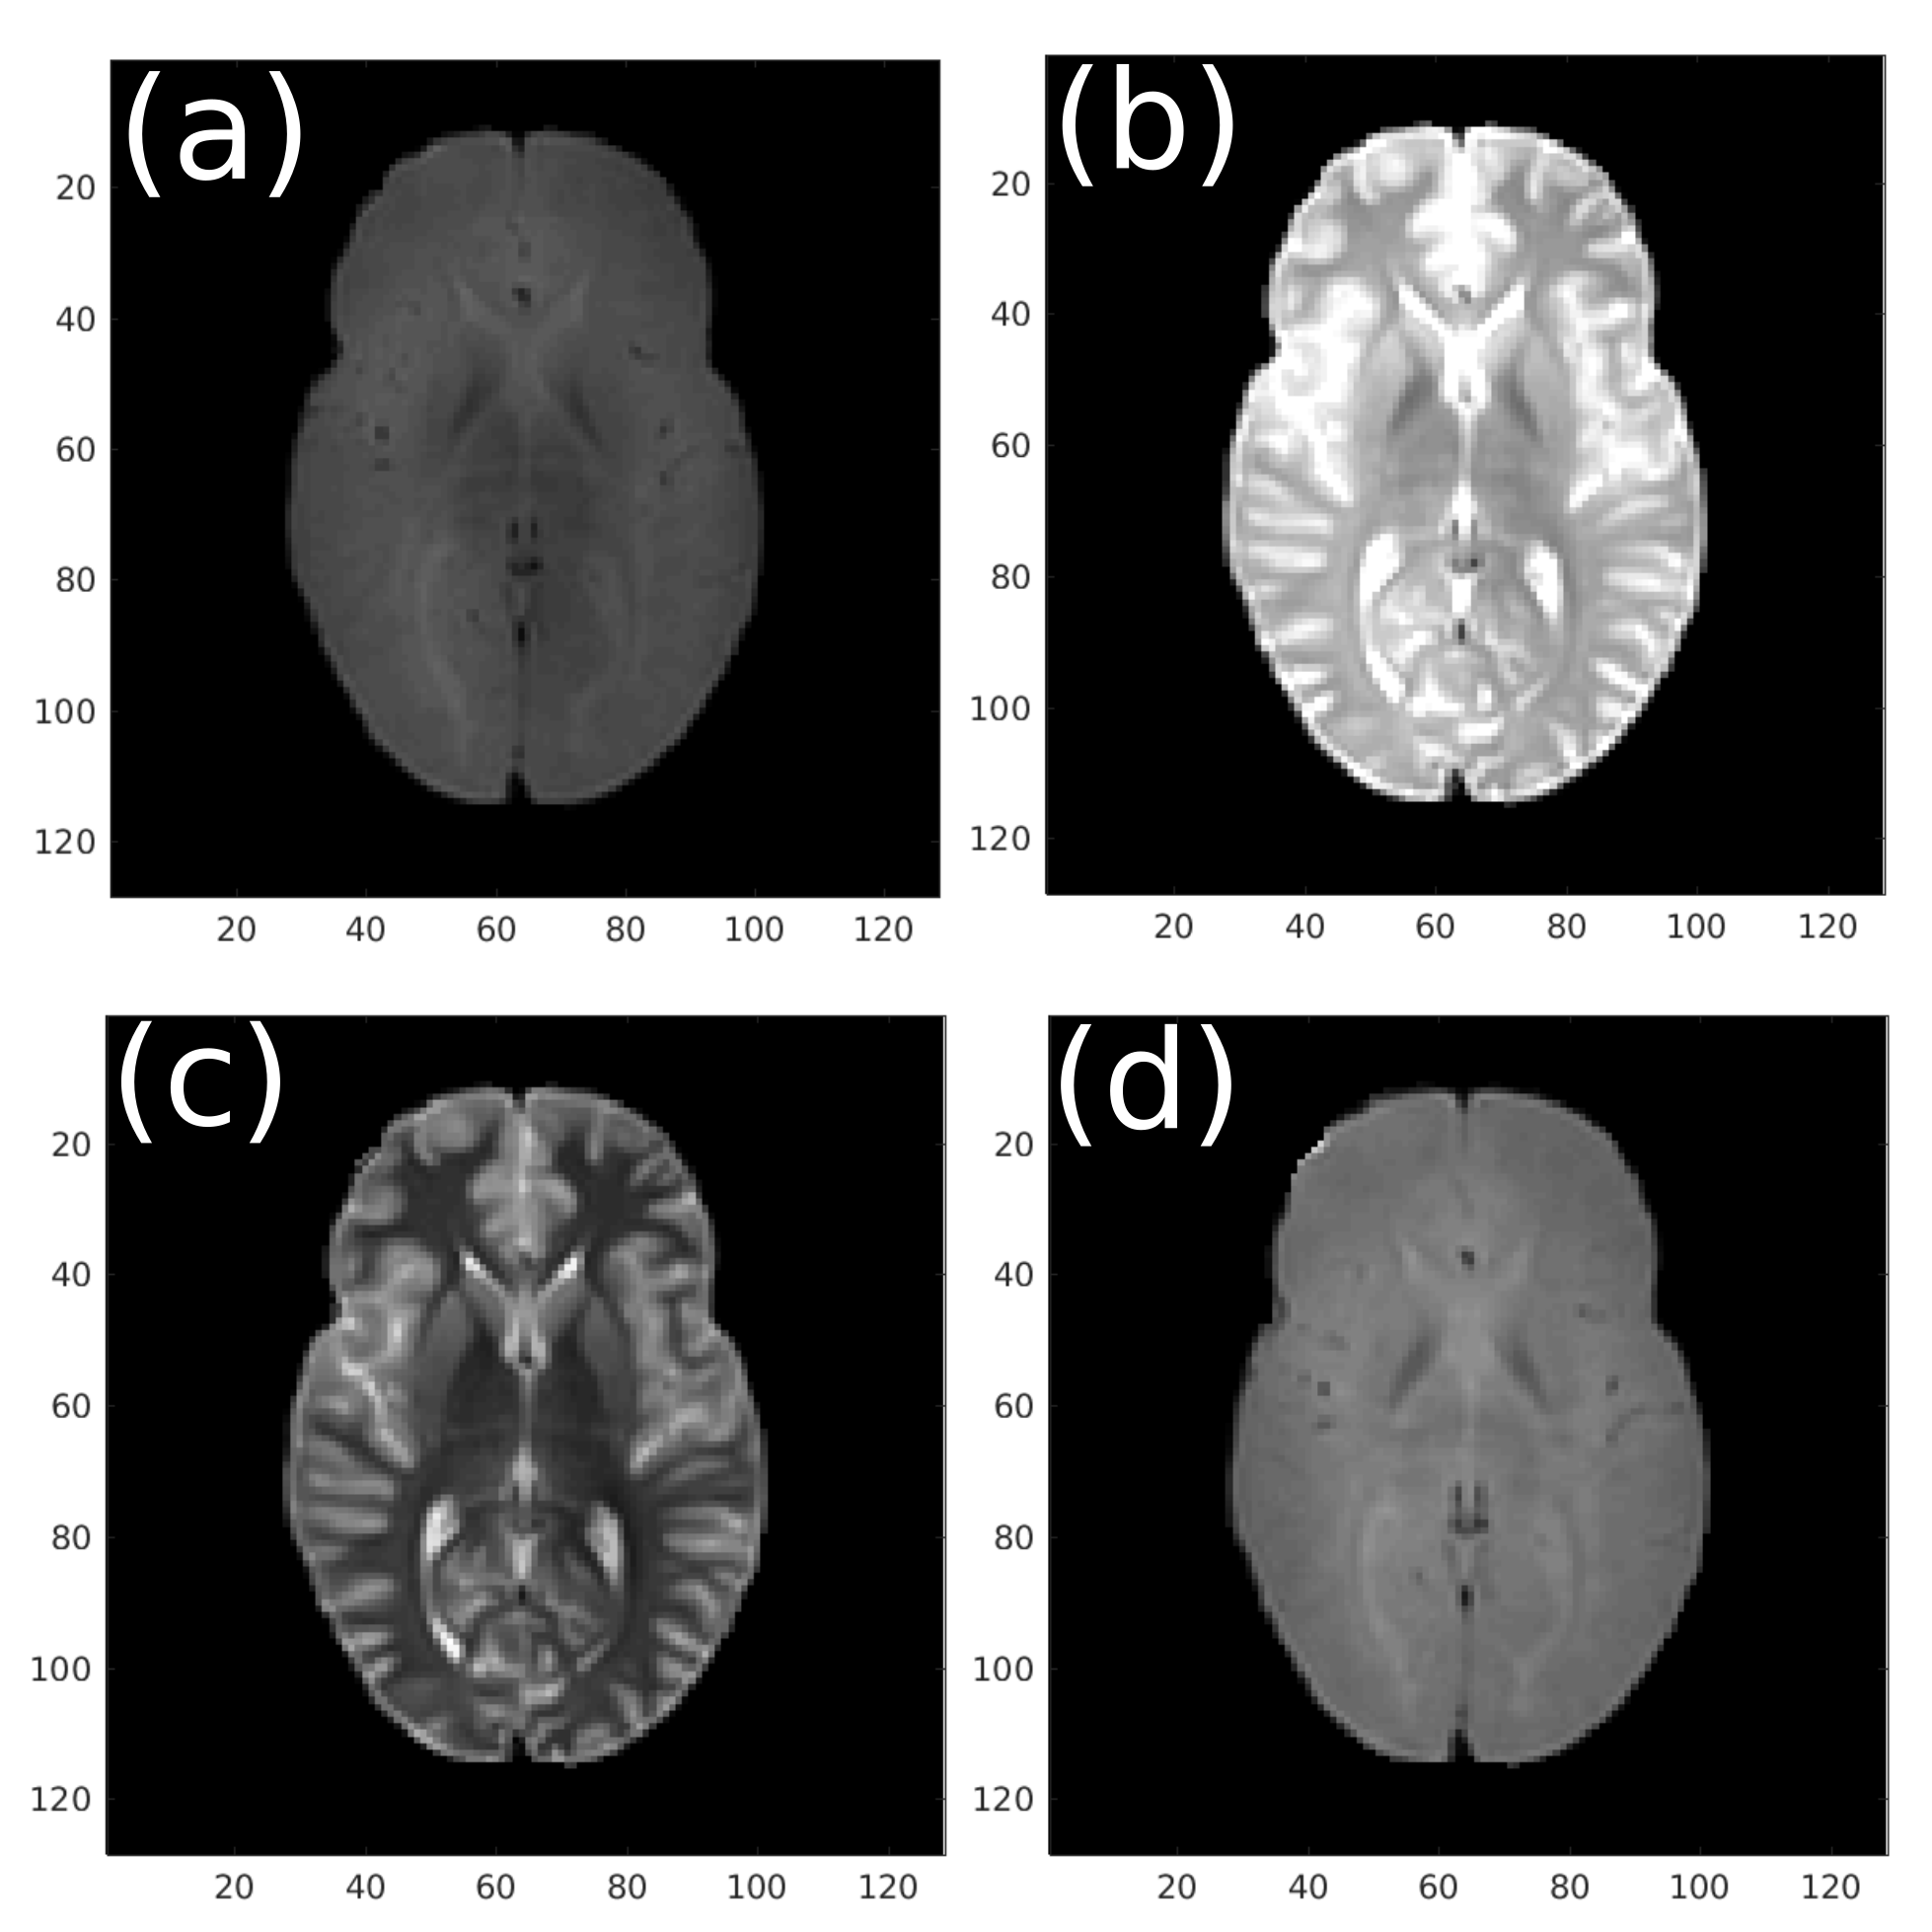
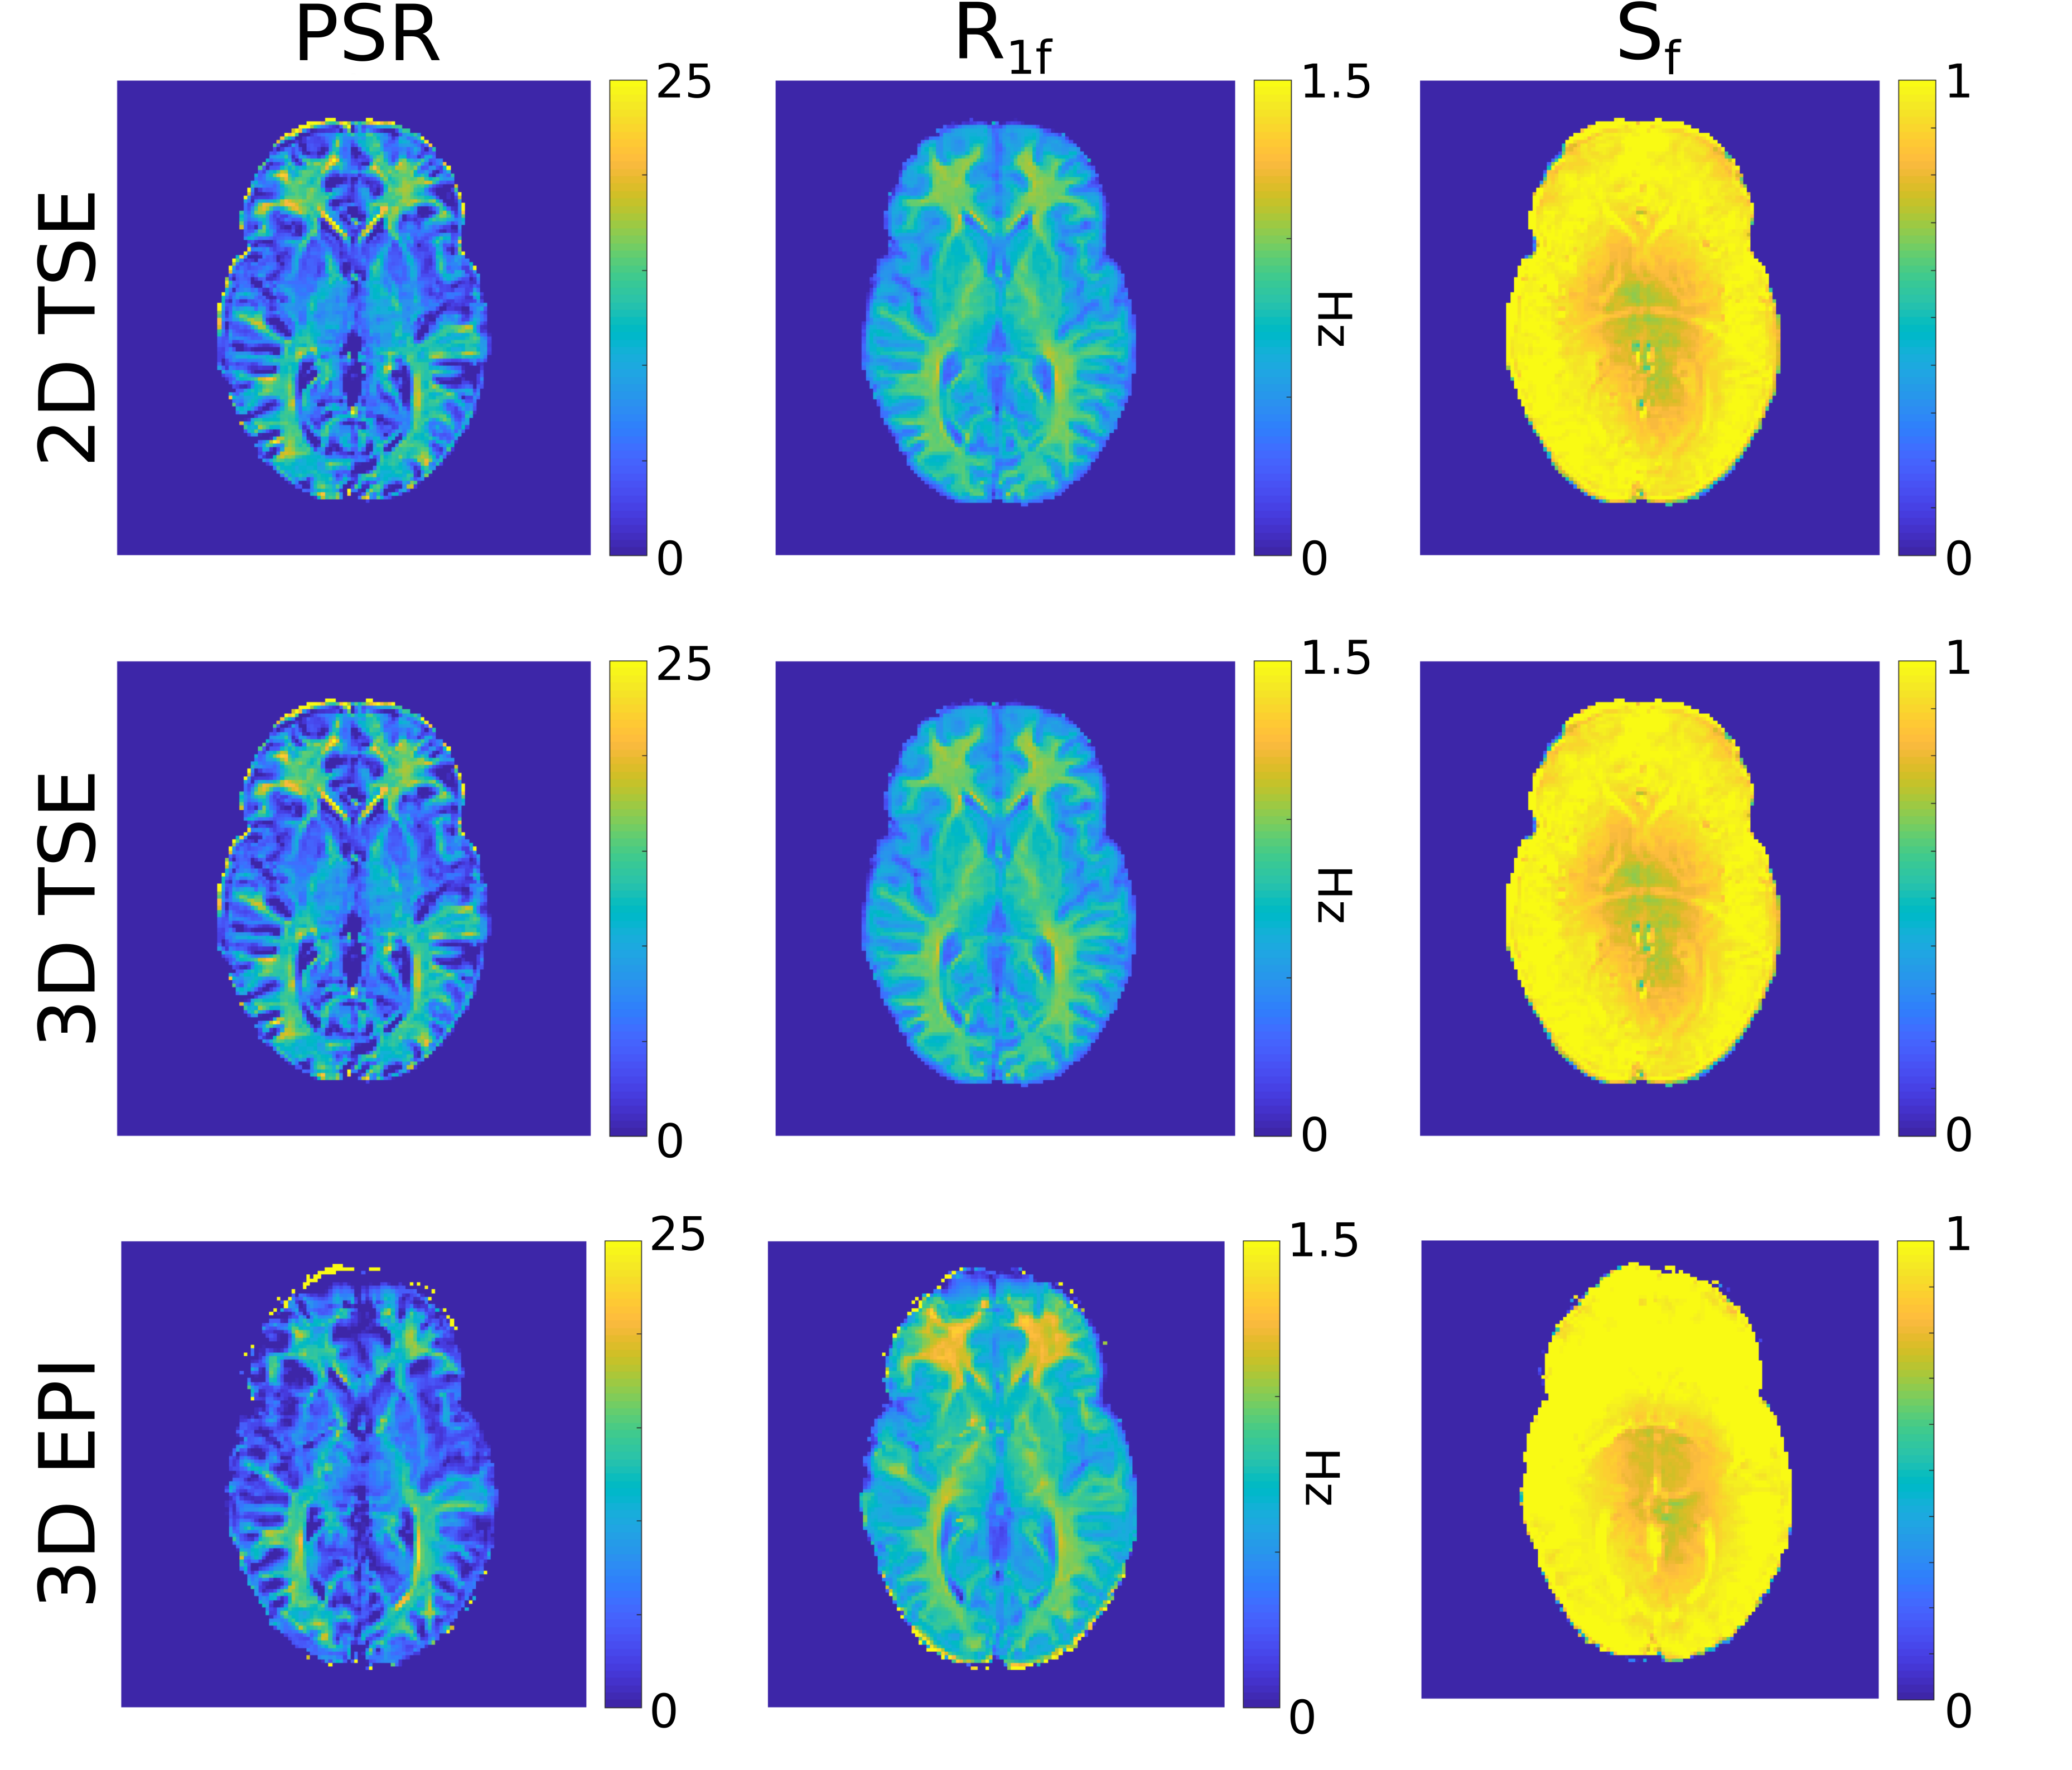
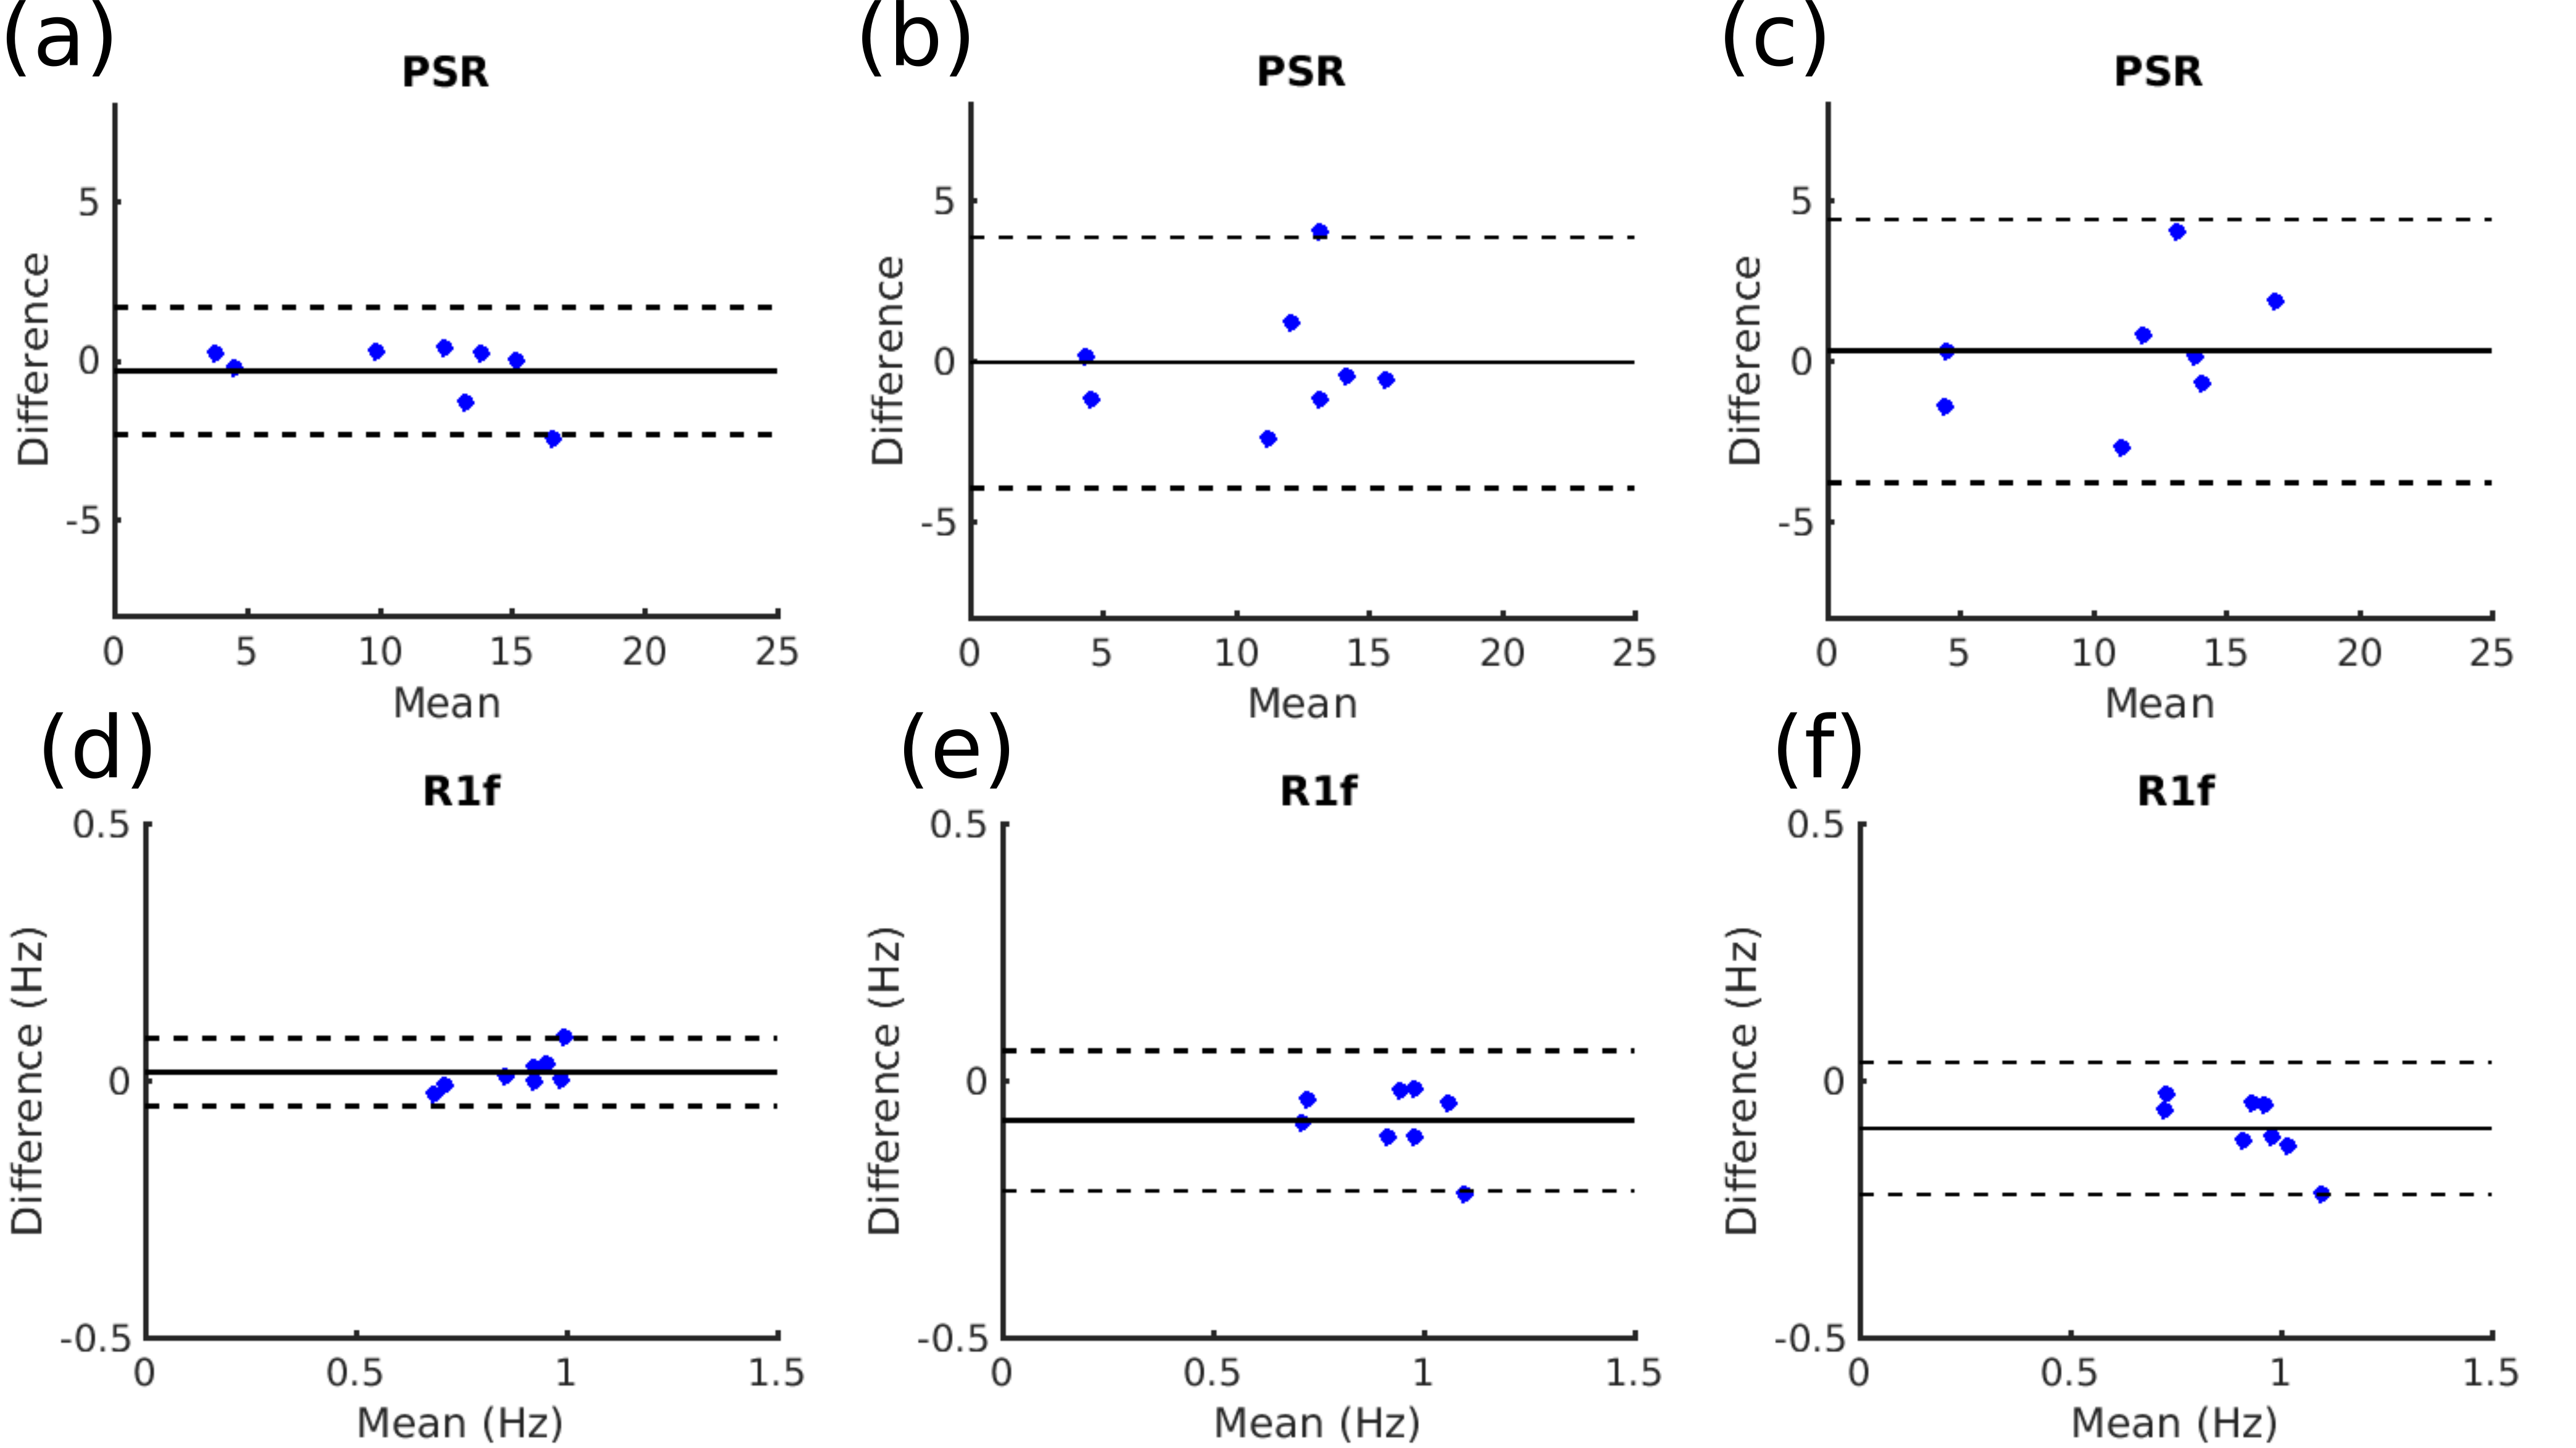
Figure 1 shows representative magnitude images from each ti/tD combination from the 2D SIR-TSE acquisition. Figure 2 shows PSR and R1f maps in a representative slice fitted from TSE; 2D EPI; 2D EPI; and 3D EPI SIR acquisitions. The PSR images show good qualitative agreement, while the 3D EPI readout yields higher R1f values in the frontal white matter relative to the TSE readouts. Figure 3 shows Bland-Altman plots for mean PSR and R1f values in the 8 ROIs comparing 2D and 3D SIR-TSE, and 3D SIR-TSE and 3D SIR-EPI. A paired t-test revealed significant differences in R1f measurements between 2D TSE SIR and 3D EPI SIR (p=0.01) and 3D TSE SIR and 3D EPI SIR (p=0.004). PSR was consistent across all methods.Discussion
The use of 3D EPI in place of 2D TSE readouts accelerated whole-brain SIR-qMT imaging by over a factor of three, resulting in an acquisition ~10 minutes, opening up the possibility of practical applications in the clinic. Visual assessment of PSR and R1f shows good agreement between all readouts in the posterior and medial sections of the images, while a clear increase in R1f can be seen in the frontal white matter of the 3D EPI SIR data. This may explain the statistically significant difference in R1f measurements across the 8 ROIs analyzed. Future work will focus on assessing the reliability of 3D EPI SIR across different brain regions and developing robust strategies to compensate for any regional bias, in addition to alternative acceleration strategies such as multi-band 2D imaging.Acknowledgements
No acknowledgement found.References
[1] Koenig SH Cholesterol of myelin is the determinant of grey-white contrast in MRI of brain. Magnetic Resonance in Medicine 1991;20(2):285-291.
[2] Kucharcyzk W et al. Relaxivity and magnetization transfer of white matter lipids at MR imaging: importance of cerebrosidesand pH. Radiology 1994;192(2):521-529
[3] Odrobina EE et al. MR properties of excised neural tissue following experimentally induced demyelination. NMR Biomed 2005;18(5):277-284
[4] Schmierer K et al. Magnetization transfer ratio and myelin in postmortem multiple sclerosis brain. Ann Neurol 2004;56(3):407-415.
[5] Berry I et al. A multicenter measurement of magnetization transfer ratio in normal white matter. J Magn Reson Imaging 1999;9(3):441-446
[6] Henkelman R et al. Quantitative interpretation of magnetization transfer. Magn Reson Med 1993;29(6):759-766
[7] Edzes H and Samulski, E. Cross relaxation and spin diffusion in the proton NMR of hydrated collagen. Nature. 1977;265(5594):521-3.
[8] Ou X et al. The MT pool size ratio and the DTI radial diffusivity may reflect the myelination in shiverer and control mice. NMR Biomed 2009;22(5):480-7
[9] Underhill HR et al. Fast bound pool fraction imaging of the in vivo rat brain: association with myelin content and validation in the C6 glioma model. Neuroimage 2011;54(3):2052-2065
[10] Gochberg D et al. Quantitative studies of magnetization transfer by selective excitation and T1 recovery. Magn Reson Med 1997;38(2):224-231
[11] Dortch RD et al. Quantitative magnetization transfer imaging in human brain at 3T via selective inversion recovery. Magn Reson Med 2011;66(5):1346-1352
[12] Andersson JLR et al. How to correct susceptibility distortions in spin-echo echo-planar images: application to diffusion tensor imaging. NeuroImage 2003;20(2):870-888
Figures