2227
Mapping elevated lactate levels after ischemic stroke using PROBE CEST/NOE: a feasibility study in patients at 3T1Max Planck Institute for Human Cognitive and Brain Sciences, Leipzig, Germany, 2Center for Stroke Research Berlin (CSB), Charité – Universitätsmedizin Berlin, Berlin, Germany
Synopsis
In ischemic stroke, anaerobic glycolysis leads to a local increase in lactate concentration. Such elevated levels of lactate can be detected via CEST/NOE. In vivo, several broad tissue contributions as well as metabolites lead to a complex intermingled baseline in Z-spectra. With PROBE, such effects are compensated based on healthy tissue, and a flat baseline is achieved. Stroke affected areas can hence be identified in direct contrast to healthy tissue. Lactate contributions to the Z-spectrum became distinctively observable. The feasibility was demonstrated in-vivo for thalamic stroke in a clinical setting at 3T.
Purpose
This study aims at identifying the ischemic regions around infarcted areas via high-resolution metabolic mapping at 3T. Both chemical exchange saturation transfer (CEST)1 and the nuclear Overhauser effect (NOE)2 are commonly applied for the detection of low-concentrated solute metabolites through off-resonance saturation leading to an attenuated water signal.
A distinct observation of individual metabolite contributions to the Z-spectrum was enabled via a recently introduced method referred to as Prospective Baseline Enhancement (PROBE)3,4, where confounding background contributions are compensated via a bespoke set of saturation pulse amplitudes. Lactate as a marker for ischemic stroke5,6 shows three resonances7,8 that can be exploited for metabolite identification.
Methods
Suitable saturation amplitudes for PROBE were calculated based on white-matter Z-spectra of 3 healthy subjects (22-29y; 2F/1M) at 3T (Siemens MAGNETOM Prisma). The saturation pulse amplitudes were optimized3,9 such that the Z-spectrum baseline appears flat for healthy tissue. Any deviation in either the tissue background or metabolite contributions will become directly observable on the obtained flat baseline.
Three stroke patients (56-80y; 2F/1M) were recruited after ischemic stroke onset. All were part of a prospective observational trial (LOBI-BBB, NCT02077582), which had been approved by the local Ethics Committee. MR imaging of stroke patients and healthy controls (46-47y; 1F/1M) was done at 3T (Siemens Tim TRIO). All stroke patients underwent FLAIR, DWI and T2* imaging on days 1 and 2. The PROBE acquisition was performed on day 4 (two subjects) and day 2 (one subject), respectively, after onset within an extra session that consisted of a short anatomical scan, a B0 map, and the PROBE acquisition (single slice through the center of the stroke lesion).
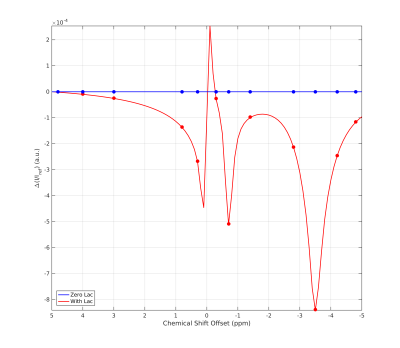
For PROBE imaging, 2D saturation-prepared GRE images were acquired with α=78°, TR/TE=200/7.1ms, 100ms Gaussian saturation pulse, gradient/RF-spoiling, edge-in k-space sampling, nominal resolution 0.9x0.9x4mm³ (Gaussian windowing). Saturation offsets were distributed according to metabolite peak resonances (Fig. 1) and limited to 18+2 unsaturated reference images (I0) for normalization and signal drift correction, TA=17.5min (basis frequency was adjusted regularly). All PROBE Z-spectra were retrospectively I0 normalized and B0 corrected via voxelwise look-up correction3.
Lactate exhibits two upfield metabolite peaks via NOE for CH- and CH3-groups10 and one OH-CEST peak downfield from the water resonance7,8. For reliable identification, all three metabolite peaks had to be observed, as determined via binary masking based on local minima (1st and 2nd order gradient calculation). Furthermore, motion artifacts were excluded via standard deviation thresholding along the Z-spectra.
Results and Discussion
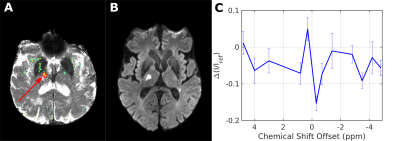
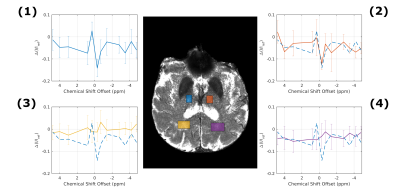
Simulations11,12 using the same background as in PROBE with or without additional lactate (Fig. 1) show a flat baseline without lactate and three distinct peaks with lactate. Two subjects (thalamic (day 4) and middle cerebral artery stroke (day 2)) showed similar results, while one subject (anterior cerebral artery stroke (day 4)) was unincisive. Here, we show results from a thalamic stroke in the right hemisphere. Figure 2A shows the combined intensity of the lactate CH- and CH3- peaks (compared to baseline). Elevated levels of lactate coincide with hyperintense regions in the diffusion-weighted image (Fig. 2B). Z-spectra of the stroke ROI (Fig. 2C) exhibit all three lactate peaks, as expected. ROI analysis yielded a high specificity for stroke region (Fig. 3). For non-infarcted regions in WM (3&4), the PROBE Z-spectra appear flat. While there were residual deviations from a flat baseline in the contralateral non-infarcted thalamic region (2) the lactate spectrum consisting of three peaks was not observed.
While B0 induced distortions to the baseline in Z-spectra were addressed and corrected, such changes also affect the offset position and intensity of metabolite peaks. Hence, the resulting intensity maps from our sparsely offset sampled PROBE acquisition depict only relative metabolite changes. However, the presumably strong increase in lactate following ischemia leads to detectable changes in PROBE Z-spectra, providing a biomarker for affected tissue.
In contrast to asymmetry-based analyses, PROBE allows an independent investigation of metabolite peaks up- and downfield from the water resonance, which is highly beneficial for a more reliable metabolite assignment supported by otherwise overlapping peaks.
Conclusions
This preliminary study shows that the PROBE approach has the potential for metabolic identification and classification of infarcted tissue. The feasibility for in-vivo application in a clinical setting even at 3T was successfully demonstrated. In comparison to existing CEST/NOE methods, the high specificity of PROBE enabled an enhanced distinction between different metabolite contributions.Acknowledgements
This work was funded through Helmholtz Alliance ICEMED.References
[1] K.M. Ward et al., A New Class of Contrast Agents for MRI Based on Proton Chemical Exchange Dependent Saturation Transfer (CEST), JMR, 143 (2000) 79-87.
[2] A.W. Overhauser, Polarization of nuclei in metals, Phys. Rev., 92 (1953) 411.
[3] T. Lenich et al., Prospective Baseline Enhancement (PROBE) in Z-spectra by variable saturation power: Probing lactate via NOE at 3T and 7T (in vitro), in: Music City CEST, Nashville, TN, USA, 2017.
[4] T. Lenich et al., Peak RF Optimization for Baseline Enhancement (PROBE) for CEST/NOE with in-vitro application at 7T, in: ISMRM Annual Meeting, Honolulu, HI, USA, 2017, pp. 3780.
[5] J.H. Gillard et al., Proton MR spectroscopy in acute middle cerebral artery stroke, Am. J Neuroradiology, 17 (1996) 873-886.
[6] G.W.J. Harston et al., Identifying the ischaemic penumbra using pH-weighted magnetic resonance imaging, Brain, 138 (2015) 36-42.
[7] V. Govindaraju et al., Proton NMR chemical shifts and coupling constants for brain metabolites, NMR in Biomed., 13 (2000) 129-153.
[8] P.C.M. van Zijl et al., Magnetization Transfer Contrast and Chemical Exchange Saturation Transfer MRI. Features and analysis of the field-dependent saturation spectrum, Neuroimage, In Press (2017).
[9] D.J. Clark et al., Investigating hydroxyl chemical exchange using a variable saturation power chemical exchange saturation transfer (vCEST) method at 3 T, MRM, 76 (2016) 826-837.
[10] S.D. Swanson, Protein mediated magnetic coupling between lactate and water protons, JMR, 135 (1998) 248-255.
[11] T. Lenich et al., Matrix-Algebra-Based Modeling Approach to MT, NOE and CEST for an Arbitrary Number of Interacting Spin Pools, in: ISMRM Annual Meeting, Toronto, ON, Canada, 2015, pp. 3347.
[12] D.K. Müller et al., Matrix-algebra-based calculations of the time evolution of the binary spin-bath model for magnetization transfer, JMR, 230 (2013) 88-97.
Figures


