2226
Pre- and post-contrast glucoCEST weighted MRI both detect hypometabolism following experimental TBITsang-Wei Tu1,2, Jaclyn Witko2, and Joseph Frank2
1Howard University, Washington, DC, United States, 2National Institutes of Health, Bethesda, MD, United States
Synopsis
This study compared the endogenous glucoCEST contrast to the glucoCEST with exogenous glucose delivered as contrast agent in experimental TBI. By giving relatively low concentration (0.3g/kg) of 2DG solution, the post-contrast glucoCEST weighted images could magnify the contrast changes in the brains before and after TBI. Meanwhile, the endogenous glucoCEST weighted images also detected the same pattern of decreased contrast in the TBI brains and that was validated by 2DG autoradiography. Our findings substantiate that the glucoCEST technique has potential to detect the hypometabolic syndrome following TBI, even without using exogenous contrast agent.
Introduction
Recently, the endogenous glucoCEST weighted MRI has also been shown useful to detect the delayed glucose hypometabolism in experimental TBI without delivering exogenous glucose as contrast agent.1 Question arises in regards to whether the endogenous glucoCEST contrast is reflecting the changes of glucose metabolism under complications from other metabolites (e.g. myo-inositol, creatine, glutamate) in the living tissue. To elucidate the source of contrast changes in the glucoCEST weighted MRI in TBI, the current study compared the endogenous glucoCEST contrast to the glucoCEST with exogenous glucose delivered as contrast agent in experimental TBI. The MRI results were compared to the gold standard 14C-2-deoxyglucose (2DG) autoradiography for evaluating the sensitivity and specificity in the detection of hypometabolic syndrome following TBI by glucoCEST.Materials and Methods
6 female 12-week-old SD rats had mild TBI in 2 consecutive days using a 2m height/450g weight drop model.2 The animals were imaged before the induction of TBI as the normal control and 1 week after TBI. GlucoCEST datasets were acquired in vivo using a Bruker 9.4T scanner by 2D fast spin echo (TR/TE 2.1s/10.4ms; rare factor 4; in plane resolution: 200µm2, thickness: 0.8mm) with (MT) and without (M0) MT saturation pulses (2μT/2s). The first glucoCEST experiment was acquired without exogenous contrast agent by MT offset frequences (Δω) from -1.6kHz to +1.6kHz with 100Hz stepping to sample 33 points in the frequency offset range from -4ppm to +4ppm covering three glucose chemical shifts (1.2, 2.1, 2.9 ppm).3 Procedure according to the WAter Saturation Shift Referencing (WASSR) method was applied to correct the B0 and B1 field inhomogeneity of the CEST data.4 Thereafter, 20 dynamic glucoCEST enhancement (DGE) experiments (same imaging parameters except for rare factor 8; resolution 850µm2; 13 CEST points; scan time: 2m44s/each repetition, total scan: ~60 mins) were performed by delivering 0.3g/kg 2DG solution through tail vein catheter after 4 baseline acquisitions. The first CEST experiment was then repeated again with second delivering of 2DG solution in the same dose. The glucoEST weighted MRI contrast was derived by MTR asymmetry analysis calculating the area under the curve (a.u.c.) according to previous glucoCEST literatures: (1) 0.75-1.7 ppm5, (2) 0.75-4 ppm6 and (3) 1.2 (±0.4), 2.1 (±0.2), 2.9 (±0.1) ppm1 for detecting the proton metabolites of glucose. After each scan, 3 rats were randomly selected and processed for 14C-2DG autoradiography. Data were examined by one-way ANOVA using Prism v6.0 and Matlab scripts.Results
Figure 1 compared the in vivo glucoCEST images, with or without the delivering of 2DG, of the normal and TBI rat brains. The glucoCEST images derived from 0.75-1.7 ppm displayed few contrast enhancements after giving 2DG, while both of pre- and post-contrast images show decreased contrast in the TBI brains than the normal brains. The glucoCEST images derived from 0.75-4 ppm exhibited significant increase of contrast in post-contrast images. In the TBI brain, the glucoCEST images contrast was clearly decreased no matter in pre- or post-2DG injection. After delivery of 2DG, the glucoCEST contrast derived by integrating the a.u.c. in glucose chemical shifts at 1.2 (±0.4), 2.1 (±0.2), 2.9 (±0.1) ppm increased ~20% in the brains (Fig. 2A); similarly, the TBI brains exhibited decreasing glucoCEST contrast significantly in both pre- and post-2DG injection. 2DG autoradiography also showed comparable pattern of the contrast changes that the TBI brains exhibited decreased glucose uptake and metabolism (Fig. 2B). The corresponding quantification indicated that the post-contrast glucoCEST has stronger significant changes (p<0.01) comparing to the pre-contrast glucoCEST (p<0.05, Fig. 3). The DGE experiments showed lesser contrast enhancement in the TBI brains than that in the normal brains (Fig. 4).Discussion
Mild TBI has been termed “a silent epidemic”, in part because the hypometabolic syndrome may last for years that current imaging technologies are insensitive to recognize it.4 The current study demonstrated that the uptake of 2DG was decreased significantly in the rat model of TBI showing hypometabolic syndrome. By giving relatively low concentration (0.3g/kg) of 2DG solution, the post-contrast glucoCEST weighted images could magnify the contrast changes in the brains before and after TBI. At the same time, the endogenous glucoCEST weighted images also detected the same pattern of contrast change, which was further validated by 2DG autoradiography. The hypometabolic state of the brain following TBI might be caused by the alternated cerebral blood flow, damaged glucose transporter, inflammation, activated astrocyte–neuron lactate shuttle and increasing cell death. Our findings substantiate that the glucoCEST technique has strong potential to be the non-invasive imaging modality for detecting the hypometabolic syndrome following TBI, even without using exogenous contrast agent.Acknowledgements
No acknowledgement found.References
1. Tu et al., ISMRM abstract 2017, #4522. 2. Tu et al., Annals of Neurology 2016 79: 907-920. 3. Chan et al., MRM 2012 68: 1764-1773 4. Kim et al., MRM 2009 61:1441-1450. 5. Nasrallah et al., JCBFM 2013 33: 1270-1278 6. Walker-Samuel et al., Nat.Med. 2013 19: 1067-1072 7. Rusnak et al., Nat.Rev.Neu. 2013 9:186-187Figures
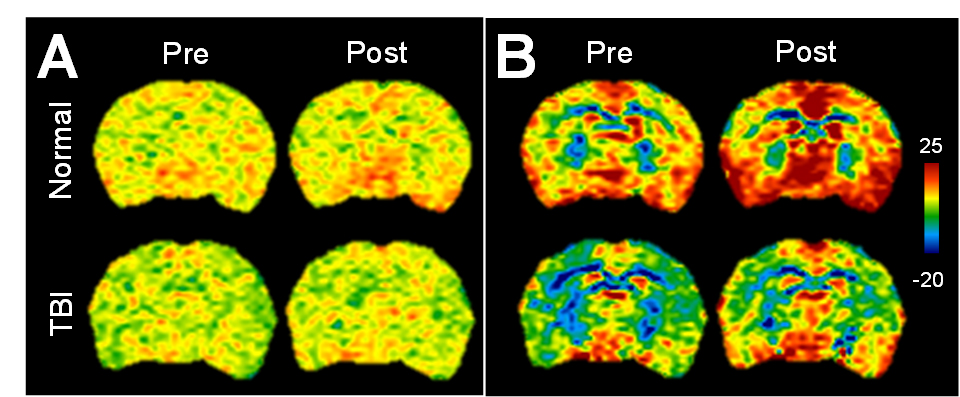
Fig.1 Pre- and post-contrast
glucoCEST images derived from (A) 0.75-1.7 ppm (B) 0.75-4 ppm in the normal and
TBI brain.
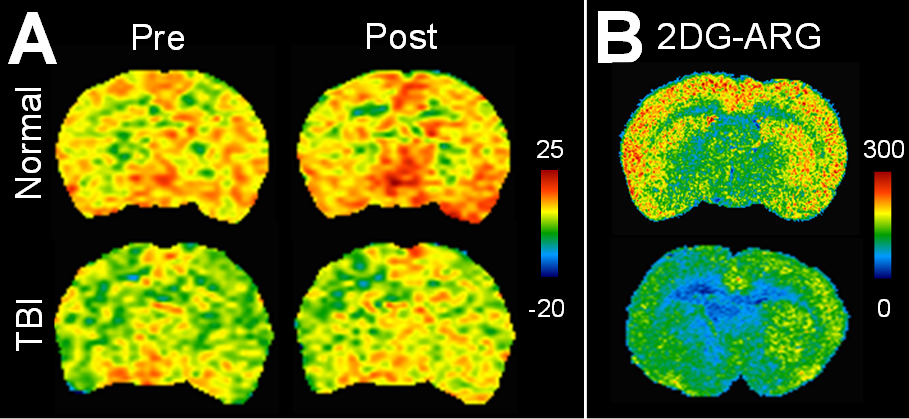
Fig.2 (A) Pre- and post-contrast
glucoCEST images derived from 1.2 (±0.4), 2.1 (±0.2), 2.9 (±0.1) ppm in the normal and TBI
brain. (B) 2DG autoradiography images of the normal and TBI brain.
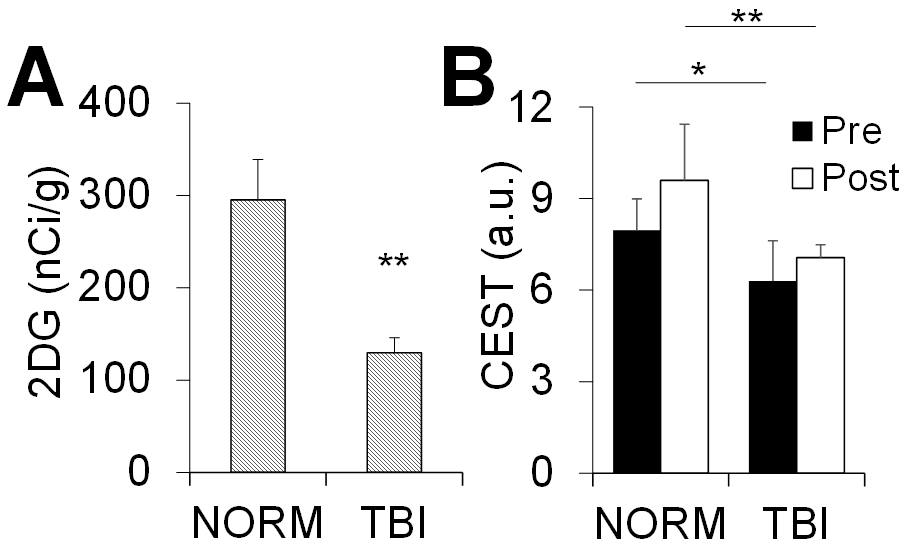
Fig.3 Corresponding
quantification of figure 2: (A) 2DG autoradiography, (B) glucoCEST weighted MRI.
Data were acquired from the cerebral cortex. * p<0.05, ** p<0.01.
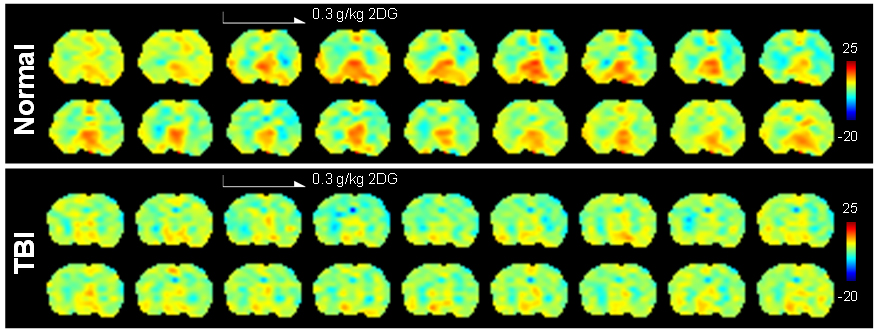
Fig.4 Series image of the dynamic
glucoCEST enhancement (DGE) experiments in the normal and TBI brains.