2225
Myocardial Creatine CEST in human heart using a segmented pseudo steady state acquisition over multiple short breathholds1Department of Radiology, University of Pennsylvania, Philadelphia, PA, United States
Synopsis
A technique to acquire creatine CEST of the myocardial muscle is presented here. The technique uses a pseudo steady state saturation, segmented readout, and multiple, short breathholds.
Introduction
Creatine CEST is a technique that utilizes saturation transfer to indirectly measure metabolite concentration with greatly enhanced sensitivity compared to spectroscopy.1 Though this offers the potential for spatial mapping of the myocardial creatine, the technique is very challenging for the moving tissue of the heart2,3 since prolonged saturation is required. Here we demonstrate a technique for applying CEST to the human heart that applies saturation with every heartbeat, developing a pseudo steady state saturation. A segmented k-space readout is included to minimize readout time and preserve contrast.Methods
CEST-weighted images were acquired with a spoiled gradient echo sequence with the following parameters: flip angle 20 deg, TR/TE = 4.0 ms/ 1.9 ms, FOV = 340x255 mm2, matrix size 128x96, slice thickness 8 mm. Saturation consisted of two 96 ms Hanning-apodized square pulses with a 4 ms interpulse delay with a 3.0 uT amplitude. Offset frequencies were acquired at positive and negative 1.8 ppm with a range of ± 0.9 in steps of 0.3 ppm. Each frequency was acquired in a single end-expiration breath hold with 5 segments. Two additional dummy segments were applied to drive the saturation response to a pseudo steady state.Field maps were acquired using a three echo version of the same GRE sequence with the following changes: TR = 8.9 ms, ΔTE = 2 ms, 4 segments, no dummy acquisitions. A WASSR4 field map was also acquired for comparison using a similar saturation prepared sequence to the CEST-weighted images except that saturation was reduced to a single pulse of amplitude 0.3 uT, and the number of segments was reduced to 3. Transmit RF inhomogeneity was also measured using a sequence of 20, 40, and 80 degree hard prep pulses followed by gradient echo readout. A 4 s interval was used between preps to ensure almost complete recovery.Images were coregistered using a phase correlation method5. Z-spectra were spline interpolated and B0-corrected. MTR asymmetry at 1.8 ppm was mapped and linearly corrected with the relative B1 field strength.
Results and Discussion
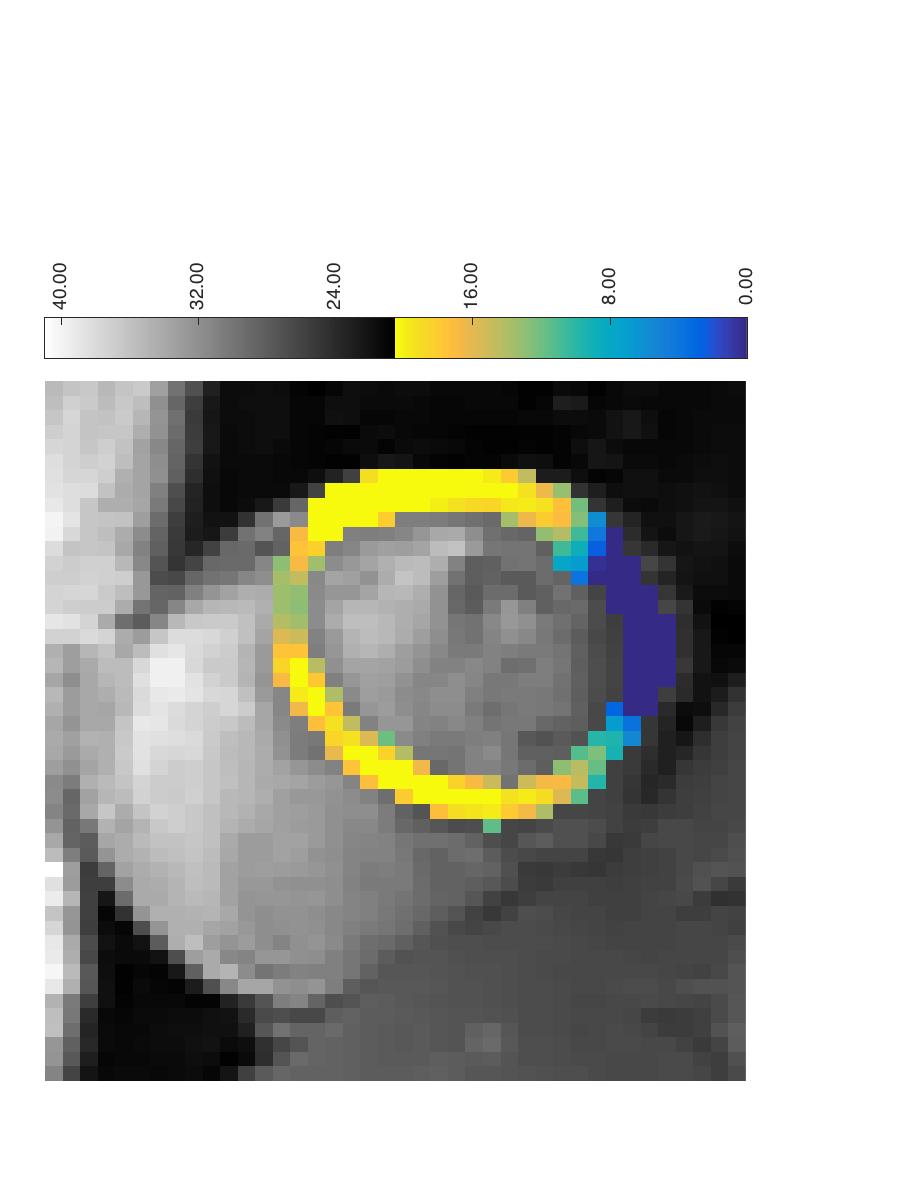
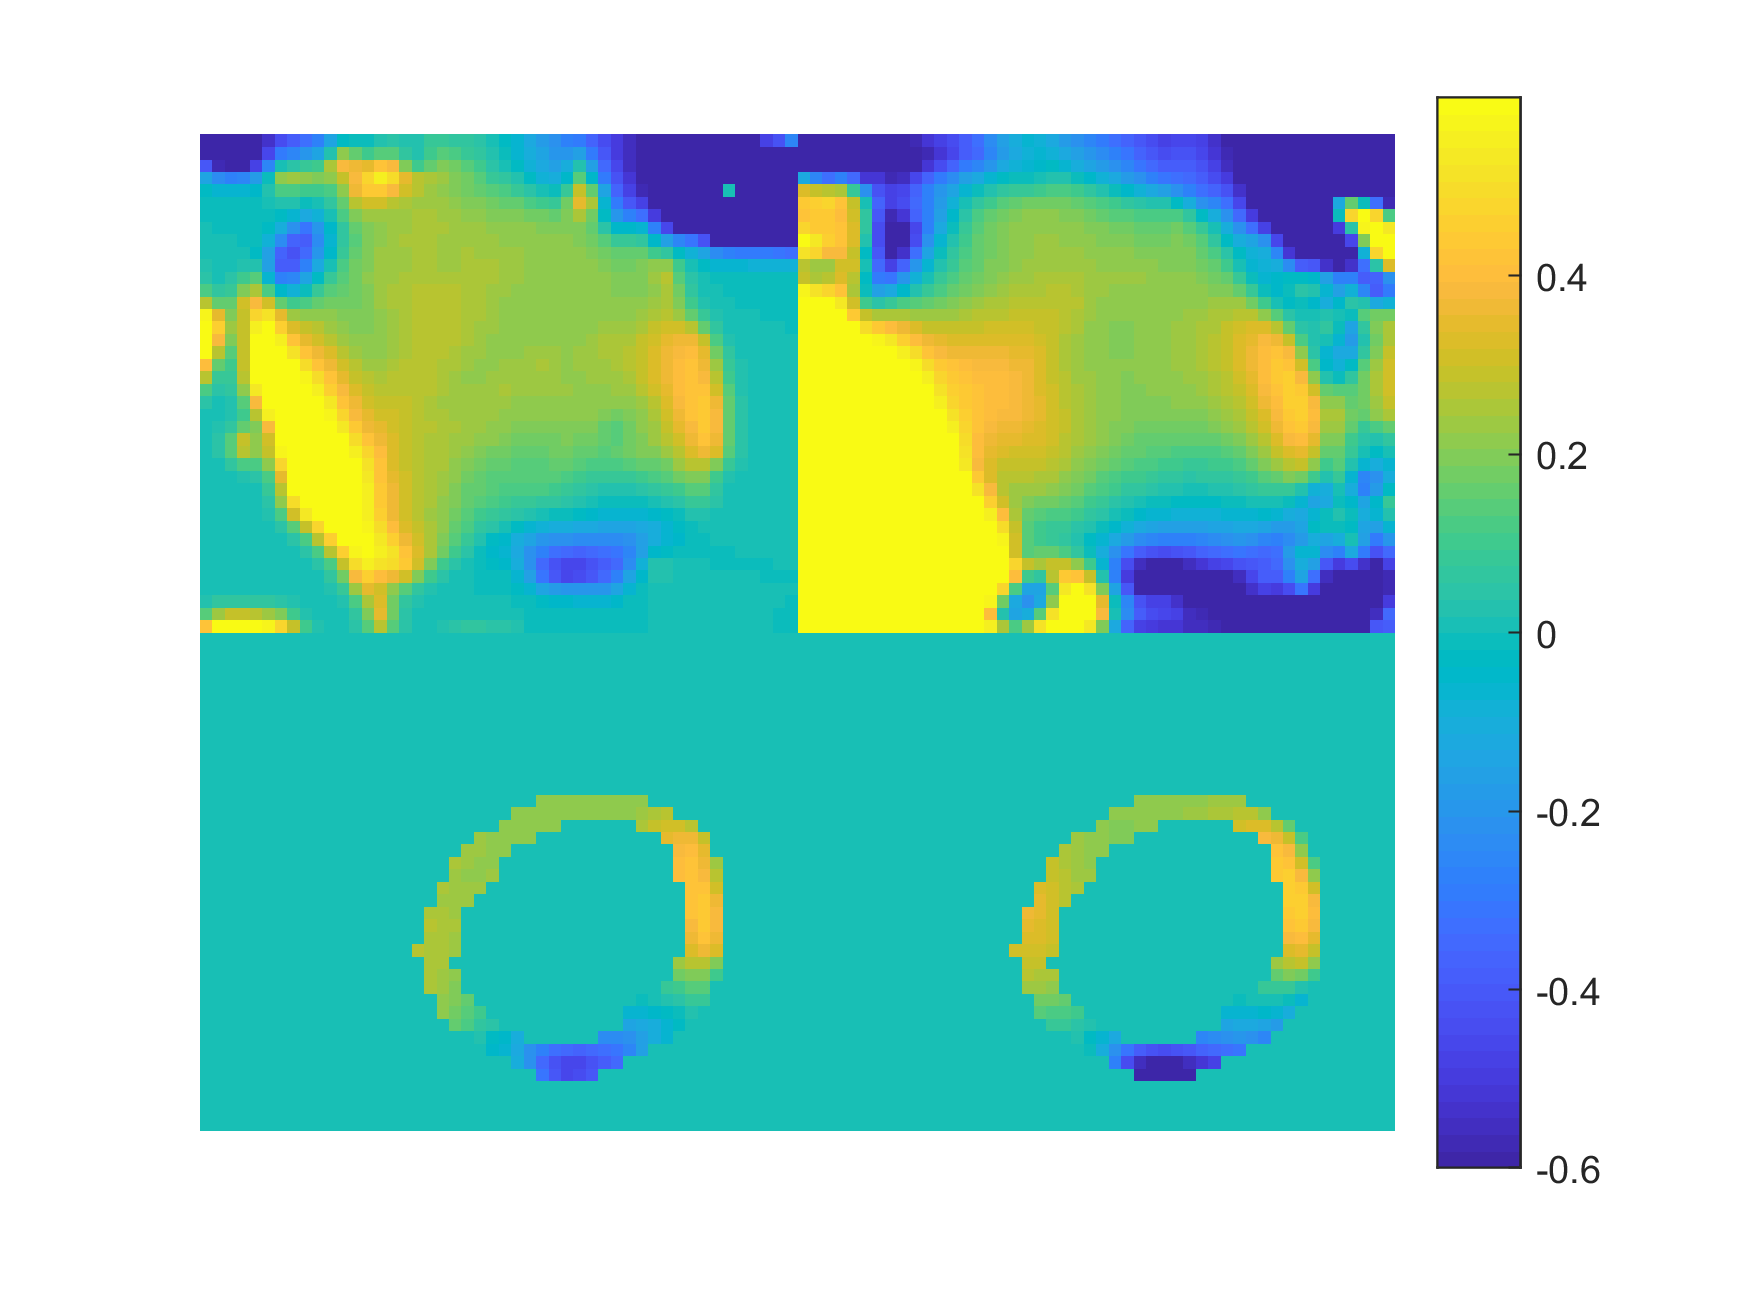
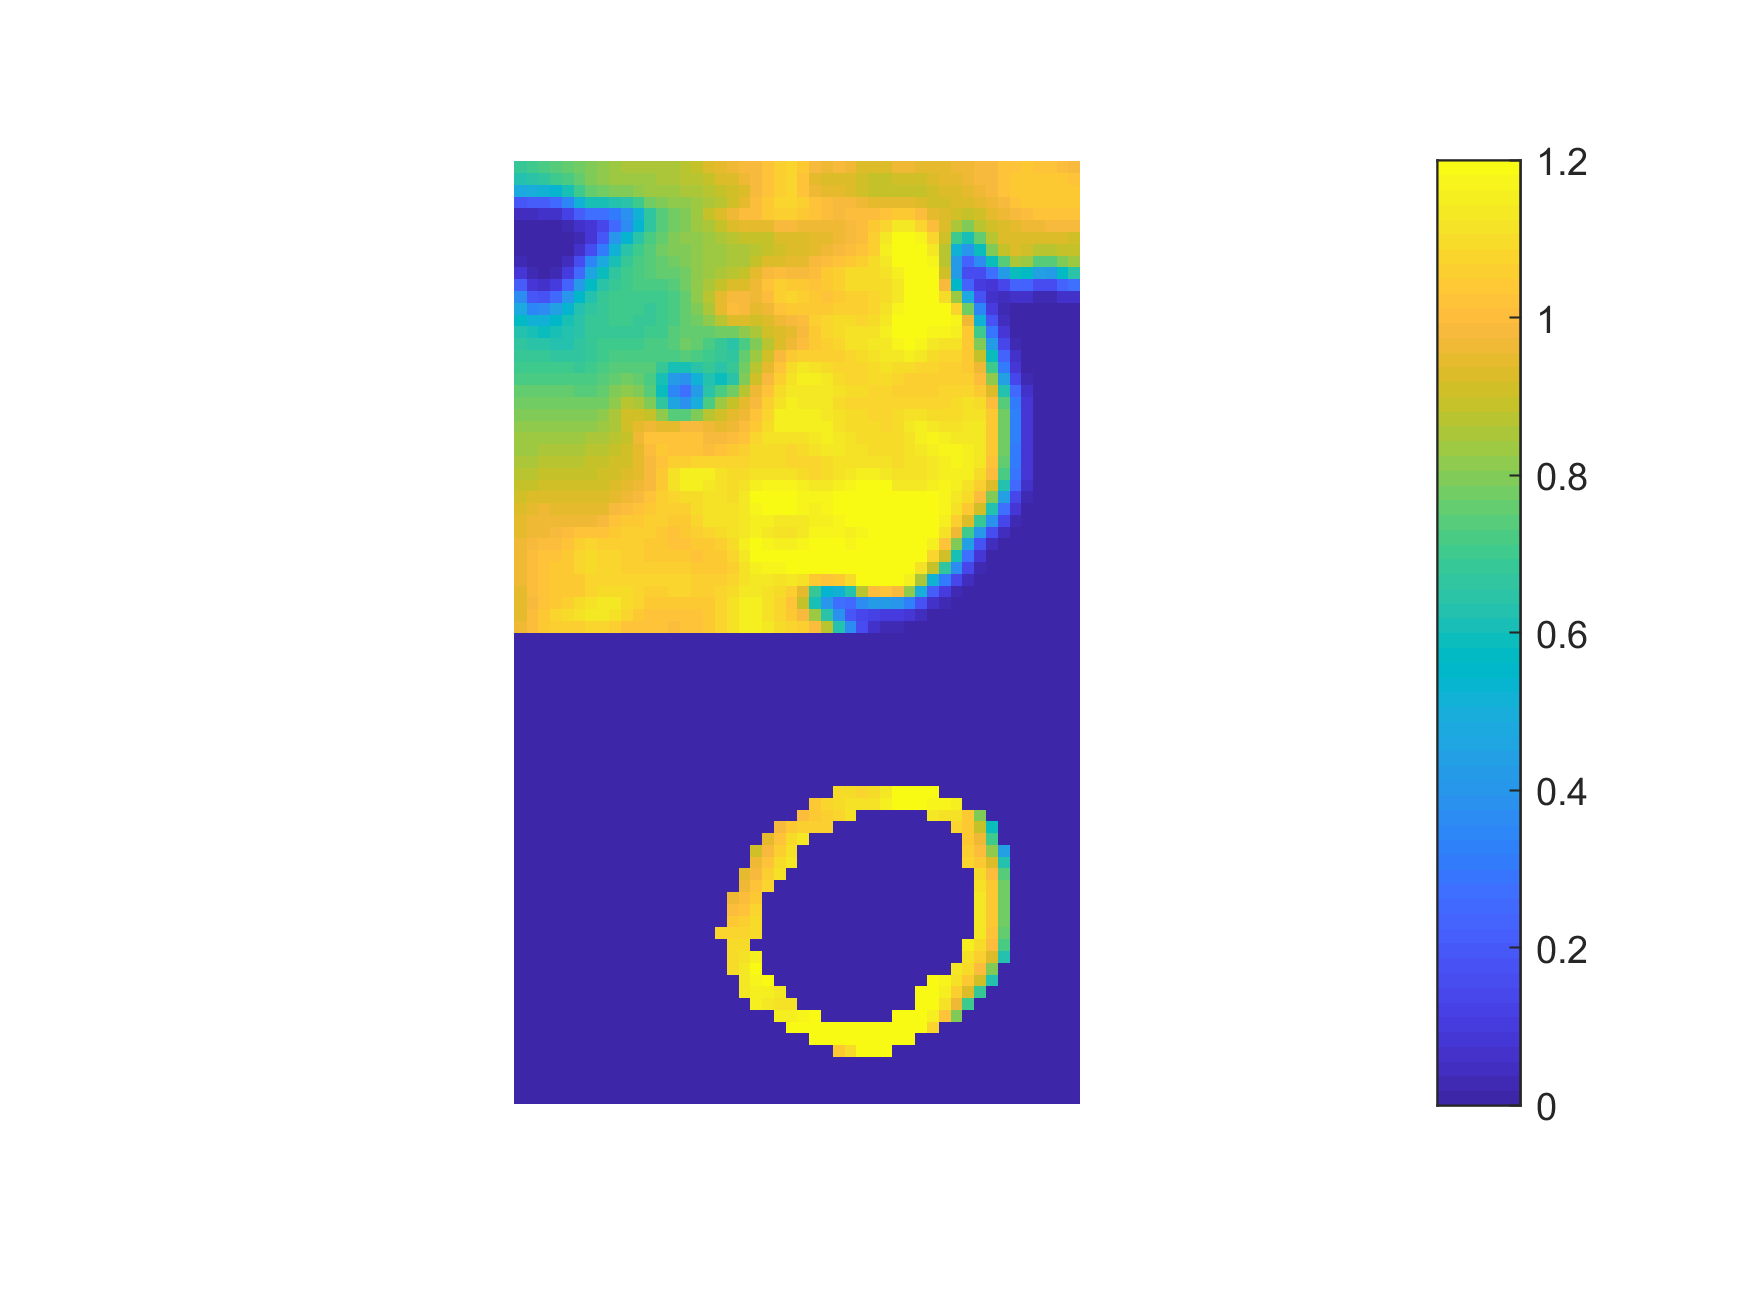
A MTR asymmetry map from a healthy volunteer is shown in Figure 1. Strong CEST signal from creatine is observed in the myocardial wall except near the bottom of the image. This is a due to the large change in susceptibility between the heart muscle and the air interface and is reflected in the B0 field maps shown in Figure 2. Figure 3 shows the B1+ relative field map.Because this technique relies on breathholds, each acquired frequency can be broken up into multiple segments. This has the advantages that individual acquisitions are shorter, allowing for a greater portion of the saturation to occur in diastole. In addition, since CEST contrast is lost during readout, shorter segmented readouts preserve the contrast better and results in higher MTR asymmetry.Here, we used image coregistration to mitigate any errors due to subtraction. However, for this subject, registration was not necessary do to the consistency of the breathholds. Even in less consistent cases, the amount of motion correction required is not as large as with free breathing.Acknowledgements
No acknowledgement found.References
1) Haris et al. Nature Medicine 20, 209–214 (2014).
2) Vandsburger et al. Circulation: Cardiovascular Imaging. 8:e002180 (2015).
3) Zhou et al. JCMR. 18(Suppl 1):O70 (2016).
4) Kim et al. Magn. Reson. Med., 61: 1441–1450 (2009).
5) Reddy et al. IEEE TPI, 5:8 (1996).
Figures