2224
3D CEST MRI of human brain at 9.4T reveals vessel correlation of the effect at -1.7 ppm1High-Field Magnetic Resonance, Max Planck Institute for Biological Cybernetics, Tuebingen, Germany
Synopsis
In vivo CEST imaging at 9.4T reveals that the peak at -1.7 ppm which was recently associated with red blood cells is spatially localized to blood vessels. A 3D CEST sequence with high resolution and dense sampling of the Z-spectrum shows that only the -1.7 ppm contrast is vascularly localized.
Purpose
In a recent article the Z-spectrum of blood was investigated at 7T1, and several CEST peaks were attributed to red blood cells, namely the peaks at 3.5ppm, −3.5ppm and −1.7ppm. The purpose of this study was to use highly spectrally-resolved Z-spectrum data acquired at 9.4T to investigate the -1.7ppm peak volumetrically in the human brain. It was observed that while the 3.5ppm and -3.5ppm signals do not show any new correlations, the -1.7ppm effect shows correlation with vessels in the brain, suggesting a red-blood-cell-CEST based vessel-selective MRI method.Methods
Highly-resolved Z-spectra were acquired in three volunteers after obtaining written, informed consent using 3D-snapshot CEST MRI at 9.4T with 95 offsets between -50 and 50 ppm2. The snapCEST imaging experiment consists of spectrally selective saturation using a train of 150 Gaussian-shaped RF pulses, tpulse = 15 ms, tdelay = 15 ms, tsat = 4.5 s, B1,mean = 0.6 µT) and a subsequent readout phase of 2.5 s realized by a single-shot centric-spiral reordered 3D GRE readout (680 k-space lines, FA=5°, TE=1.85ms , TR=3.64, Grappa=3, elliptical scanning, BW=700Hz/px, resolution 1.5x1.5x2 mm3, FOV=22x18x4 cm3, TA=8.5 s per offset). 9.4T-Z-spectra were evaluated by 6 pool multi-Lorentzian fitting in order to determine position, width and amplitude of each CEST-Lorentzian at 0 ppm, +3.5 ppm, −3.5 ppm, 2 ppm and −1.7 ppm. Additionally, intensity projections were calculated for each contrast along the 16 acquired slices.Results
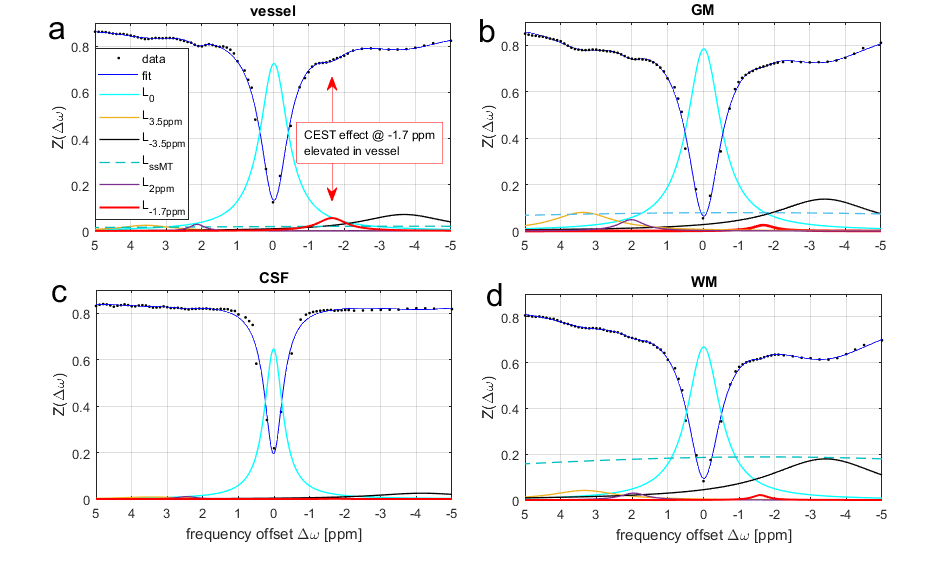
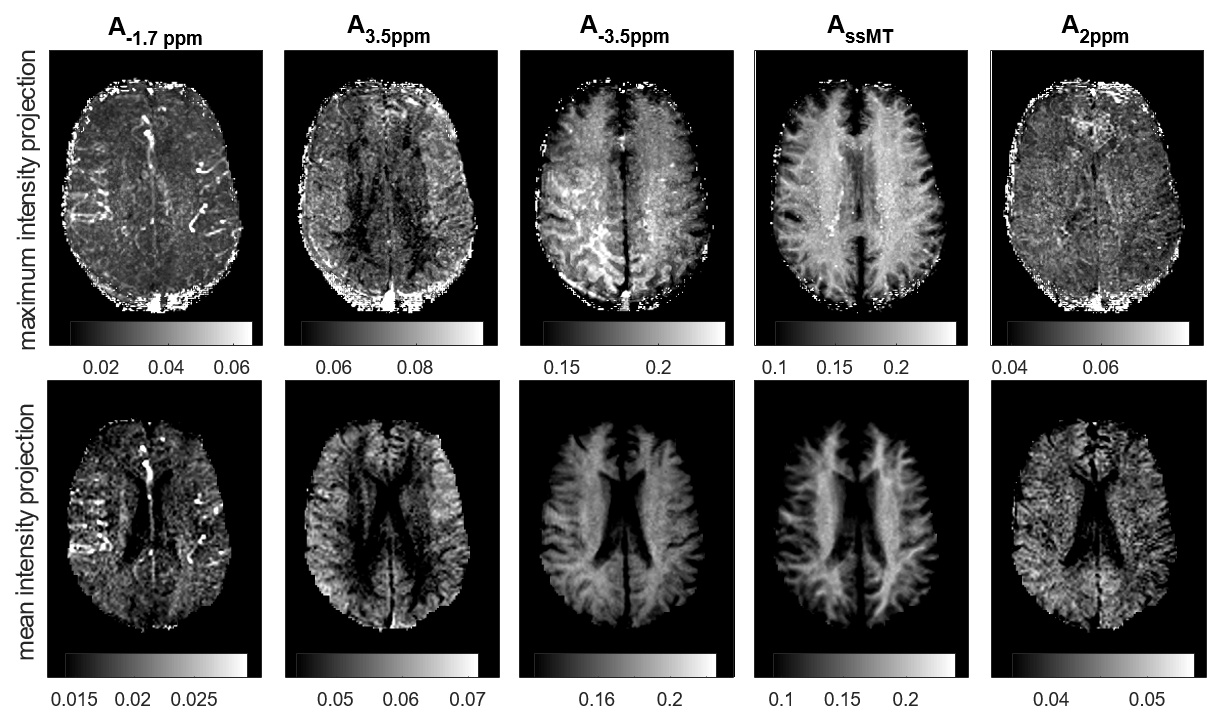
Figure 1 shows single voxel Z-spectra and Lorentzian fit results from different tissues. Vessels show elevated CEST effect at ‑1.7 ppm (~5%) compared to just 2-3 % in grey and white matter. The maximum and mean intensity projection performed on the -1.7 ppm Lorentzian amplitude is depicted in Figure 2a for one representative subject. To check whether the observed vessel contrast is a measurement artifact or a T1-scaling artifact, all other offsets were evaluated the same way. However, in these images no hyperintensities in vessel regions can be seen.Discussion
With 3D-single-shot CEST MRI at 9.4T it was possible to isolate and fit the -1.7 ppm resonance in the Z-spectrum of human brain in vivo. The attribution of the peak at -1.7 ppm to red-blood-cells ex vivo1, and the observed elevated vessel signals, hints that the CEST effect of red-blood cells is also the origin of this effect in vivo. Although in whtie matter and gray matter other proteins might also contribute to the -1.7 ppm resonance, an increased gray matter vs. white matter signal is visible in the mean intensity projection of the ‑1.7 ppm peak amplitude. Thus, as mentioned also by Shah et al., blood cells might also contribute to the CEST contrast at -1.7 ppm in perfused tissue. While this resonance is also apparent in GM and WM, it is especially elevated in blood vessels, which is not the case for the other CEST contrasts. As shown by Zu et al3 this signal also showed a strong drop in ischemic stroke, which again would be in agreement with a red blood cell origin. They also showed that the signal correlates with choline phospholipids, which again could be caused by blood cell membranes.
The current study is ongoing and correlation with time-of-flight as well as susceptibility weighted imaging may help to explore whether the vessel contrast is caused by arterial or venous vessels. The current protocol was part of a whole Z-spectrum protocol, which took 13 minutes per Z-spectrum. However, at 9.4T, the asymmetry at -1.7 ppm can be used to get similar contrast (data not shown); this allows us to drastically shorten scan time due to the reduced number of offsets. Also, the saturation was not yet optimized for this CEST contrast in particular, thus further improvements are possible. While it must be investigated whether the presented contrast yields an actual benefit compared to TOF or ASL techniques, we think it might be especially relevant to detect blood signals that are not in flow, like inner bleeding, stroke or thrombosis.
Conclusion
Study at 9.4T reveals CEST contrast at -1.7 ppm elevated in vessels and perfused tissue in the human brain, originating most probably from red blood cell CEST signals. This contrast might be especially interesting for measurements of stroke or thrombosis, but might also give functional insight into healthy tissue. Contribution of blood-CEST signals must be generally taken into account in in vivo CEST imaging.Acknowledgements
The financial support of the Max Planck Society, German Research Foundation (DFG, grant ZA 814/2-1, support to M.Z.), and European Union’s Horizon 2020 research and innovation programme (Grant Agreement No. 667510, support to M.Z.) is gratefully acknowledged.References
- Shah, S. M. et al. The z-spectrum from human blood at 7T. NeuroImage (2017). doi:10.1016/j.neuroimage.2017.10.053
- Moritz Zaiss, Philipp Ehses & Klaus Scheffler. snapCEST – A single-shot 3D CEST sequence for motion corrected CEST MRI. in Proceeding of 25th annual meeting of ISMRM 2017 #3768
- Zhang, X.-Y. et al. A new NOE-mediated MT signal at around −1.6ppm for detecting ischemic stroke in rat brain. Magn. Reson. Imaging 34, 1100–1106 (2016).
Figures