2223
Rapid and Quantitative Chemical Exchange Saturation Transfer (CEST) Imaging of In Vivo Rat Brain with Magnetic Resonance Fingerprinting (MRF)1Martinos Center for Biomedical Imaging, Deprtment of Radiology, Massachusetts General Hospital and Harvard Medical School, Charlestown, MA, United States, 2Physics Department, Harvard University, Cambridge, MA, United States, 3Department of Biomedical Engineering, Texas A&M University, College Station, TX, United States, 4Department of Radiology, Johns Hopkins University School of Medicine, Baltimore, MD, United States, 5F.M. Kirby Center for Functional Brain Imaging, Kennedy Krieger Institute, Baltimore, MD, United States
Synopsis
CEST MRI suffers from several limitations including long image acquisition times and the qualitative nature of the CEST contrast. Clinical translation of CEST MRI would benefit greatly from the development of quantitative and rapid CEST methods. Here we build on the recently developed Magnetic Resonance Fingerprinting (MRF) technique and report the use of a fast CEST fingerprinting method for generating quantitative exchange rate and exchangeable proton concentration maps of L-Arginine phantoms and in vivo rat brain tissue.
Introduction
Chemical Exchange Saturation Transfer (CEST) MRI (1) uses selective radio-frequency pulses to detect exchangeable protons on a variety of molecules including proteins and has been shown to be a powerful tool for imaging different disease states and pathologies. For example, the amide proton CEST contrast from endogenous proteins has recently been used to distinguish tumor recurrence from radiation necrosis (2) and to detect changes in pH during stroke (3). In addition, a number of diaCEST pH imaging probes are under clinical evaluation for monitoring tumor acidosis (4) and detecting acute kidney injury (5). However, traditional CEST MRI suffers from several limitations including long image acquisition times and the qualitative nature of the CEST contrast, which depends on many factors, including the chemical exchange rate, concentration of exchangeable protons, longitudinal and transverse water relaxation times, and RF saturation power. Analysis of the CEST Z-spectrum is further complicated by the presence of multiple exchangeable proton pools including the aliphatic (Nuclear Overhauser Enhancement, NOE) and semi-solid (magnetization transfer, MT) proton pools. Clinical translation of CEST MRI would benefit greatly from the development of more specific, quantitative and rapid CEST methods. Here we build on the recently developed Magnetic Resonance Fingerprinting (MRF) technique (6) and report the use of a fast CEST fingerprinting method for generating quantitative exchange rate and exchangeable proton concentration maps of both L-Arginine phantoms with different concentrations (25-100 mM) and pH (pH 4-6) and an in vivo rat brain.Methods
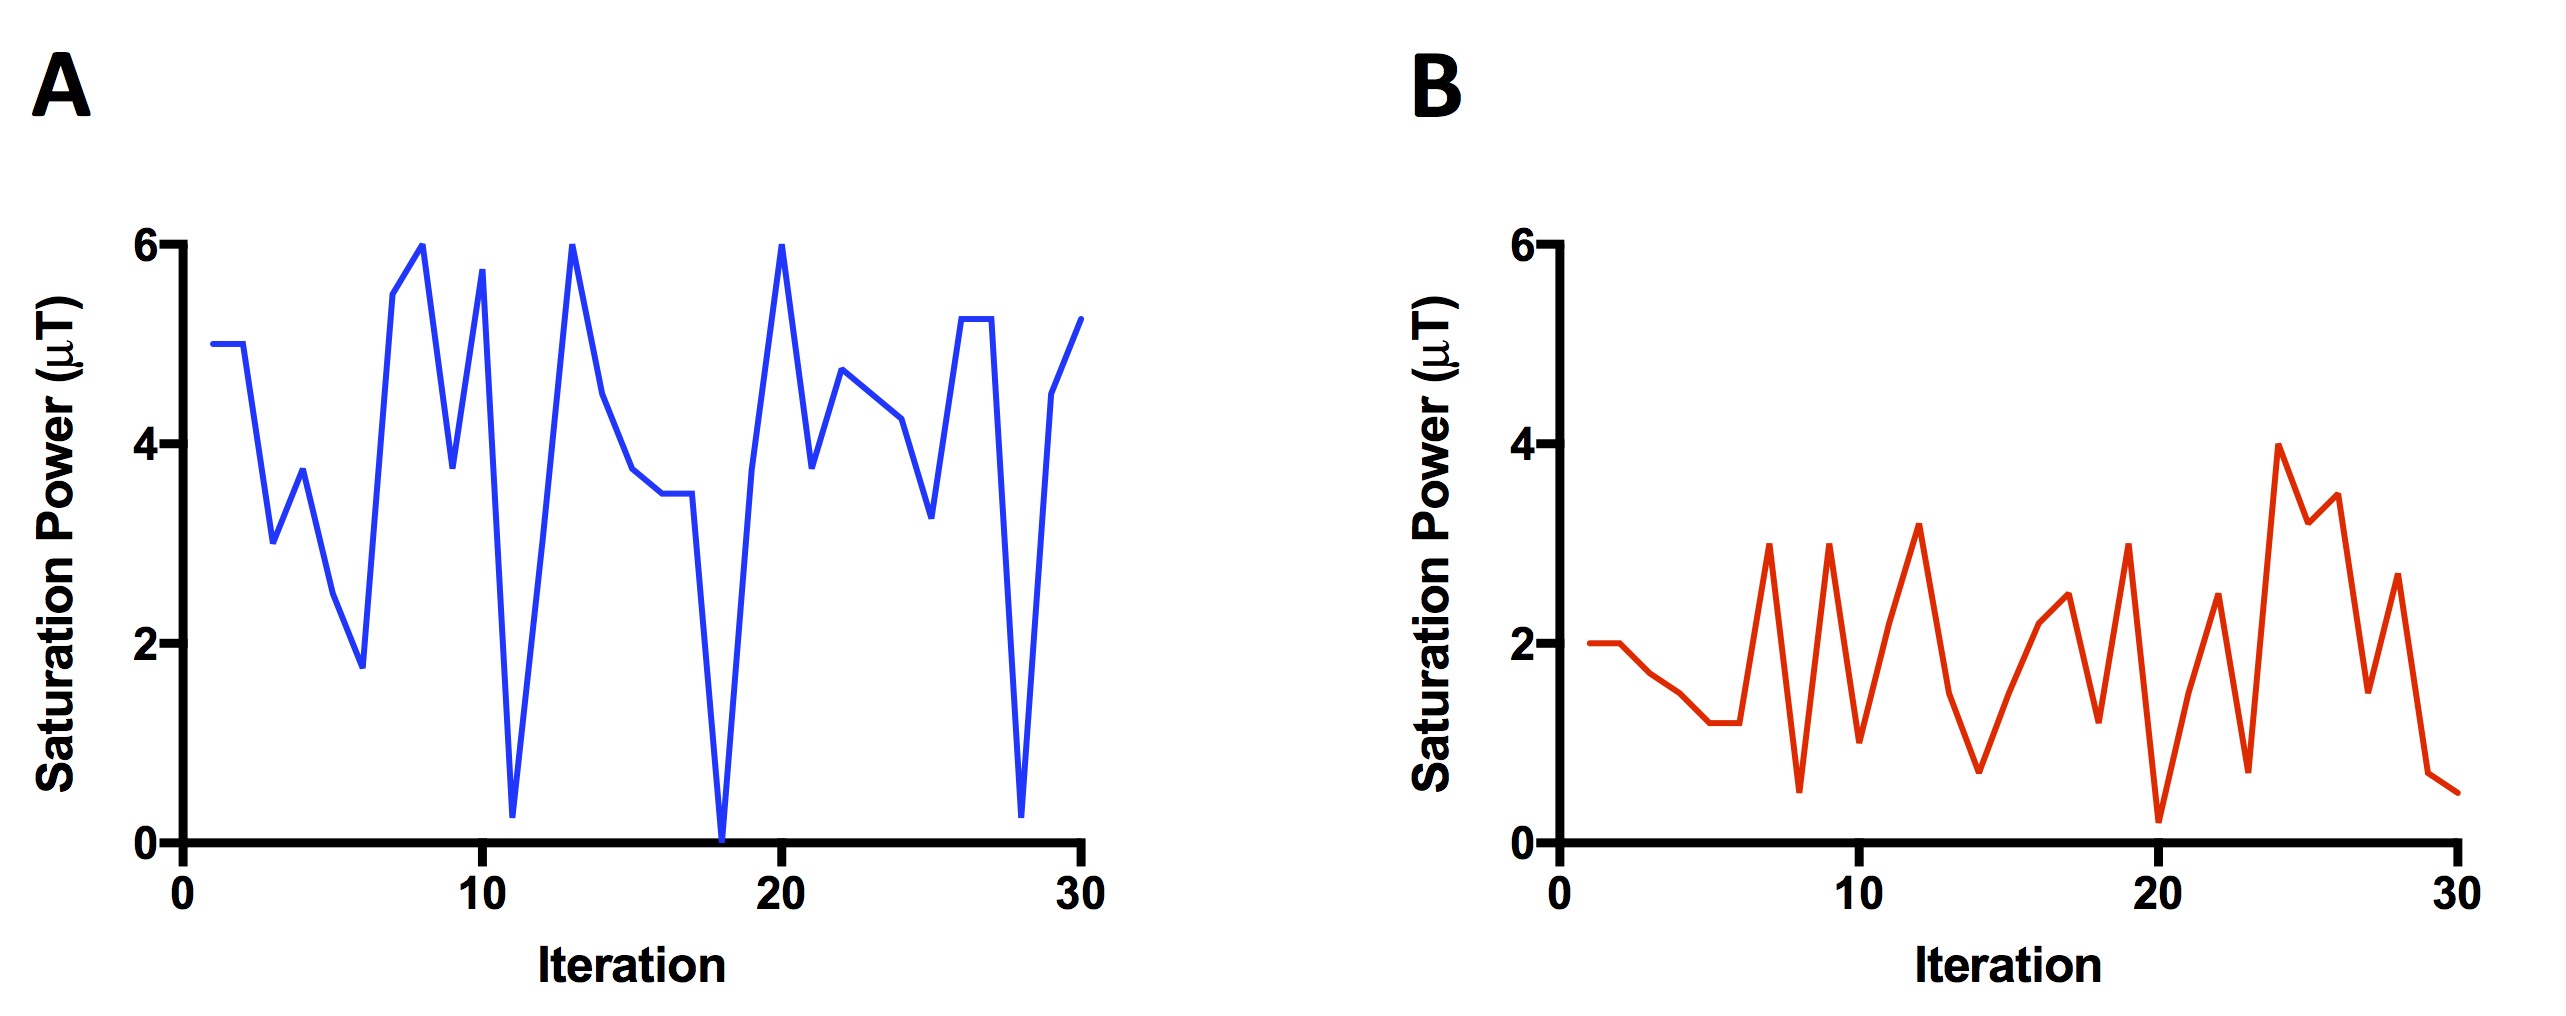
CEST Echo Planar (EPI) images were acquired on a 4.7 T MRI scanner. The CEST-MRF acquisition schedule kept the saturation pulse frequency offset fixed at the amine (L-Arg α-NH3: +3 ppm) or amide (rat brain: +3.5 ppm) exchangeable proton frequency and varied the saturation power for 30 iterations (L-Arg phantom: 0-6 μT; rat brain: 0-3.5 μT) with a total acquisition time of ≤2 minutes (Figure 1). The Bloch equation simulations were modified to include chemical exchange between the water proton pool and both the solute (amide or amine) and semi-solid proton pools. MRF signal trajectories were normalized by the norm of the trajectory and pattern-matched to a large dictionary of signal trajectories simulated using the Bloch-McConnell equations for different combinations of exchange rate, exchangeable proton volume fraction, and water T1 and T2* relaxation times. For the L-Arg phantom, the amine proton exchange rates were independently measured using the QUantitation of Exchange using Saturation Power (QUESP) MRI method (7).Results and Discussion
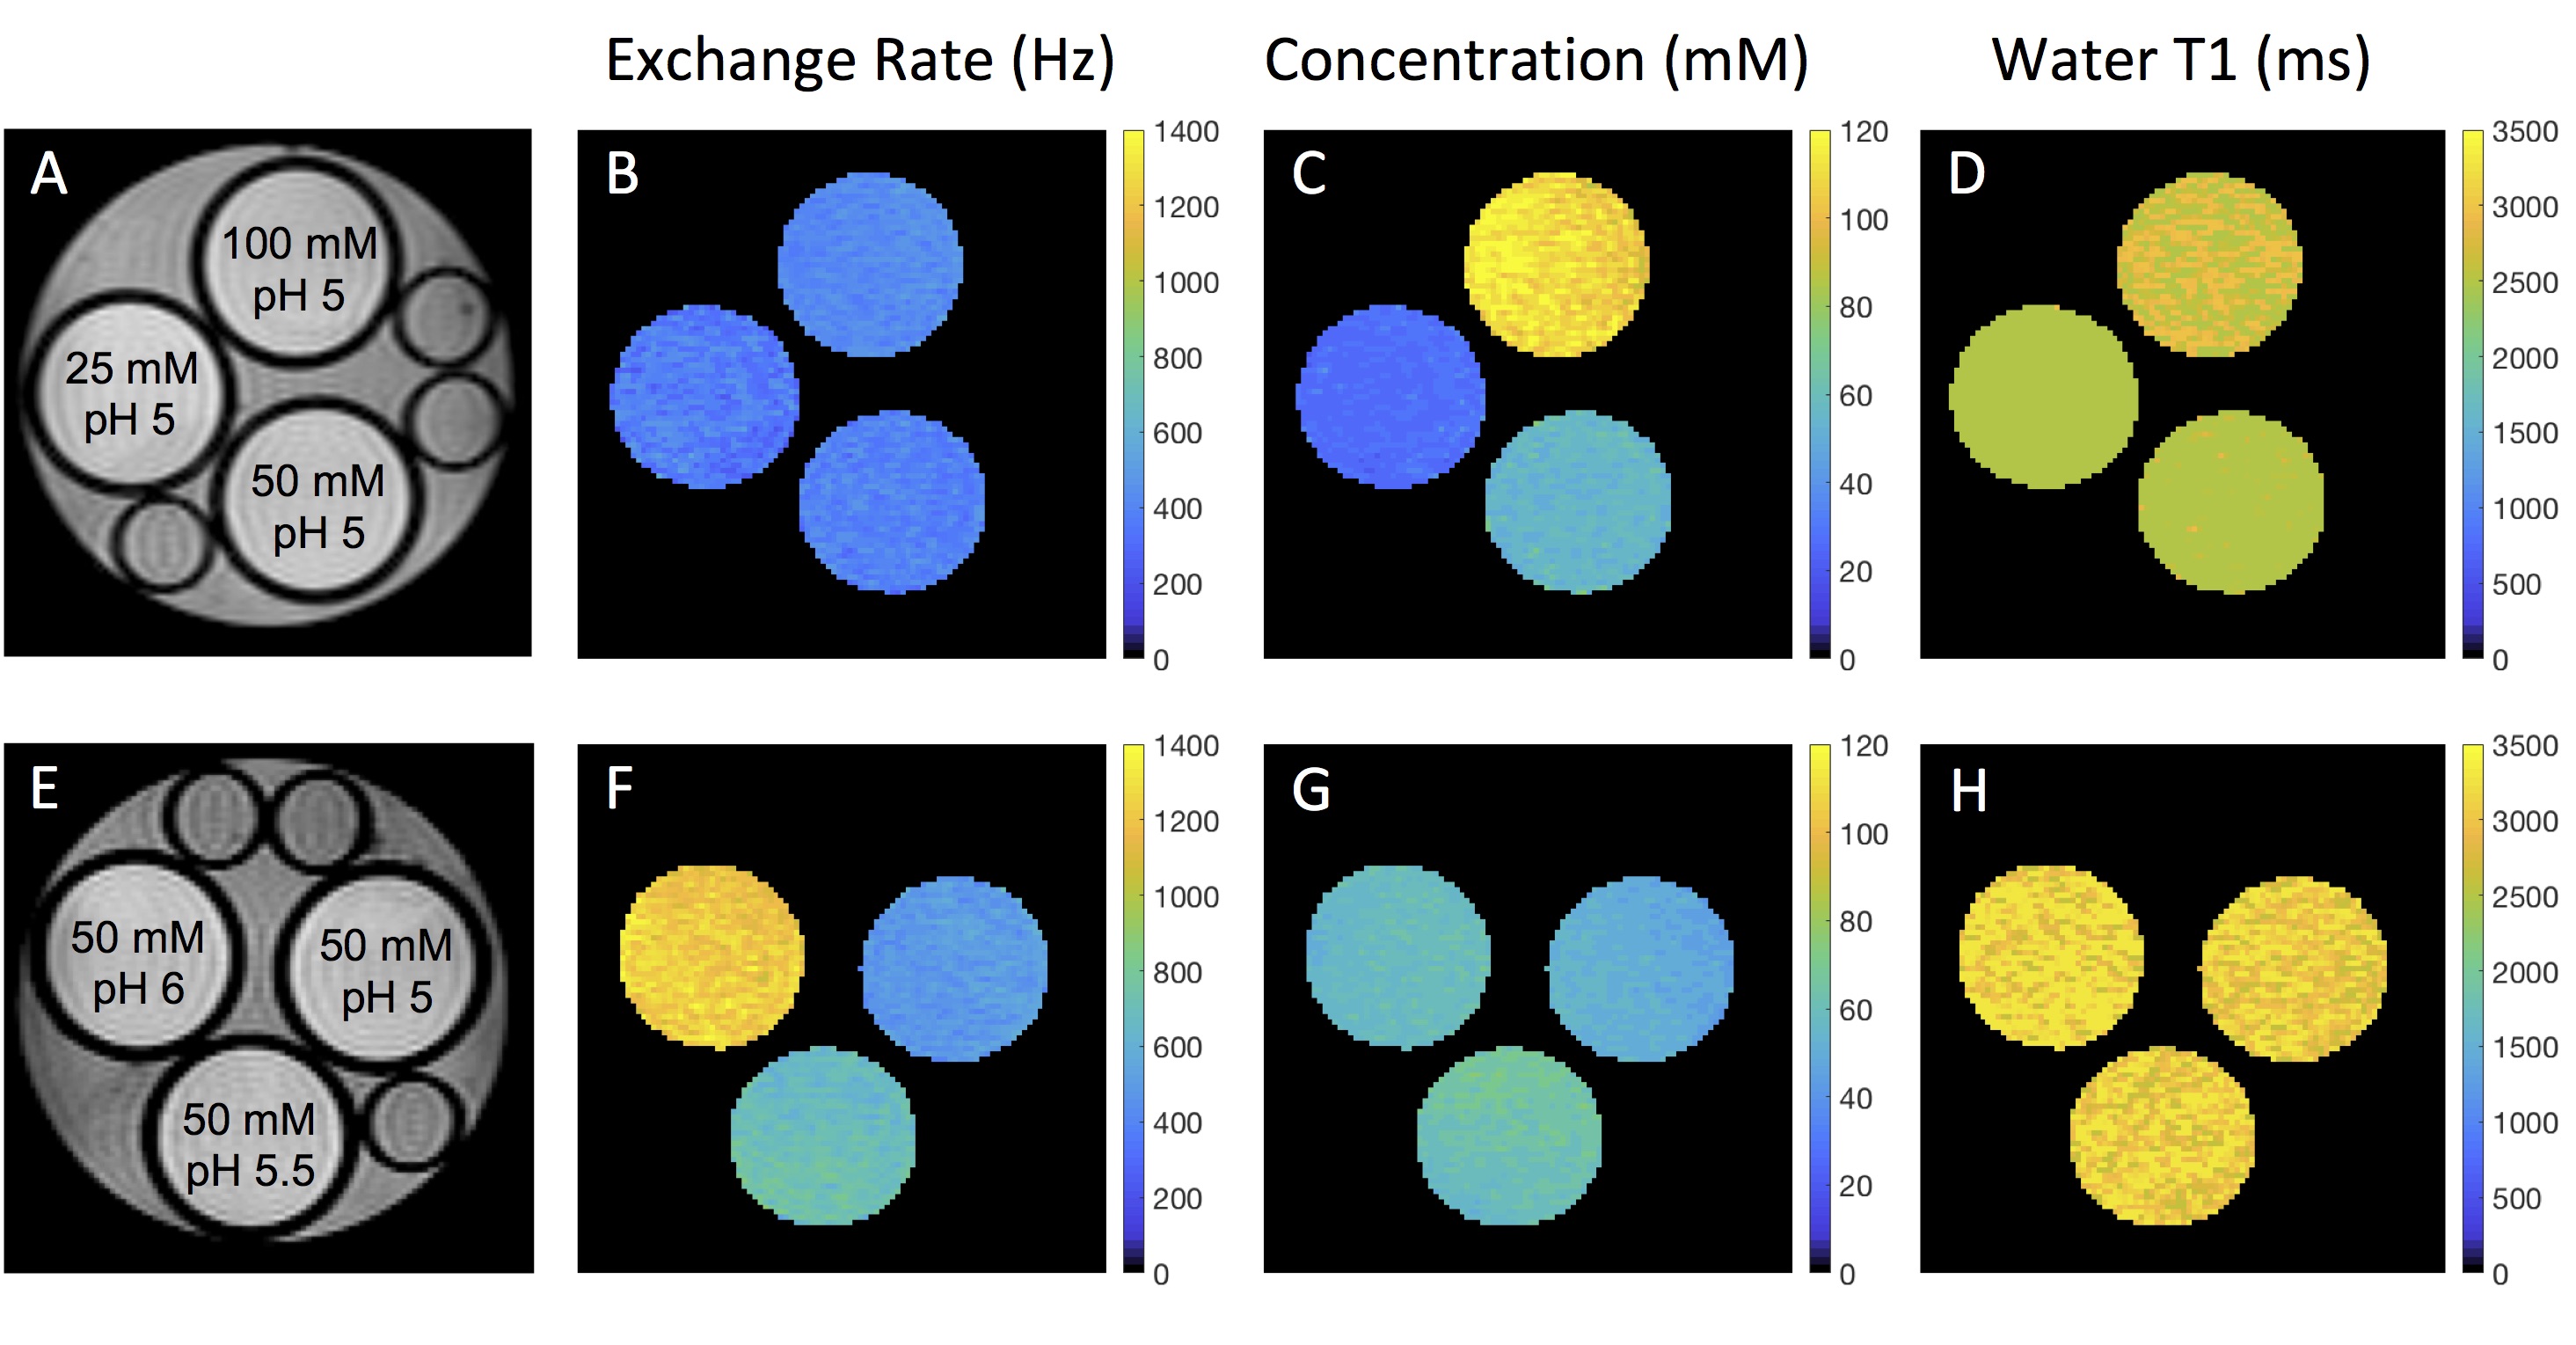
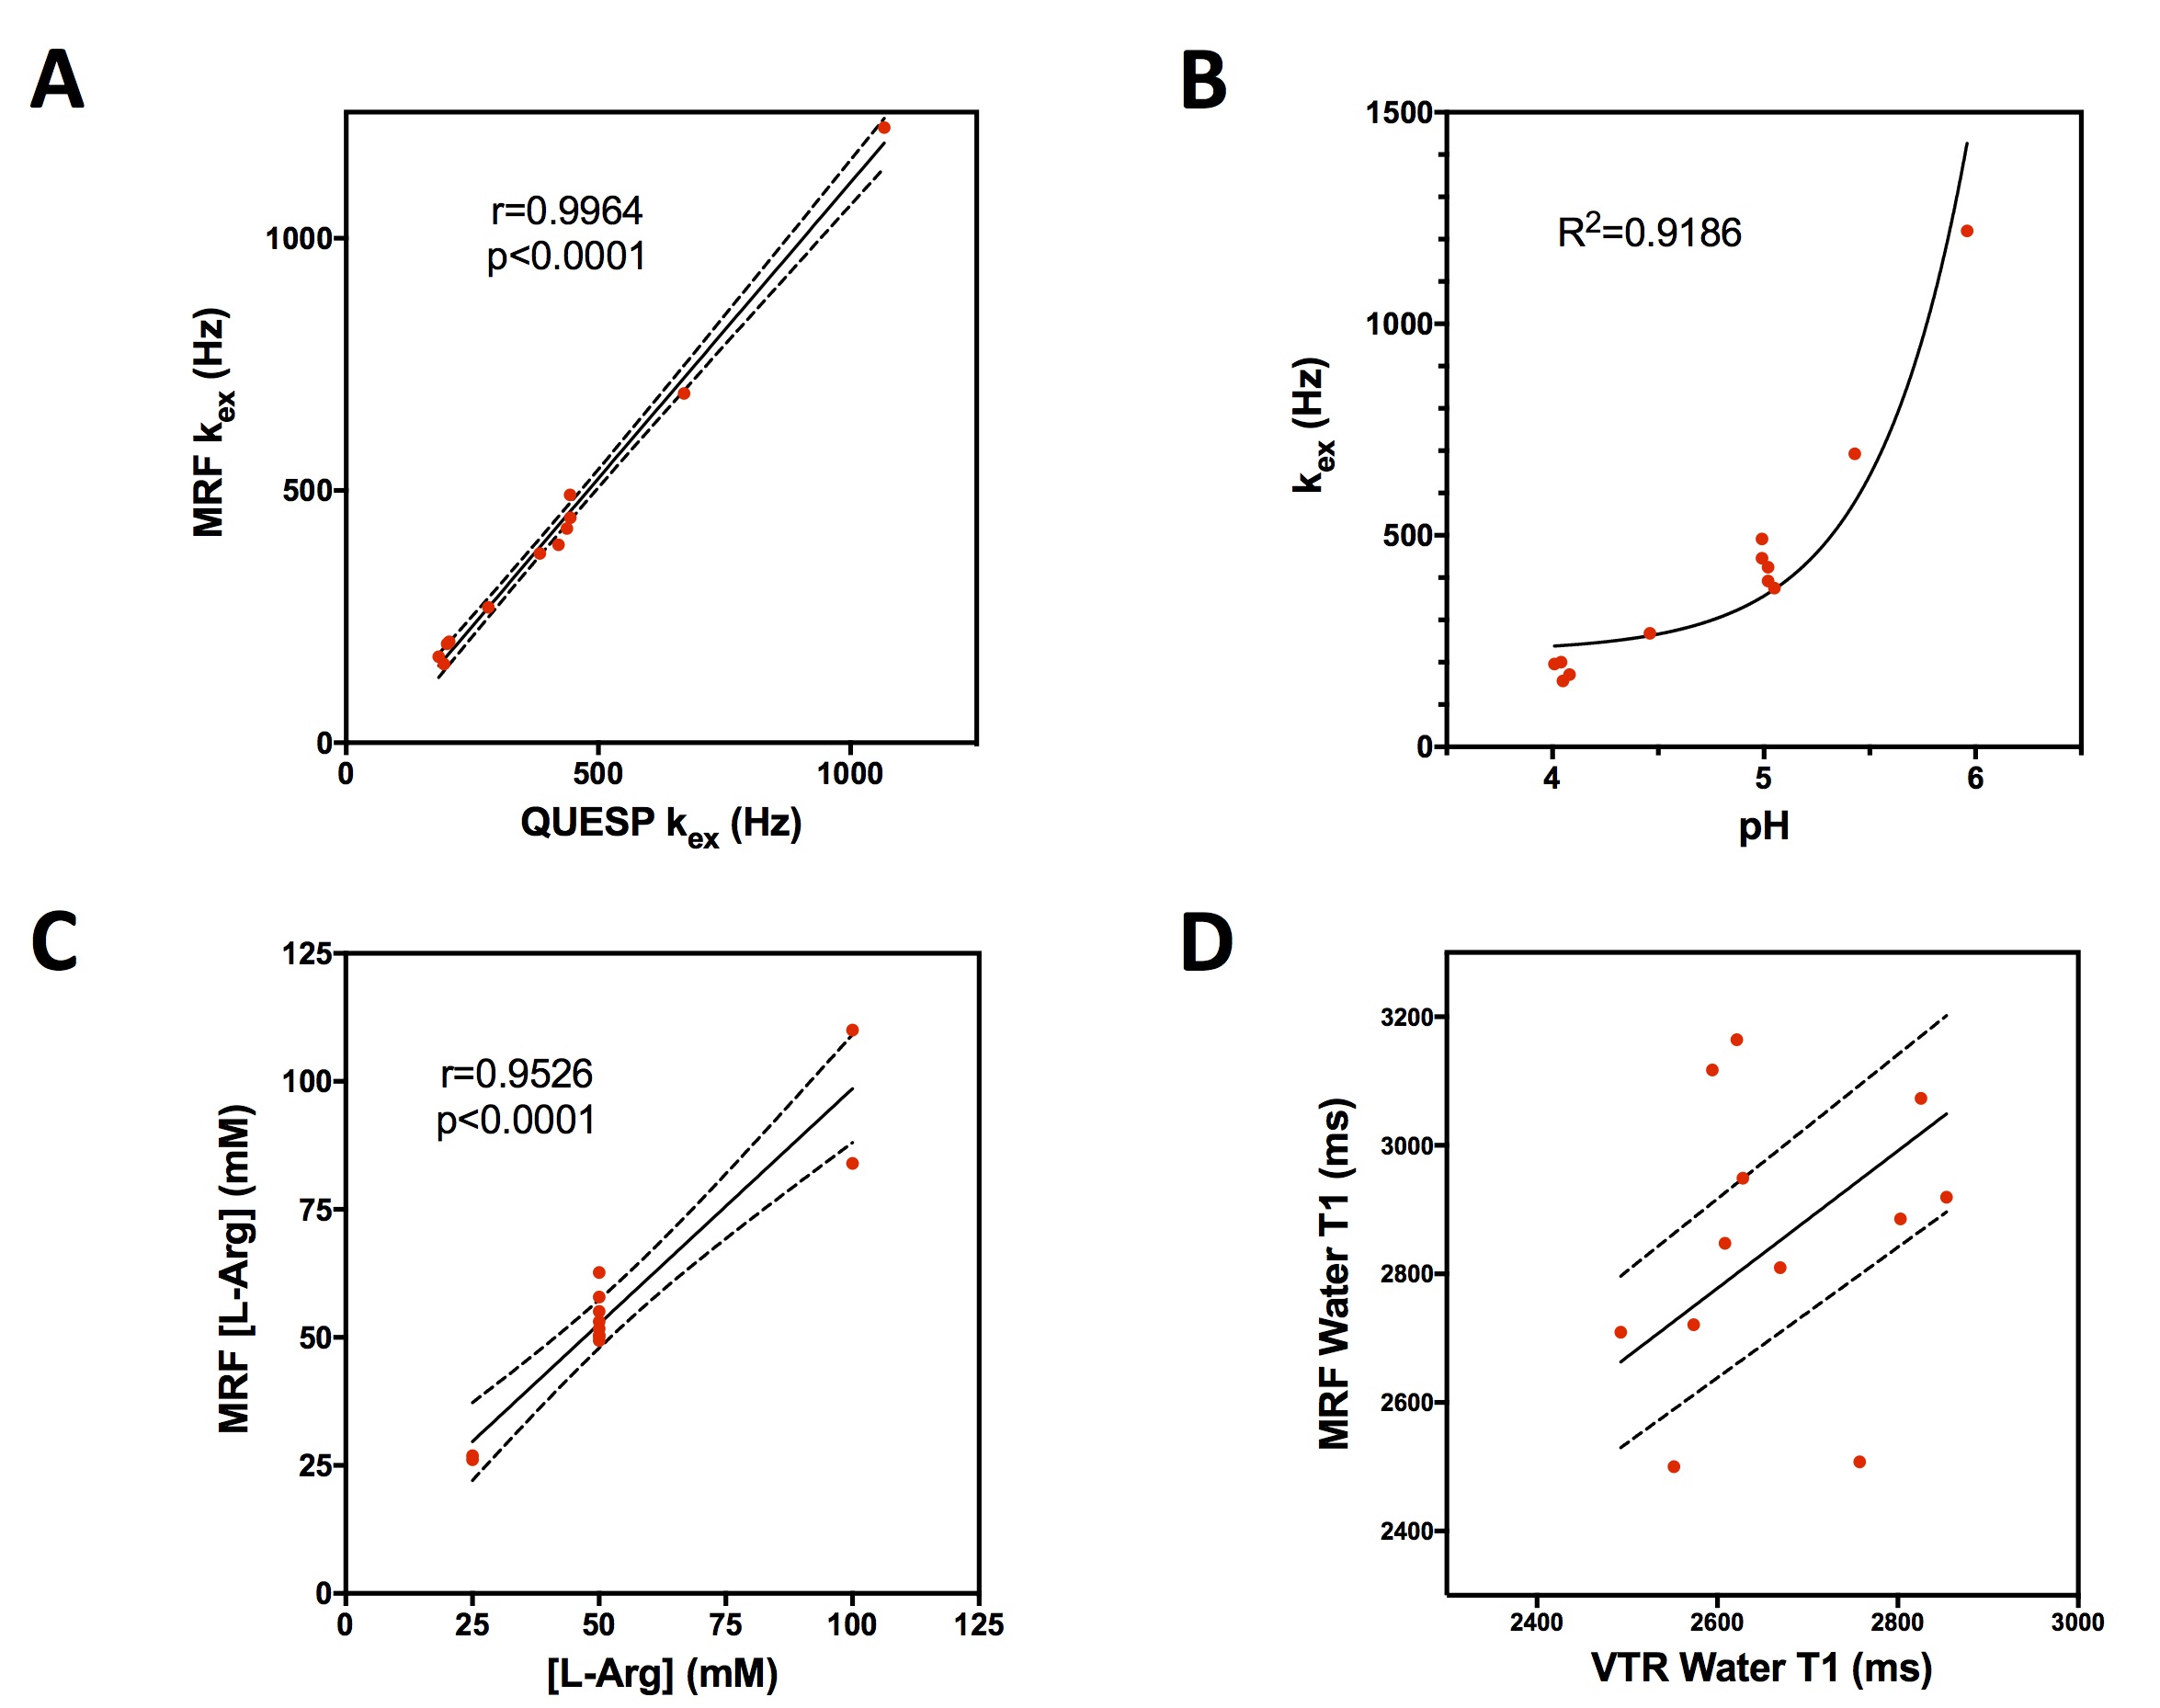
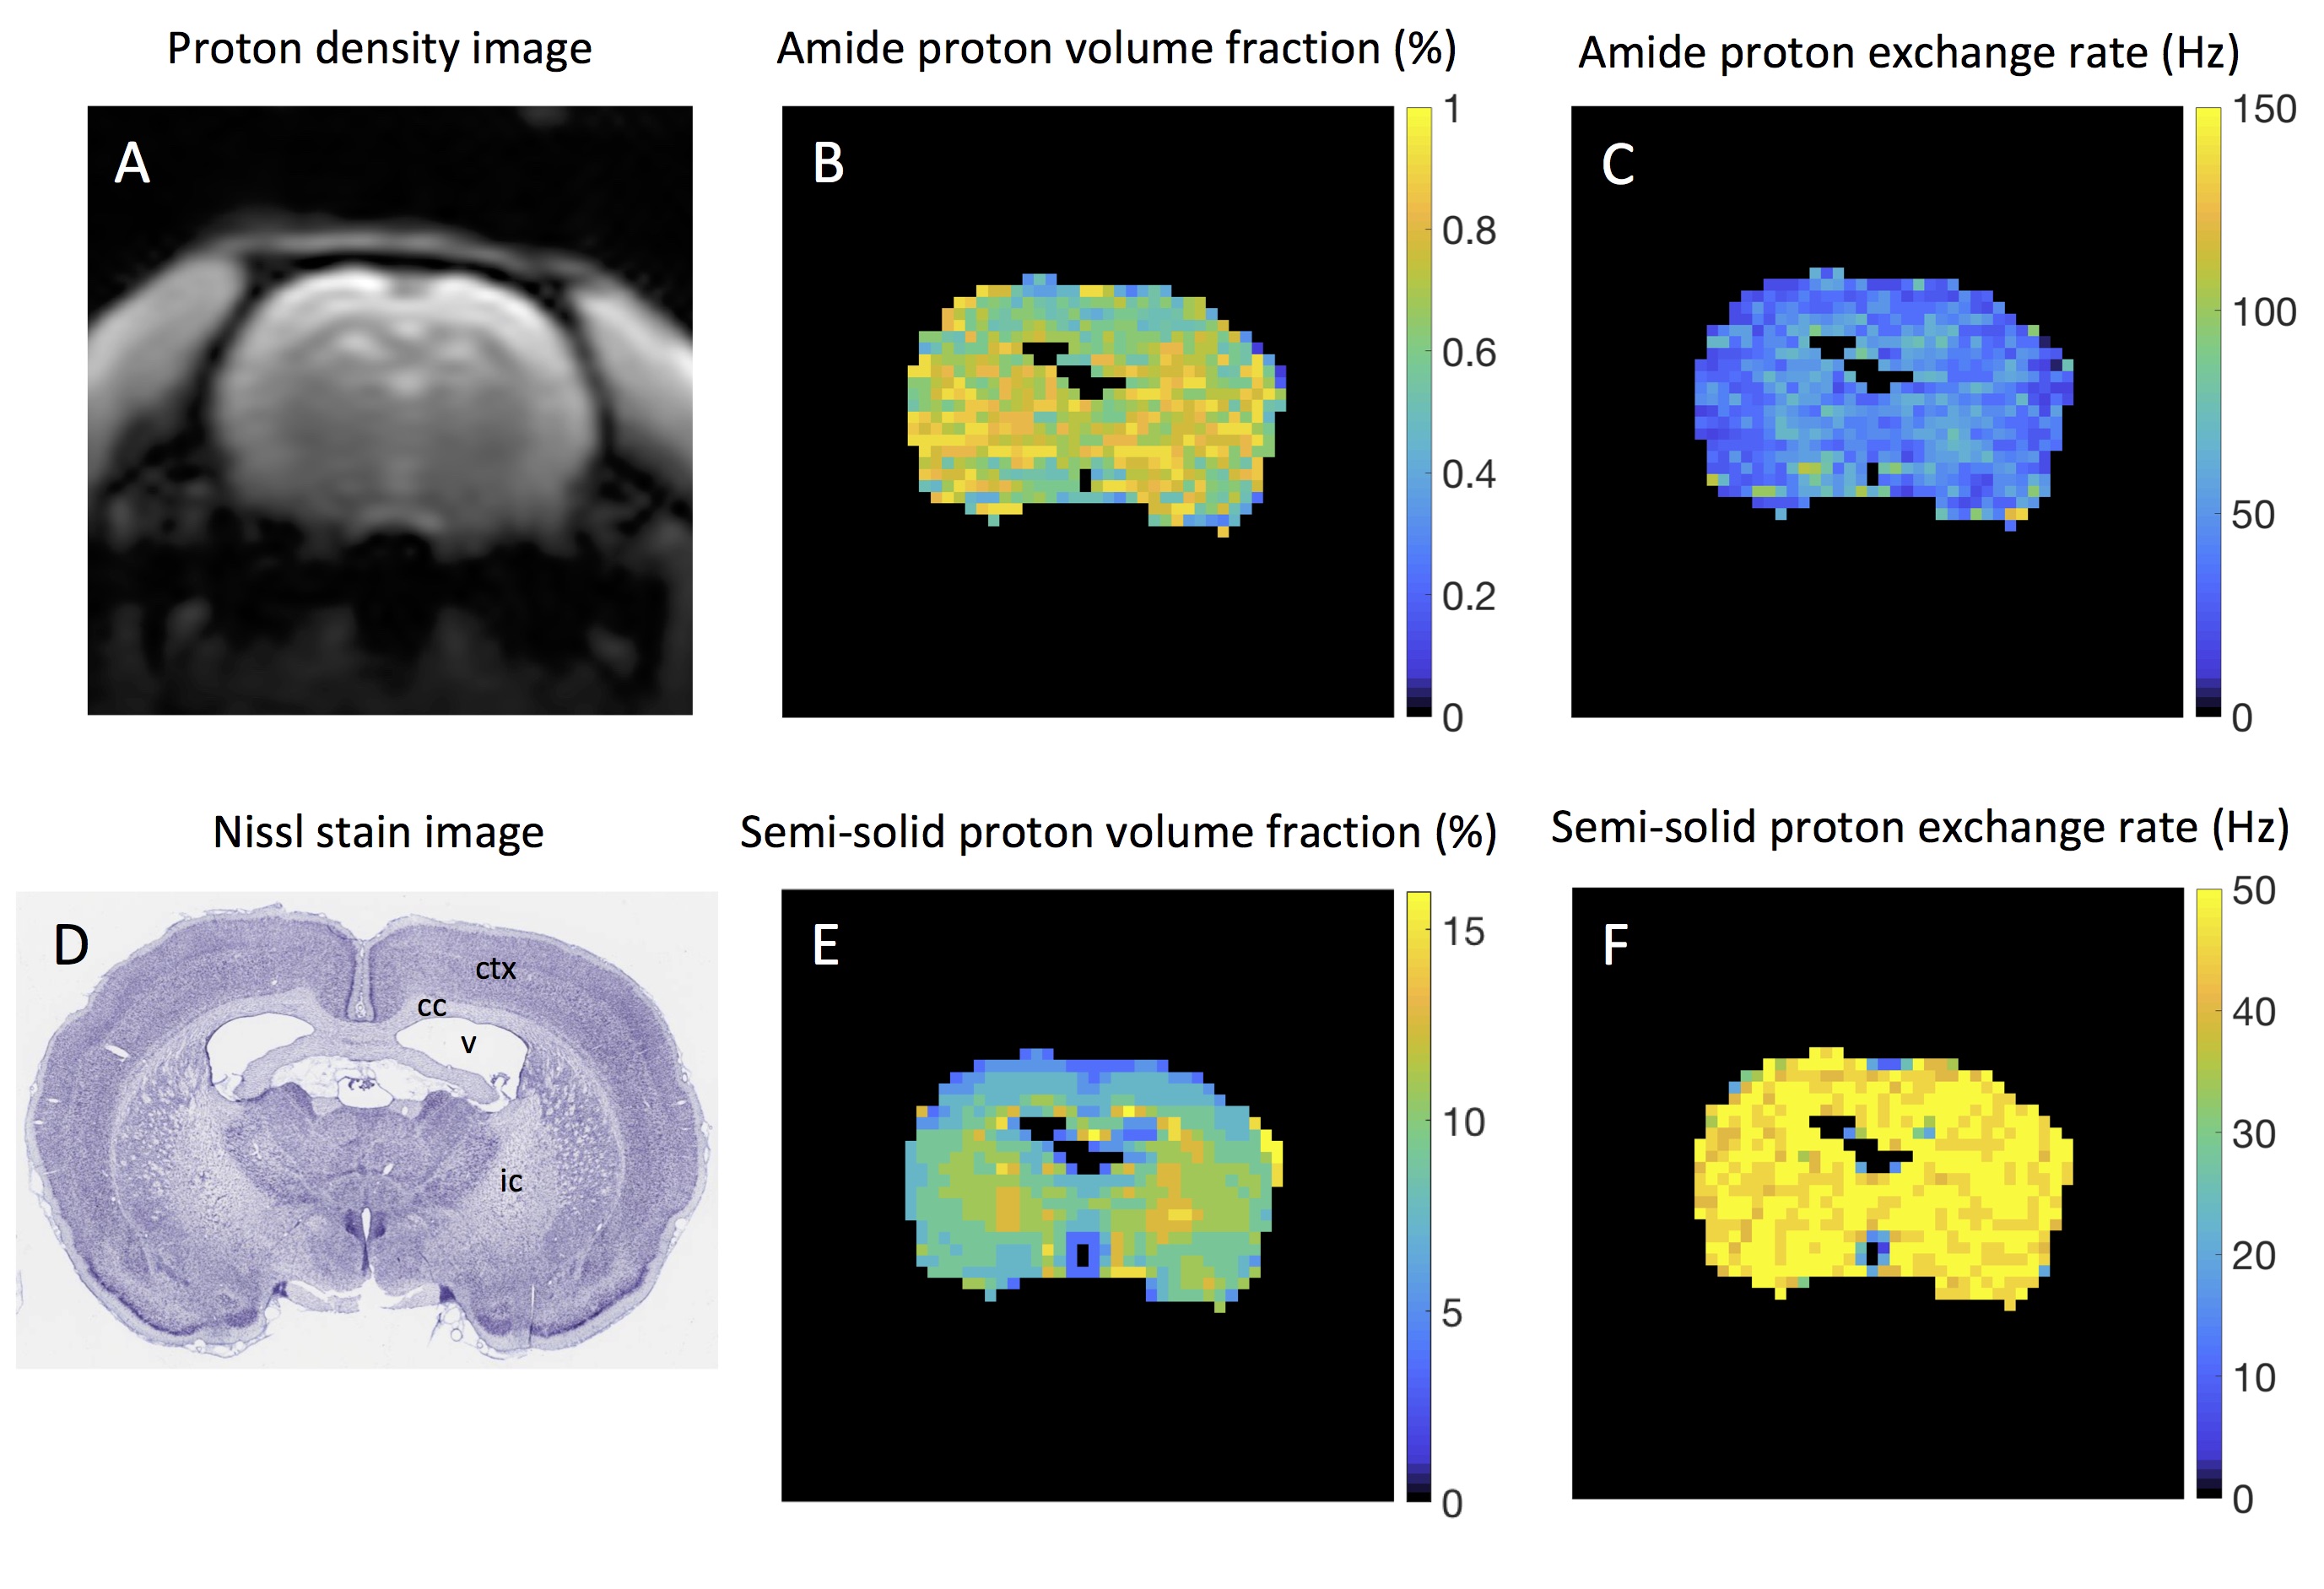
CEST-MRF matched exchange rate, L-Arg concentration and water T1 maps are shown in Figure 2 for representative phantoms with either varying L-Arg concentration (Fig. 2, top row) or varying pH (Fig. 2, bottom row). The chemical exchange rates of the Nα-amine protons of L-Arg were significantly correlated (r=0.9964, p<0.0001) with the rates measured with the QUESP MRI method (Figure 3A). Similarly, the L-Arg concentrations determined using MRF were significantly correlated (r=0.9526, p<0.0001) with the known concentrations (Figure 3C). The pH dependence of the exchange rate was well fit (R2=0.9186) by a base catalyzed exchange model (Figure 3B) (8,9). While the CEST-MRF matched water T1 values were not significantly correlated (r=0.2207, p=0.4906) with the variable TR (VTR) measured T1 values (Figure 3D), the CEST-MRF T1 values were all within ±20% of those measured by the VTR method. The lack of T1 sensitivity is not surprising for the CEST-MRF acquisition schedule used in this study, which only varied the saturation power and used a relatively long, constant repetition time (TR). CEST-MRF matched amide and semi-solid proton chemical exchange rates and exchangeable proton volume fraction maps for the in vivo rat brain along with the associated proton density image and Nissl stained rat brain section from the brainmap.org rat atlas (10) are shown in Figure 4. The amide proton exchange rate measured in rat brain cortex (36.3±12.9 Hz) was in good agreement with that measured previously (11) with the Water Exchange spectroscopy (WEX) method (28.6±7.4 Hz). The semi-solid proton volume fraction was elevated in white (internal capsule and corpus callosum, 11.2±1.7%) compared to gray (cortex, 7.6±1.8%) matter brain regions in agreement with previous magnetization transfer studies. The CEST MRF acquisition schedule used was chosen randomly and recent preliminary efforts at optimization of the acquisition schedule indicate that significant improvements in the discrimination of exchange rate and proton volume fraction should be achievable.Conclusions
CEST-MRF provides a method for fast, quantitative CEST imaging. Further optimization of the CEST-MRF schedule (12) should lead to improved discrimination of exchange rates and concentrations.Acknowledgements
This work was supported by the National Institutes of Health (NIH) grants R01-CA203873 and P41-EB015896.References
1. Ward KM, Balaban RS. Determination of pH using water protons and chemical exchange dependent saturation transfer (CEST). Magn Reson Med 2000;44:799–802.
2. Zhou J, Tryggestad E, Wen Z, et al. Differentiation between glioma and radiation necrosis using molecular magnetic resonance imaging of endogenous proteins and peptides. Nat Med 2011;17:130–134. doi: 10.1038/nm.2268.
3. Zhou J, Payen J-F, Wilson DA, Traystman RJ, van Zijl PCM. Using the amide proton signals of intracellular proteins and peptides to detect pH effects in MRI. Nat Med 2003;9:1085–1090. doi: 10.1038/nm907.
4. Chen LQ, Howison CM, Jeffery JJ, Robey IF, Kuo PH, Pagel MD. Evaluations of extracellular pH within in vivo tumors using acidoCEST MRI. Magn Reson Med 2014;72:1408–1417. doi: 10.1002/mrm.25053.
5. Longo DL, Busato A, Lanzardo S, Antico F, Aime S. Imaging the pH evolution of an acute kidney injury model by means of iopamidol, a MRI-CEST pH-responsive contrast agent. Magn Reson Med 2013;70:859–864. doi: 10.1002/mrm.24513.
6. Ma D, Gulani V, Seiberlich N, Liu K, Sunshine JL, Duerk JL, Griswold MA. Magnetic resonance fingerprinting. Nature 2013;495:187–192. doi: 10.1038/nature11971.
7. McMahon MT, Gilad AA, Zhou J, Sun PZ, Bulte JWM, van Zijl PCM. Quantifying exchange rates in chemical exchange saturation transfer agents using the saturation time and saturation power dependencies of the magnetization transfer effect on the magnetic resonance imaging signal (QUEST and QUESP): pH calibration for poly-L-lysine and a starburst dendrimer. Magn Reson Med 2006;55:836–847. doi: 10.1002/mrm.20818.
8. Barksdale AD, Rosenberg A. Acquistion and interpretation of hydrogen exchange data from peptides, polymers, and proteins. Methods Biochem Anal 1982;28:1–113.
9. Gregory RB, Crabo L, Percy AJ, Rosenberg A. Water catalysis of peptide hydrogen isotope exchange. Biochemistry 1983;22:910–917.
10. Mikula S, Trotts I, Stone JM, Jones EG. Internet-enabled high-resolution brain mapping and virtual microscopy. NeuroImage 2007;35:9–15. doi: 10.1016/j.neuroimage.2006.11.053.
11. van Zijl PCM, Zhou J, Mori N, Payen J-F, Wilson D, Mori S. Mechanism of magnetization transfer during on-resonance water saturation. A new approach to detect mobile proteins, peptides, and lipids. Magn Reson Med 2003;49:440–449. doi: 10.1002/mrm.10398.
12. Cohen O, Rosen MS. Algorithm comparison for schedule optimization in MR fingerprinting. Magn Reson Imaging 2017;41:15–21. doi: 10.1016/j.mri.2017.02.010.
Figures