2222
A novel normalization to correct APT-CEST in the presence of fat1Medical Physics in Radiology, German Cancer Research Center, Heidelberg, Germany
Synopsis
Chemical Exchange Saturation Transfer (CEST) MRI in the human breast is affected by the fat content in the fibro glandular tissue. Although the spectral region of the amide proton transfer (APT) signal does not overlay with fat resonances, the fat signal leads to an incorrect normalization of the Z-spectrum and therefore to misleading CEST effects. We propose a novel method yielding a corrected normalization without the need for application of fat saturation schemes, thus enabling APT-CEST imaging corrected for fat signal contribution. Transfer of the gained insights to realize correct APT-CEST in the human breast at 7T is currently under investigation.
Introduction
Chemical
Exchange Saturation Transfer (CEST) MRI provides biochemical insights and
contrasts of tissue degeneration 1,2. The application in the human breast is
affected by the high fat content in the fibro glandular tissue 3, 4. Not
accounting for the fat signal not only causes strong pseudo rNOE-CEST artifacts5 but also leads to incorrect normalization of the Z-spectrum in the spectral
region of the amide proton transfer (APT) signal. Here, we propose to
approximate the total fat signal by the residual magnetization when the water signal
is saturated (Δω = 0 ppm). This enables correcting the fat signal
contribution and obtaining corrected Z-spectra, thus enabling fat independent
quantitative APT-CEST imaging.Methods
The Z-spectrum for in-phase water and fat signals is defined as5: $$Z=\frac{M_Z}{M_0}=\frac{\alpha W + \beta F}{W+F}\quad\quad\quad\quad\quad\quad[1]$$ F denotes the collective fat signal of all peaks and $$$\alpha,\beta\in[0,1]$$$describe the effects of saturation on the water and fat signal, respectively. The contribution of F in the denominator of Eq. 1 leads to a wrong normalization of the Z-spectrum as CEST-MRI is designed to observe exchange processes solely to water. Selective measurement of the fat fraction can be obtained at Δω = 0 ppm assuming complete water saturation ($$$\alpha=0$$$) and no saturation of the fat signal ($$$\beta=1$$$):$$Z(0 ppm)=\frac{F}{W+F}\quad\quad\quad\quad\quad\quad\quad[2]$$ This information can be used to perform a correct normalization of the Z-spectrum in the spectral region of the APT-signal where no saturation of the fat signal ($$$\beta=1$$$) can be assumed:$$Z_{corr}=\frac{Z-Z(0~ppm)}{1-Z(0~ppm)}=\alpha\quad\quad\quad\quad\quad[3]$$
A buffer solution containing 200 mM carnosine6 (pH = 7.6) with sunflower oil on top was prepared. The imaging plane was set in the interface and slightly tilted creating a fat fraction gradient along the image7 (Fig.$$$~$$$1).
Measurements were performed on a 7 Tesla whole-body MR tomograph (MAGNETOM 7T, Siemens) using a commercial breast coil array (Rapid Biomedical). Pre-saturation was achieved using 460 Gaussian-shaped pulses (15 ms length, duty cycle 60%) with a mean amplitude of B1 = 0.6 µT. Images were acquired using a 2D-GRE sequence and an in-phase echo time of 3.11 ms. B0-inhomogenities were measured with the WASABI method8. The three closest values to 0 ppm were averaged and used as $$$Z(0~ppm)$$$ in Eq. 3.
A single Lorentzian was fitted to the APT signal and the AREX contrast was calculated on both uncorrected and corrected Z-spectra9.
Results
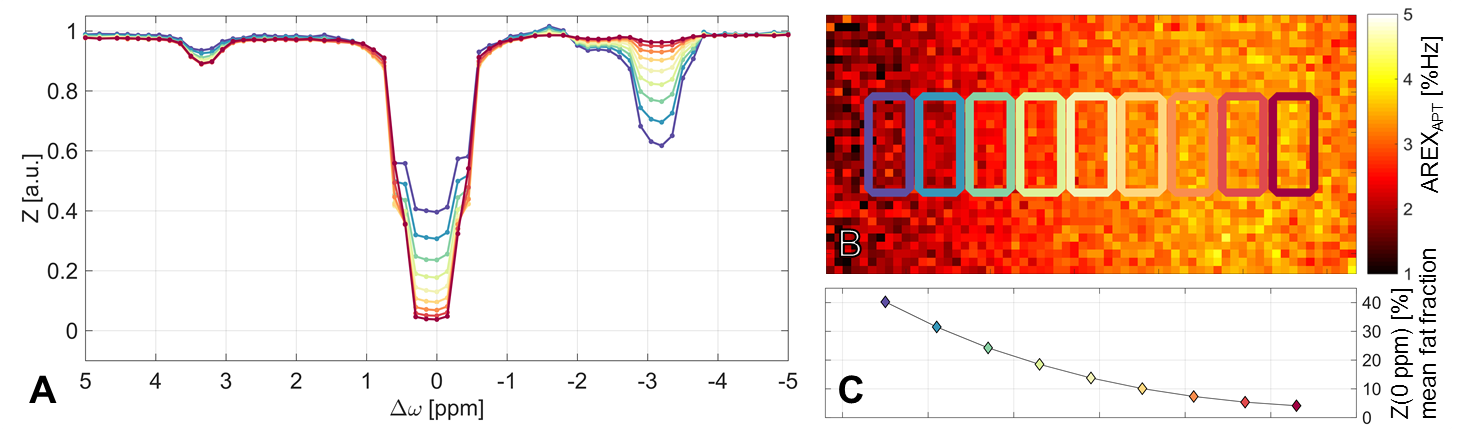
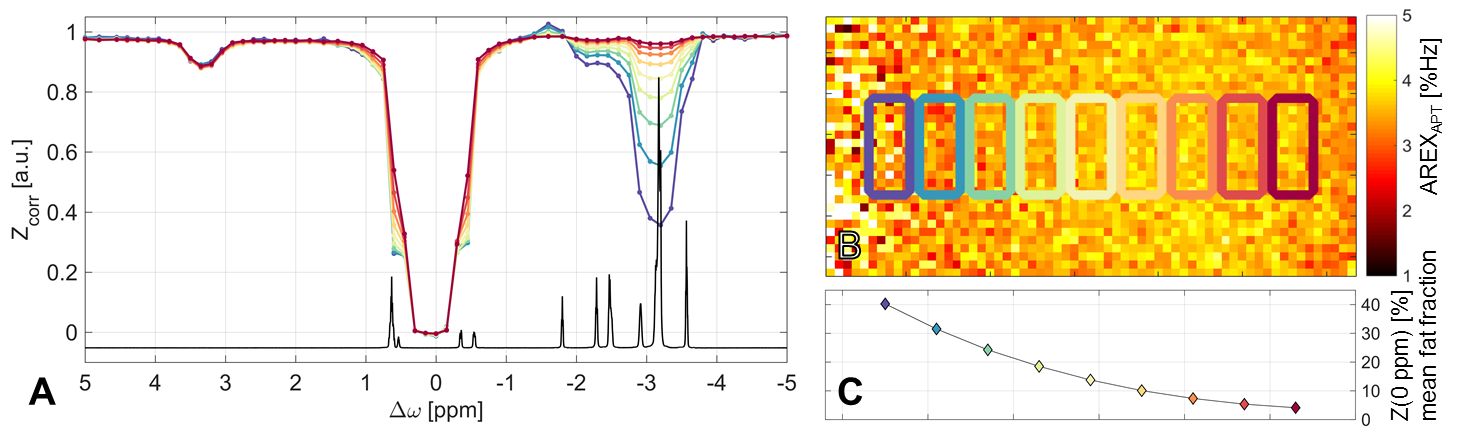
Robust quantification was achieved in the range of 0 – 50 % fat fraction (Eq.2). The APT resonance in conventional Z-spectra shows a strong dependence in the order of magnitude of the fat fraction (Fig. 2A&C). This dependence is also observable in the image of the isolated APT-signal (Fig. 2B). Almost no dependence on the fat signal is seen in the corrected Z-spectra (Fig. 3A). This verifies the functionality of the proposed correction method. Consequently, fat signal independent APT imaging is possible (Fig. 3B). As expected, distortions in Z-spectra are observable at frequency offsets coinciding with fat peaks of the oil (Fig. 3A).Discussion
The proposed fat correction method does not require any additional manipulation of the acquired MR signal (e.g. fat saturation or water excitation). All information required is already obtained in the conventional Z-spectrum. The functionality of the method indicates the validity of the assumptions in Eq. 2 and 3.
With respect to the application in the human breast, the assumption of no fat saturation in the spectral region of the APT signal ($$$\beta=1$$$, Eq. 3) is also valid due to similar spectral positions of fat resonances in the investigated oil10. The assumptions in Eq. 2 ‒ a complete water saturation ($$$\alpha=0$$$) and no saturation of the fat signal ($$$\beta=1$$$) at Δω = 0 ppm ‒ must be investigated in more detail due to the possibility of a direct exchange of magnetization between water and fat.
The expected field inhomogeneities within the human breast should present no obstacle: The analysis of complex MR data allows performing the correction method for arbitrary phase relations of W and F, with Eq. 1-3 being solved in general vector notation (data not shown).
Conclusion
The presented correction method allows APT imaging independent of fat content and is feasible for clinical application, e.g. in the mammary gland. All information required is already obtained in the conventional Z-spectrum without fat saturation. The proposed method could increase the robustness of APT-imaging in tissues with varying fat content.Acknowledgements
No acknowledgement found.References
- Zaiss M, Windschuh J, Paech D, et al. Relaxation-compensated CEST-MRI of the human brain at 7T: Unbiased insight into NOE and amide signal changes in human glioblastoma. NeuroImage, 2015; 112: 180–188.
- Jones CK, Huang A, Xu J, et al. Nuclear Overhauser enhancement (NOE) imaging in the human brain at 7 T. Neuroimage 2013; 77: 114-124.
- Schmitt B., Zamecnik P, Zaiss M, et al. MR Mammography by Means of Chemical Exchange Saturation Transfer ( CEST ) Imaging at 3 Tesla Chemical Exchange Saturation Transfer (CEST). Fortschr Röntgenstr. 2011; 183, 1030–1036.
- Dula AN, Dewey BE, Arlinghaus LR, Williams JM, et al. Optimization of 7-T Chemical Exchange Saturation Transfer Parameters for Validation of Glycosaminoglycan and Amide Proton Transfer of Fibroglandular Breast Tissue. Radiology. 2015; 275(1), 140762.
- Lu J, Zhou J, Cai C, et al. Observation of true and pseudo NOE signals using CEST-MRI and CEST-MRS sequences with and without lipid suppression. MRM. 2015; 73(4):1615–1622.
- Bodet O, Goerke S, Behl NGR, et al. Amide proton transfer of carnosine in aqueous solution studied in vitro by WEX and CEST experiments. NMR in Biomedicine. 2015; 28(9): 1097–1103.
- Zhang S, Keupp J, Wang X. et al. Z-spectrum appearance and interpretation in the presence of fat: Influence of acquisition parameters. Magnetic Resonance in Medicine, 2017; doi:10.1002/mrm.26900
- Schuenke P, Windschuh J, Roeloffs V, et al. Simultaneous mapping of water shift and B1(WASABI)-Application to field-Inhomogeneity correction of CEST MRI data. Magnetic Resonance in Medicine. 2016; 77(2):571-580.
- Zaiss M, Xu J, Goerke S, et al. Inverse Z-spectrum analysis for spillover-, MT-, and T1-corrected steady-state pulsed CEST-MRI – application to pH-weighted MRI of acute stroke. NMR Biomed. 2014; 27: 240–252.
- Dimitrov IE, Douglas D, Ren J, et al. In vivo determination of human breast fat composition by 1H magnetic resonance spectroscopy at 7 T. MRM. 2012; 67(1), 20–26.
Figures
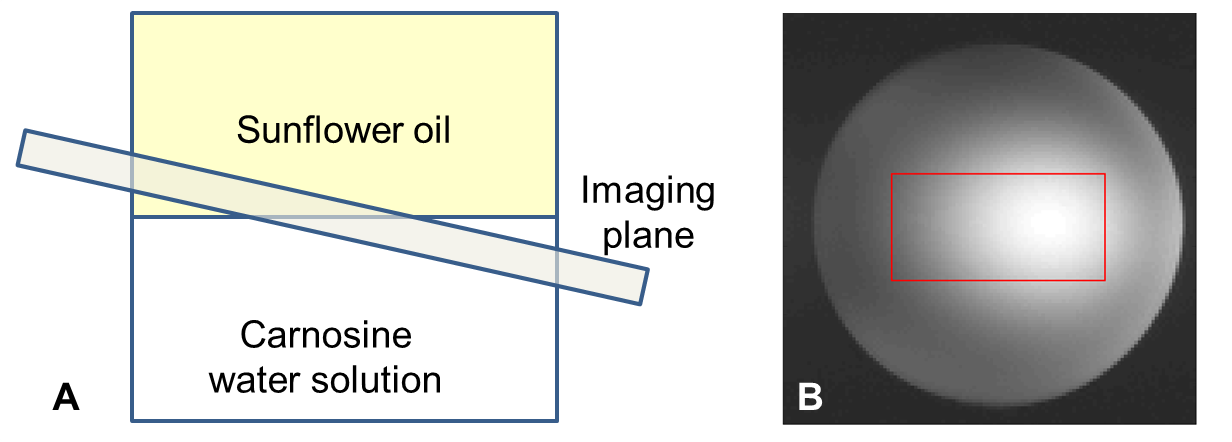
Figure 1: (A) Schematic illustration of the phantom and imaging plane. The red rectangle in the M0 image (B) depicts the area which was used for analysis (Fig. 2 and 3).