2221
Validation of Quantitative Susceptibility Mapping of the Liver at 1.5T and 3.0T using SQUID-Based Liver Susceptometry as the Reference1Medical Physics, University of Wisconsin-Madison, Madison, WI, United States, 2Radiology, University of Wisconsin-Madison, Madison, WI, United States, 3Global MR Applications & Workflow, GE Healthcare, Menlo Park, CA, United States, 4Radiology, Stanford University, Palo Alto, CA, United States, 5Biomedical Engineering, University of Wisconsin-Madison, Madison, WI, United States, 6Medicine, University of Wisconsin-Madison, Madison, WI, United States, 7Emergency Medicine, University of Wisconsin-Madison, Madison, WI, United States
Synopsis
Accurate quantification of liver iron concentration (LIC) is needed for the assessment of iron overload. Quantification of magnetic susceptibility may enable accurate and reproducible estimation of LIC. SQUID-based biomagnetic liver susceptometry (BLS) is used clinically to measure magnetic susceptibility, but has very limited availability. MRI-based Quantitative Susceptibility Mapping (QSM) may enable liver susceptometry with much broader availability. However, the accuracy of QSM-BLS across field strengths remains unknown. In this abstract, we observed strong correlation (r2=0.90) between QSM-BLS (at both 1.5T and 3.0T) with SQUID-BLS in patients with known or suspected iron overload.
Introduction
Accurate quantification of liver iron concentration (LIC) is needed to assess iron overload1. MRI–based R2* mapping is highly correlated with LIC. However, the physical basis of the relationship between R2* and LIC is not well understood and requires empirical calibration2-5.
For this reason, it is highly desirable to perform LIC quantification based on a fundamental property of tissue, such as magnetic susceptibility, which has a well understood relationship to iron concentration6. Magnetic susceptibility can be measured using SQUID-based biomagnetic liver susceptometry (BLS)7. Although SQUID has been validated and is used clinically8, SQUID-BLS devices have very limited availability (only 4 in the world).
MRI-Based Quantitative Susceptibility Mapping (QSM) may enable liver susceptometry with much broader availability. In a previous study, the accuracy of QSM-BLS was assessed at 3.0T using SQUID-BLS as a reference9. However, the reproducibility of QSM-BLS across field strengths remains unknown. Therefore, the purpose of this work is to evaluate the accuracy of QSM-BLS at both 1.5T and 3.0T, in patients with iron overload, using SQUID-BLS as a reference.
Methods
Patient recruitment:
In this ongoing prospective IRB-approved HIPAA compliant study, patients with known or suspected iron overload are recruited after obtaining informed written consent.
QSM and R2* Acquisitions:
Patients were imaged using a clinical 1.5T MRI system (MR450w, GE Healthcare, Waukesha, WI) and using a clinical 3.0T MRI system (MR750, GE Healthcare, Waukesha, WI). Scanning was performed using a phased array torso or cardiac coil.
Multi-echo 3D spoiled gradient-echo (SGRE) data were acquired at both 1.5T and 3.0T for both QSM and R2* mapping. Acquisition parameters included: 8mm slices, flip angle = 5° (1.5T) / 3° (3.0T), 6 echoes, TE1 = 1.2ms, DTE = 2ms (1.5T) / 1ms (3.0T), TR = 14ms (1.5T) / 8ms (3.0T).
SQUID-BLS measurements:
SQUID-based liver susceptometry was performed for each patient within one month of the MRI exam.
Data and Statistical Analysis:
The multi–echo source images were processed using a complex-fitting, fat-corrected algorithm to obtain separate water and fat images, R2* map and B0 field map10. Using the estimated B0 field map, QSM reconstruction was performed using a recently proposed joint algorithm9 to obtain susceptibility maps. All algorithm parameters were the same as reported by Sharma et al9. Both the R2* and QSM reconstructions were implemented in MATLAB (MathWorks, Natick, MA).
For QSM-BLS, a region of interest (ROI) was placed in the right liver lobe, avoiding large blood vessels and bile ducts. Another ROI (see Figure 1) was placed in the adjacent subcutaneous adipose tissue (SAT) to provide a reference for susceptibility in a tissue (SAT) that does not accumulate iron. Subsequently, the relative liver susceptibility was measured as $$$\Delta_{\chi\ QSM}=\chi_{Liver}-\chi_{SAT}$$$. For liver R2*, one ROI (see Figure 1) was placed in the right liver lobe, colocalized with the QSM-BLS map.
Data were subsequently analyzed using linear regression (comparing QSM-BLS versus SQUID-BLS, and QSM-BLS versus R2* at both field strengths) and Bland-Altman analysis (comparing QSM-BLS across field strengths). Data analysis was performed using Python and MATLAB (MathWorks, Natick, MA).
Results
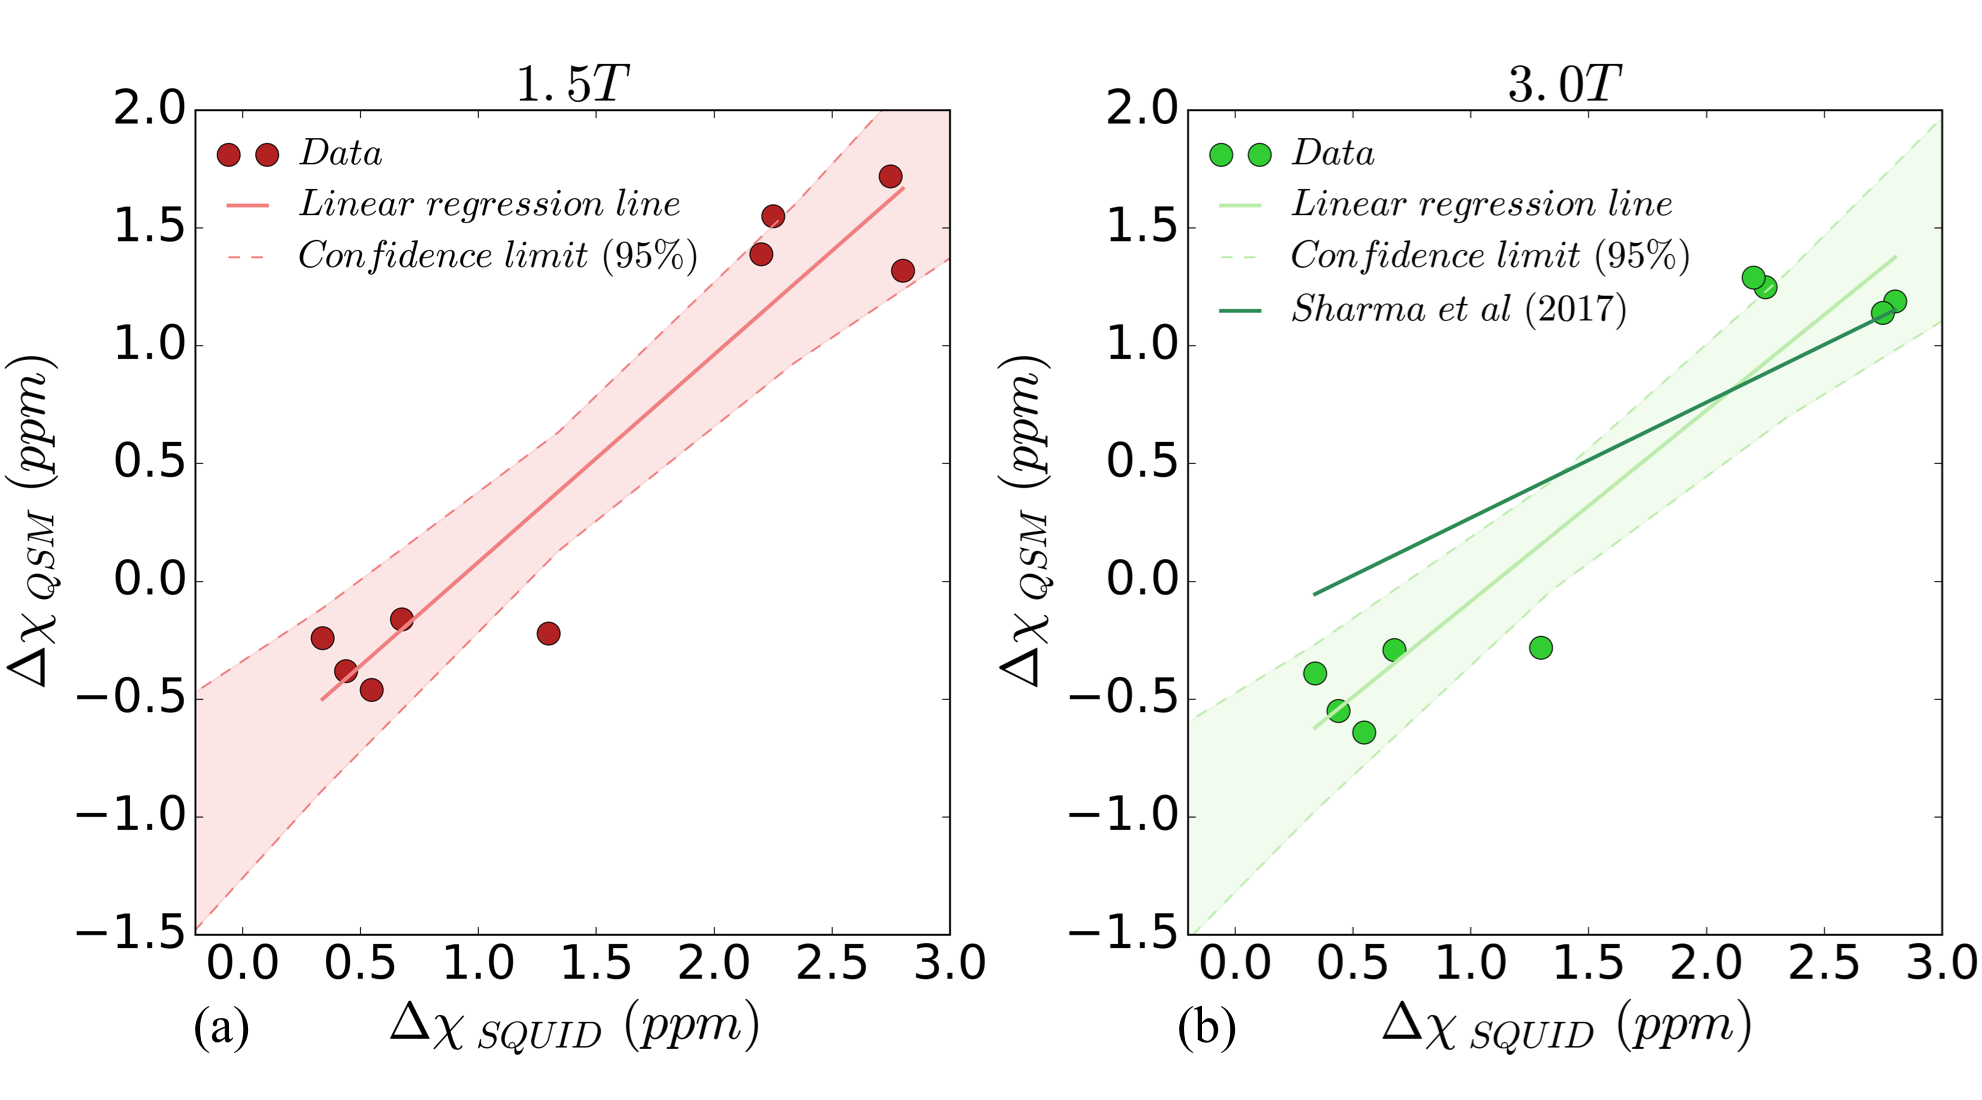
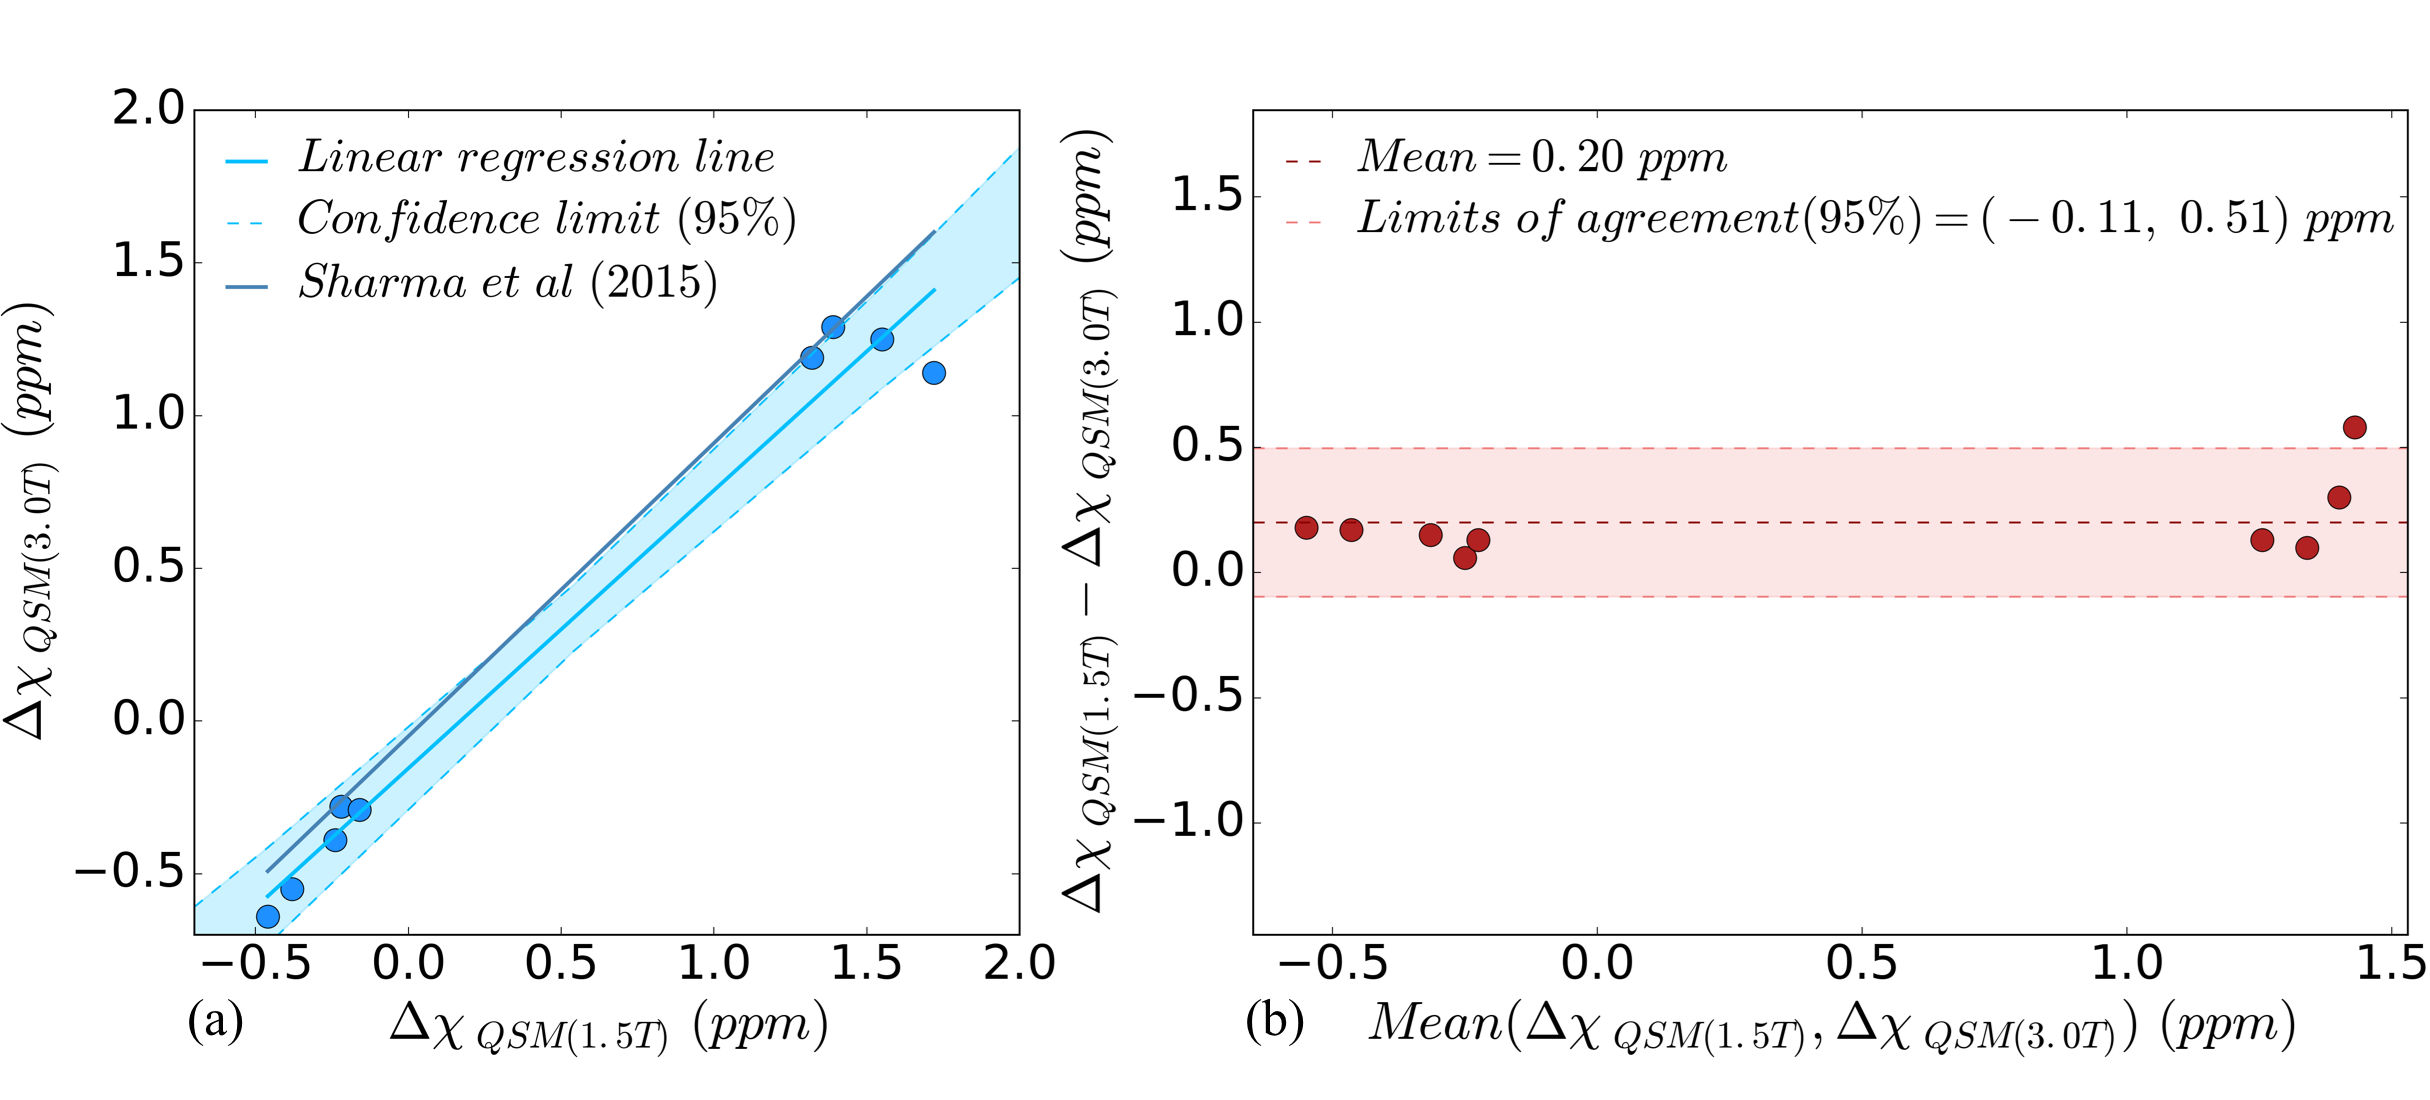
Nine patients (age: 32±22 years, 6M/3F) underwent MRI at both field strengths as well as SQUID-BLS. Figure 1 shows QSM-BLS and liver R2* maps for one subject with normal LIC and another subject with iron overload. As shown in Figure 2, strong correlations were observed between 1.5T QSM-BLS and SQUID-BLS (r2 = 0.90), and between 3.0T QSM-BLS and SQUID-BLS (r2 = 0.90). Further, as shown in Figure 3, strong correlations were observed between QSM-BLS and liver R2* at 1.5T (r2=0.98) as well as at 3.0T (r2=0.97). In addition, strong correlation between susceptibility estimates at 1.5T and 3.0T was also observed (r2=0.96). Bland-Altman analysis comparing QSM-BLS at 1.5T versus 3.0T indicated excellent agreement with 0.20 ppm bias and 95% limits of agreement of (-0.11, 0.51) ppm (Figure 4).Discussion
In this work, we have demonstrated excellent correlation between QSM-BLS (at both 1.5T and 3.0T) with SQUID-BLS in patients with liver iron overload. Furthermore, QSM-BLS shows strong correlation with liver R2* at both field strengths, in agreement with previous work9.
This work has several limitations, including a small number of patients over a relatively moderate range of susceptibility. Further, it is unclear whether the linear relationship observed in this work between 3.0T QSM-BLS and SQUID-BLS is in agreement with a previous study9. On-going studies and further data analysis will be required to characterize and address this potential discrepancy.
In conclusion, liver QSM is a promising technique for the assessment of liver iron overload, based on a fundamental property of tissue - magnetic susceptibility.
Acknowledgements
The authors wish to acknowledge support from the NIH (R01 DK100651, K24 DK102595, 1UL1TR002373). Additionally, the authors acknowledge GE Healthcare who provides research support to the University of Wisconsin and Stanford University.References
1. Wu, H., et al., Noncontrast-enhanced three-dimensional (3D) intracranial MR angiography using pseudocontinuous arterial spin labeling and accelerated 3D radial acquisition. Magn Reson Med, 2013. 69(3): p. 708-15.
2. Anderson, L., et al., Cardiovascular T2-star (T2*) magnetic resonance for the early diagnosis of myocardial iron overload. European heart journal, 2001. 22(23): p. 2171-2179.
3. Christoforidis, A., et al., MRI assessment of liver iron content in thalassamic patients with three different protocols: comparisons and correlations. European journal of haematology, 2009. 82(5): p. 388-392.
4. Hankins, J.S., et al., R2* magnetic resonance imaging of the liver in patients with iron overload. Blood, 2009. 113(20): p. 4853-4855.
5. Wood, J.C., et al., MRI R2 and R2* mapping accurately estimates hepatic iron concentration in transfusion-dependent thalassemia and sickle cell disease patients. Blood, 2005. 106(4): p. 1460-1465.
6. Schenck, J.F., The role of magnetic susceptibility in magnetic resonance imaging: MRI magnetic compatibility of the first and second kinds. Medical physics, 1996. 23(6): p. 815-850.
7. Brittenham, G.M. and D.G. Badman, Noninvasive measurement of iron: report of an NIDDK workshop. Blood, 2003. 101(1): p. 15-19.
8. Brittenham, G.M., et al., Magnetic-susceptibility measurement of human iron stores. New England Journal of Medicine, 1982. 307(27): p. 1671-1675.
9. Sharma, S.D., et al., MRI-based quantitative susceptibility mapping (QSM) and R2* mapping of liver iron overload: Comparison with SQUID-based biomagnetic liver susceptometry. Magn Reson Med, 2017. 78(1): p. 264-270.
10. Hernando, D., J.H. Kramer, and S.B. Reeder, Multipeak fat‐corrected complex R2* relaxometry: Theory, optimization, and clinical validation. Magnetic resonance in medicine, 2013. 70(5): p. 1319-1331.
11. Sharma, S.D., et al., Quantitative susceptibility mapping in the abdomen as an imaging biomarker of hepatic iron overload. Magn Reson Med, 2015. 74(3): p. 673-83.
Figures