2219
Reproducibility of Quantitative Susceptibility Mapping and R2* Mapping of the Human Brain at 7T: a Multi-Centre Pilot Study1Department of Clinical Neurosciences, University of Cambridge, Wolfson Brain Imaging Centre, Cambridge, United Kingdom, 2University of Oxford, Welcome Centre for Integrative Neuroimaging (FMRIB), Oxford, United Kingdom, 3School of Psychology, Cardiff University, Cardiff University Brain Research Imaging Centre, Cardiff, United Kingdom, 4University of Nottingham, Sir Peter Mansfield Imaging Centre, Nottingham, United Kingdom, 5University of Glasgow, Institute of Neuroscience & Psychology, Glasgow, United Kingdom
Synopsis
To perform cost-effective research with high-field imaging by increasing the size of the patient pool in investigations of brain diseases, it is important to guarantee cross-site reproducibility and consistency of the QSM and R2* results. This study is part of a pilot “travelling-heads” experiment from the UK7T network, in which we aim to develop harmonized approaches for T2*-weighted imaging in order to provide a framework for future multi-centre clinical studies at 7T.
Introduction
T2*-weighted MRI can provide quantitative anatomical tissue contrast from either the magnitude images by computing the effective transverse relaxation rate (R2*), or from the phase data, by calculating quantitative susceptibility maps (QSM)1. Although the QSM and R2* contrast increases with field strength, B0 shimming conditions become more variable, compromising the effectiveness of background gradient removal and, hence, the quantification of susceptibility.
To perform cost-effective research with high-field imaging by increasing the size of the patient pool in investigations of brain diseases, it is important to guarantee cross-site reproducibility and consistency of the QSM and R2* results. This study is part of a pilot “travelling-heads” experiment, aimed at developing harmonized approaches for T2*-weighted imaging in order to provide a framework for future multi-centre clinical studies at 7T.
Acquisition
Three healthy volunteers (male, (31±4)y.o) were scanned once in each of the four 7T MRI scanners (Site-A and Site-B: Siemens-Magnetom; Site-C: Philips-Achieva; Site-D: Siemens-Terra). Single-echo, 0.7mm isotropic T2*-weighted images were acquired for QSM (TE/TR=20/31ms; FA=15º; BW=70Hz/px; in-plane acceleration-factor=4; FOV=224x224x157mm3; scan-time=~9min). Multi-echo 1.4mm isotropic T2*-weighted scans were acquired and used for R2* and QSM estimation (TE1/TR=4/43ms; 8 echoes, monopolar gradient; echo-spacing=5ms; FA=15º; BW=260Hz/px; acceleration-factor=4 (Sites-A/B/D) and 2x1.5 (Site-C); FOV=269x218x157mm3; scan-time=~5.58min (Sites-A/B/D) and ~4.28min (Site-C)). For data acquired at sites A/B/D a reconstruction using Roemer’s coil combination method was implemented for both sequences2. A 0.7mm isotropic MP2RAGE scan was used for registrations.Analysis
The STI Suite software package was used for QSM estimation. Each single-echo T2* phase dataset was first masked and then unwrapped. This was followed by background phase removal with V-SHARP using default settings3. QSM maps were estimated with the LSQR method4. Voxel-wise quantitative maps of R2* were obtained by fitting the magnitude signal decay in the 3D multi-echo T2*-weighted scans. The multi-echo dataset was also used to estimate QSM maps using the same methods as in single-echo scans.
All maps were registered (rigid-body model; 6-DOF) to the MP2RAGE of each subject at each site using FSL’s FLIRT5. Five volumes-of-interest (VOIs) were manually drawn on the registered susceptibility maps (red nucleus, substantia nigra, putamen, caudate nucleus, globus pallidus) with ITK-Snap (http://www.itksnap.org). For QSM reference, a CSF mask was obtained from the MP2RAGE images and masked such that no surface CSF was included ($$$\Delta\chi=\bar{\chi}_{VOI}-\bar{\chi}_{CSF}$$$).
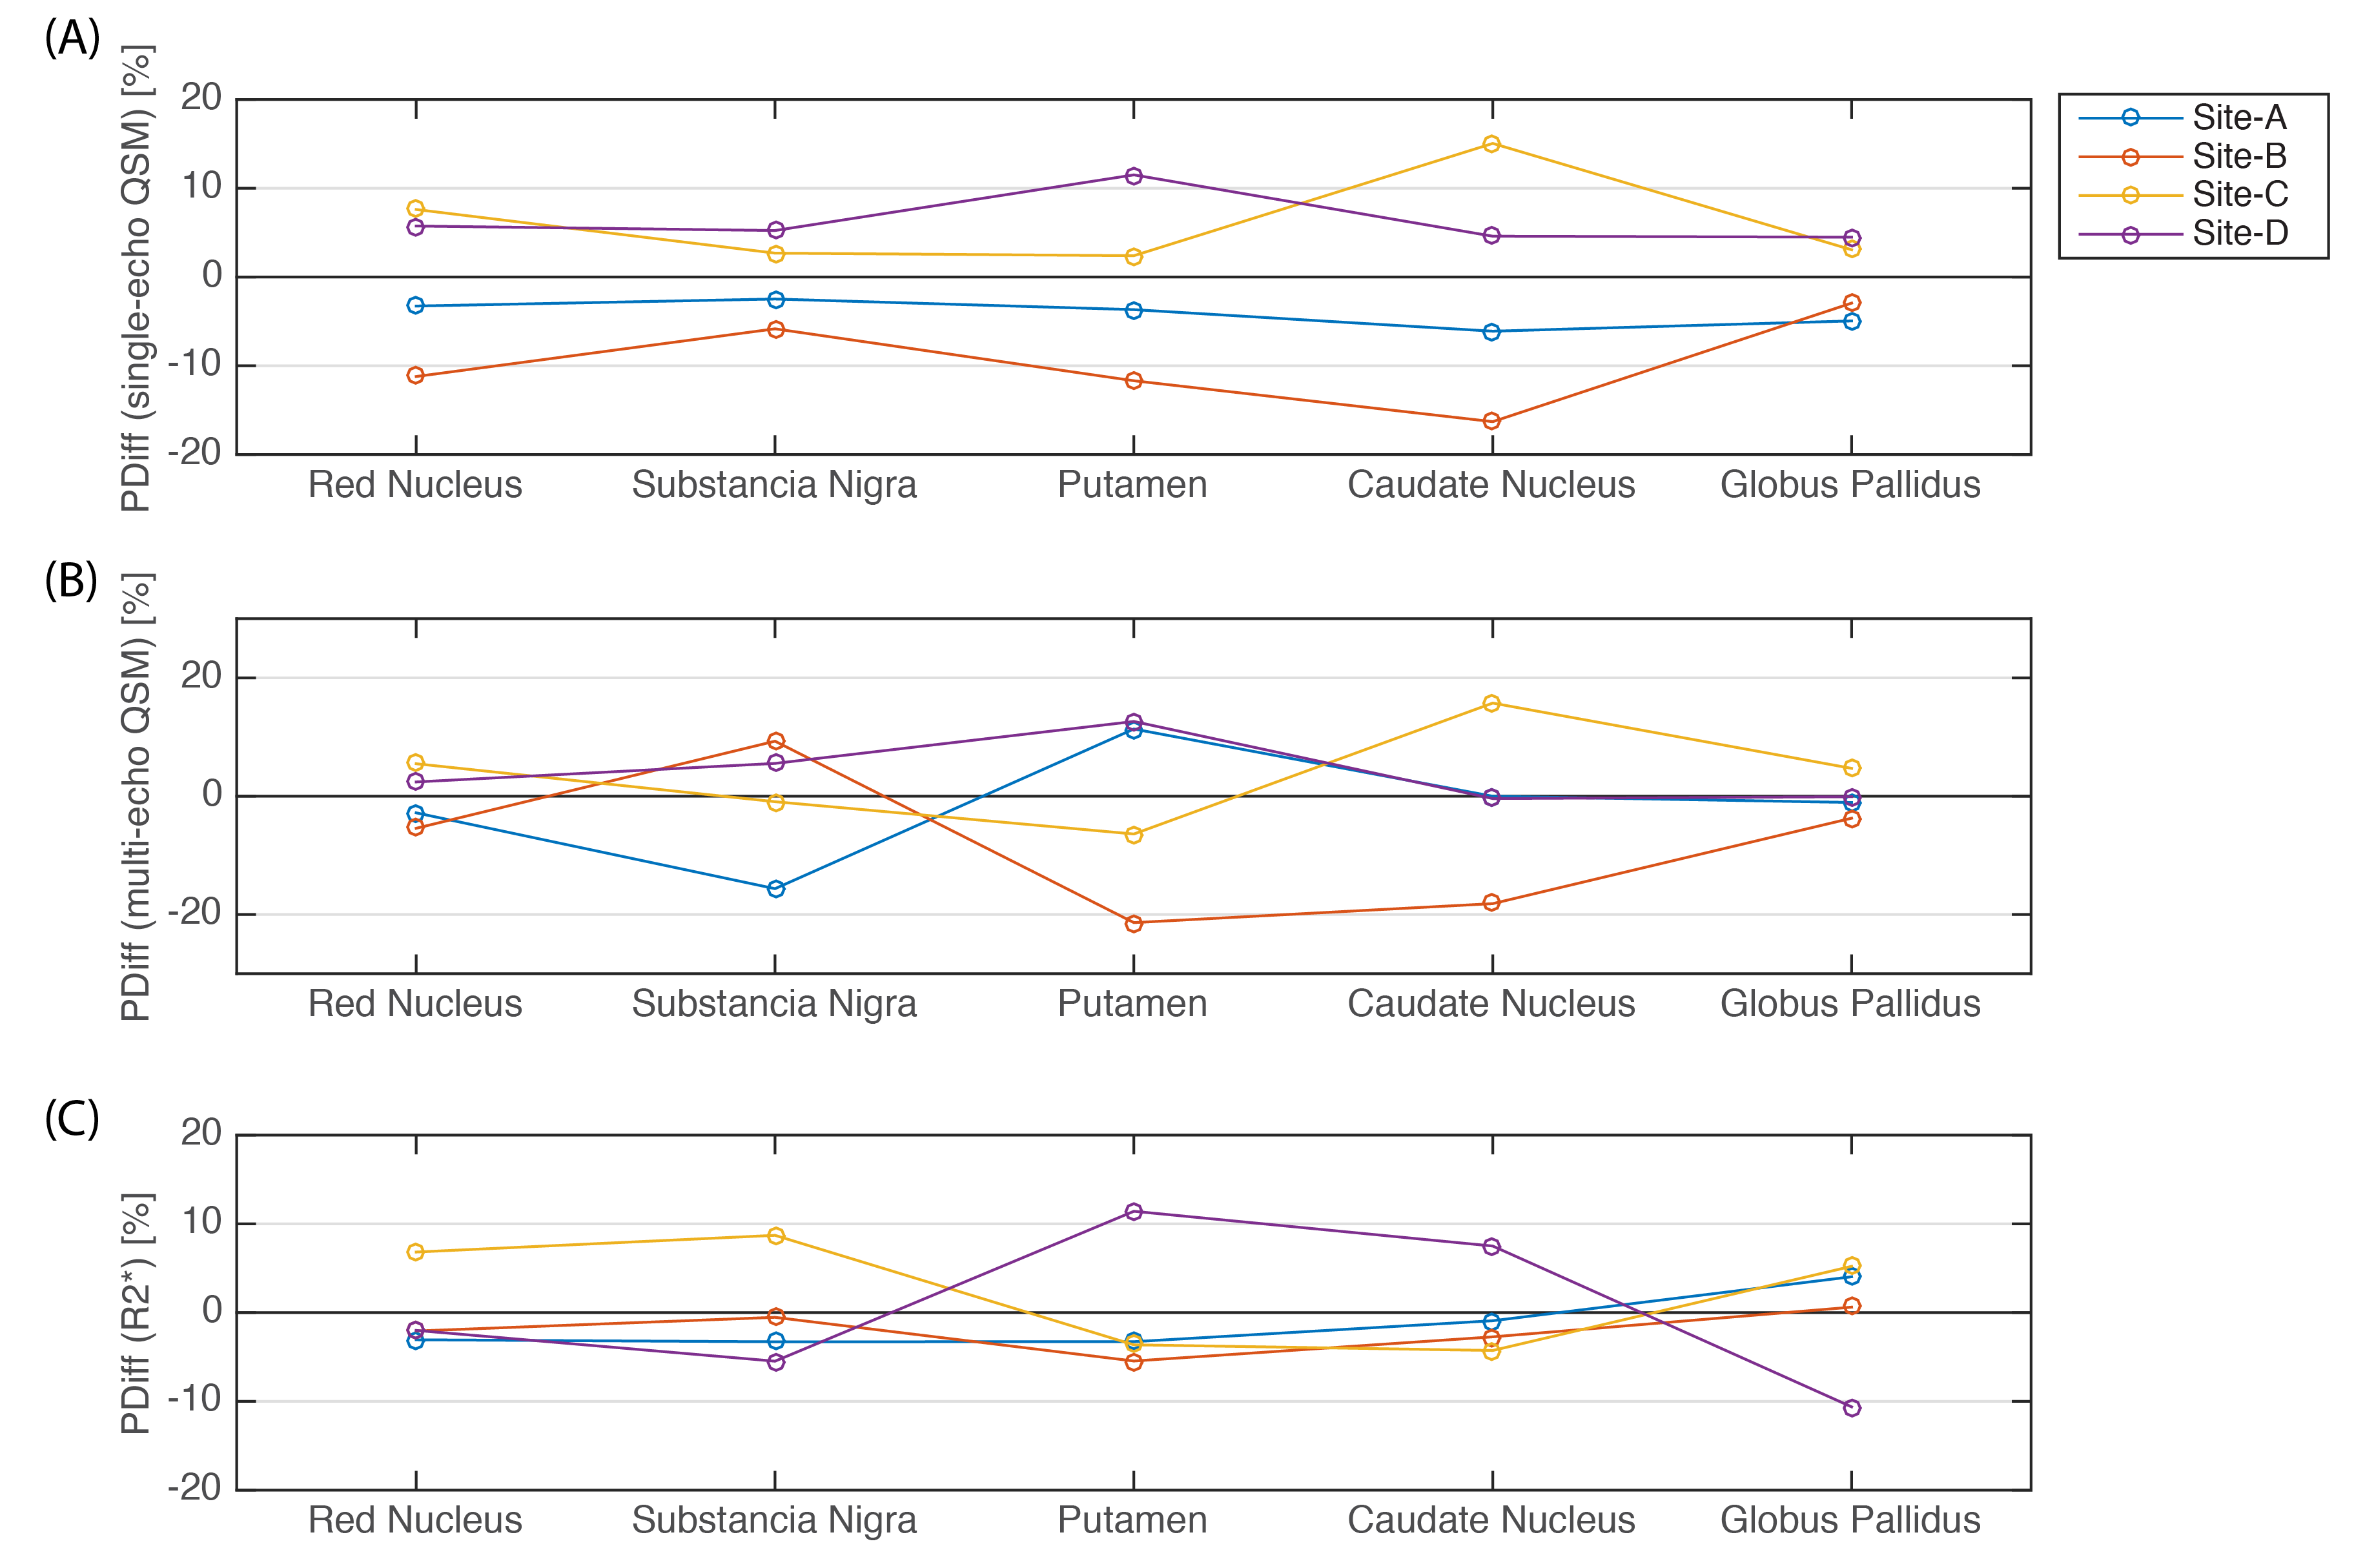
Average of single-echo and multi-echo $$$\Delta\chi$$$, and R2* from the VOIs were calculated from all subjects and scans. A cross-site comparison of the QSM and R2* was made for each subject by computing the standard deviation (SD) of the mean $$$\Delta\chi$$$ and R2* in each VOI across sites. In addition, average values across subjects per-site were calculated for all the metrics and the site-specific percentage difference to the overall average, PDiff, was estimated.
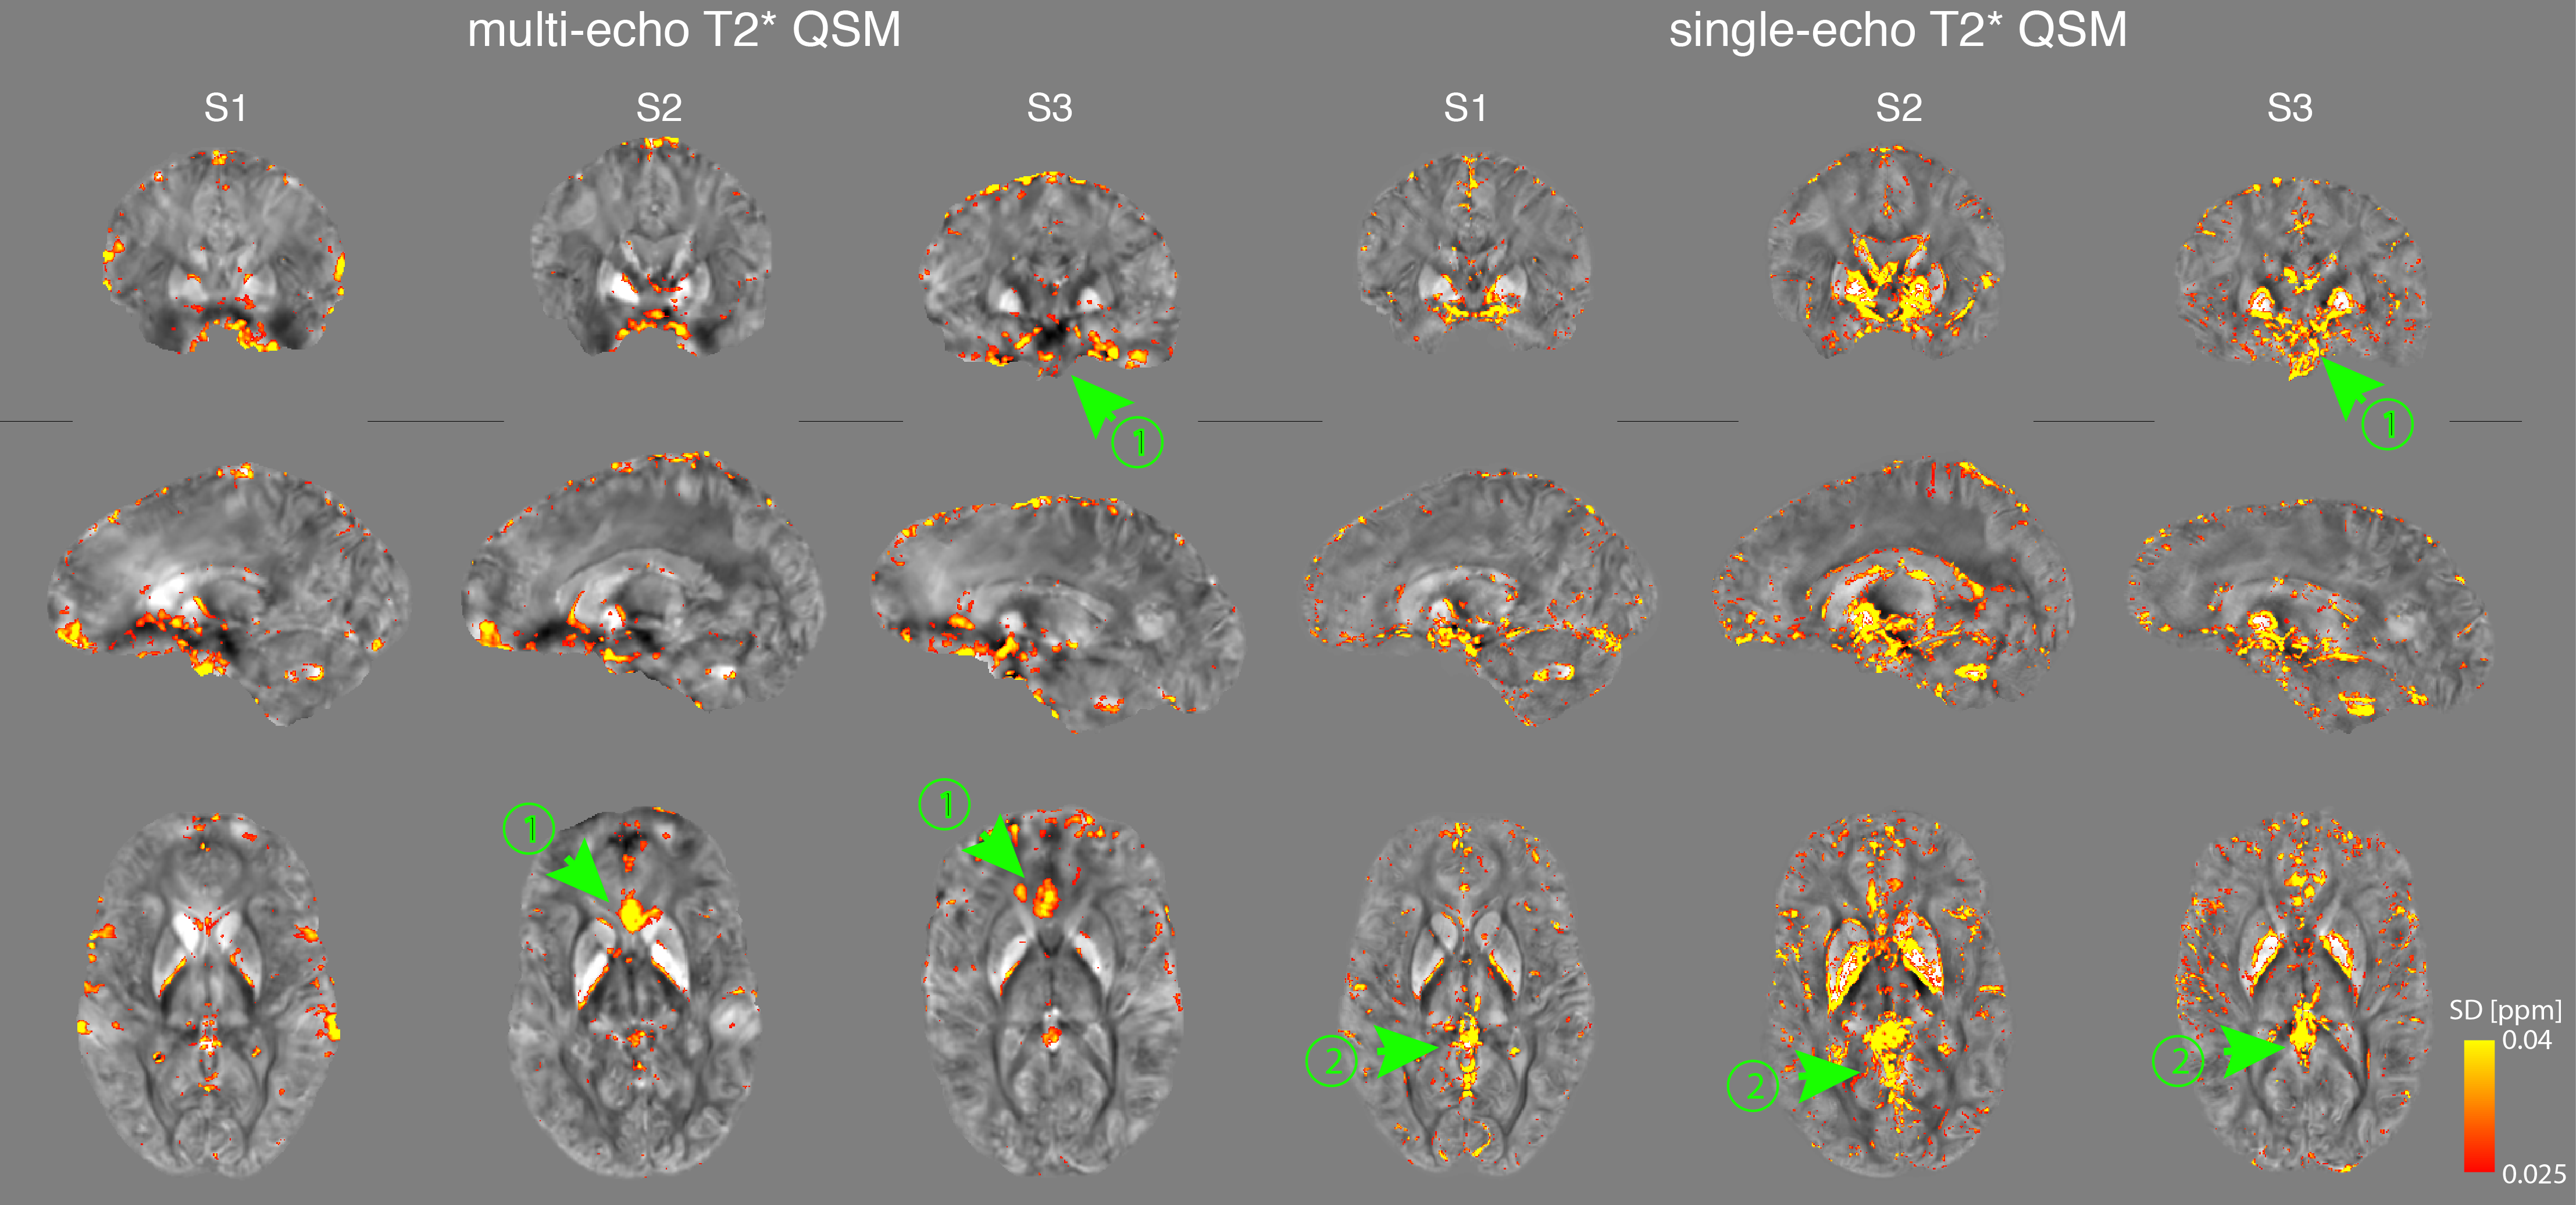
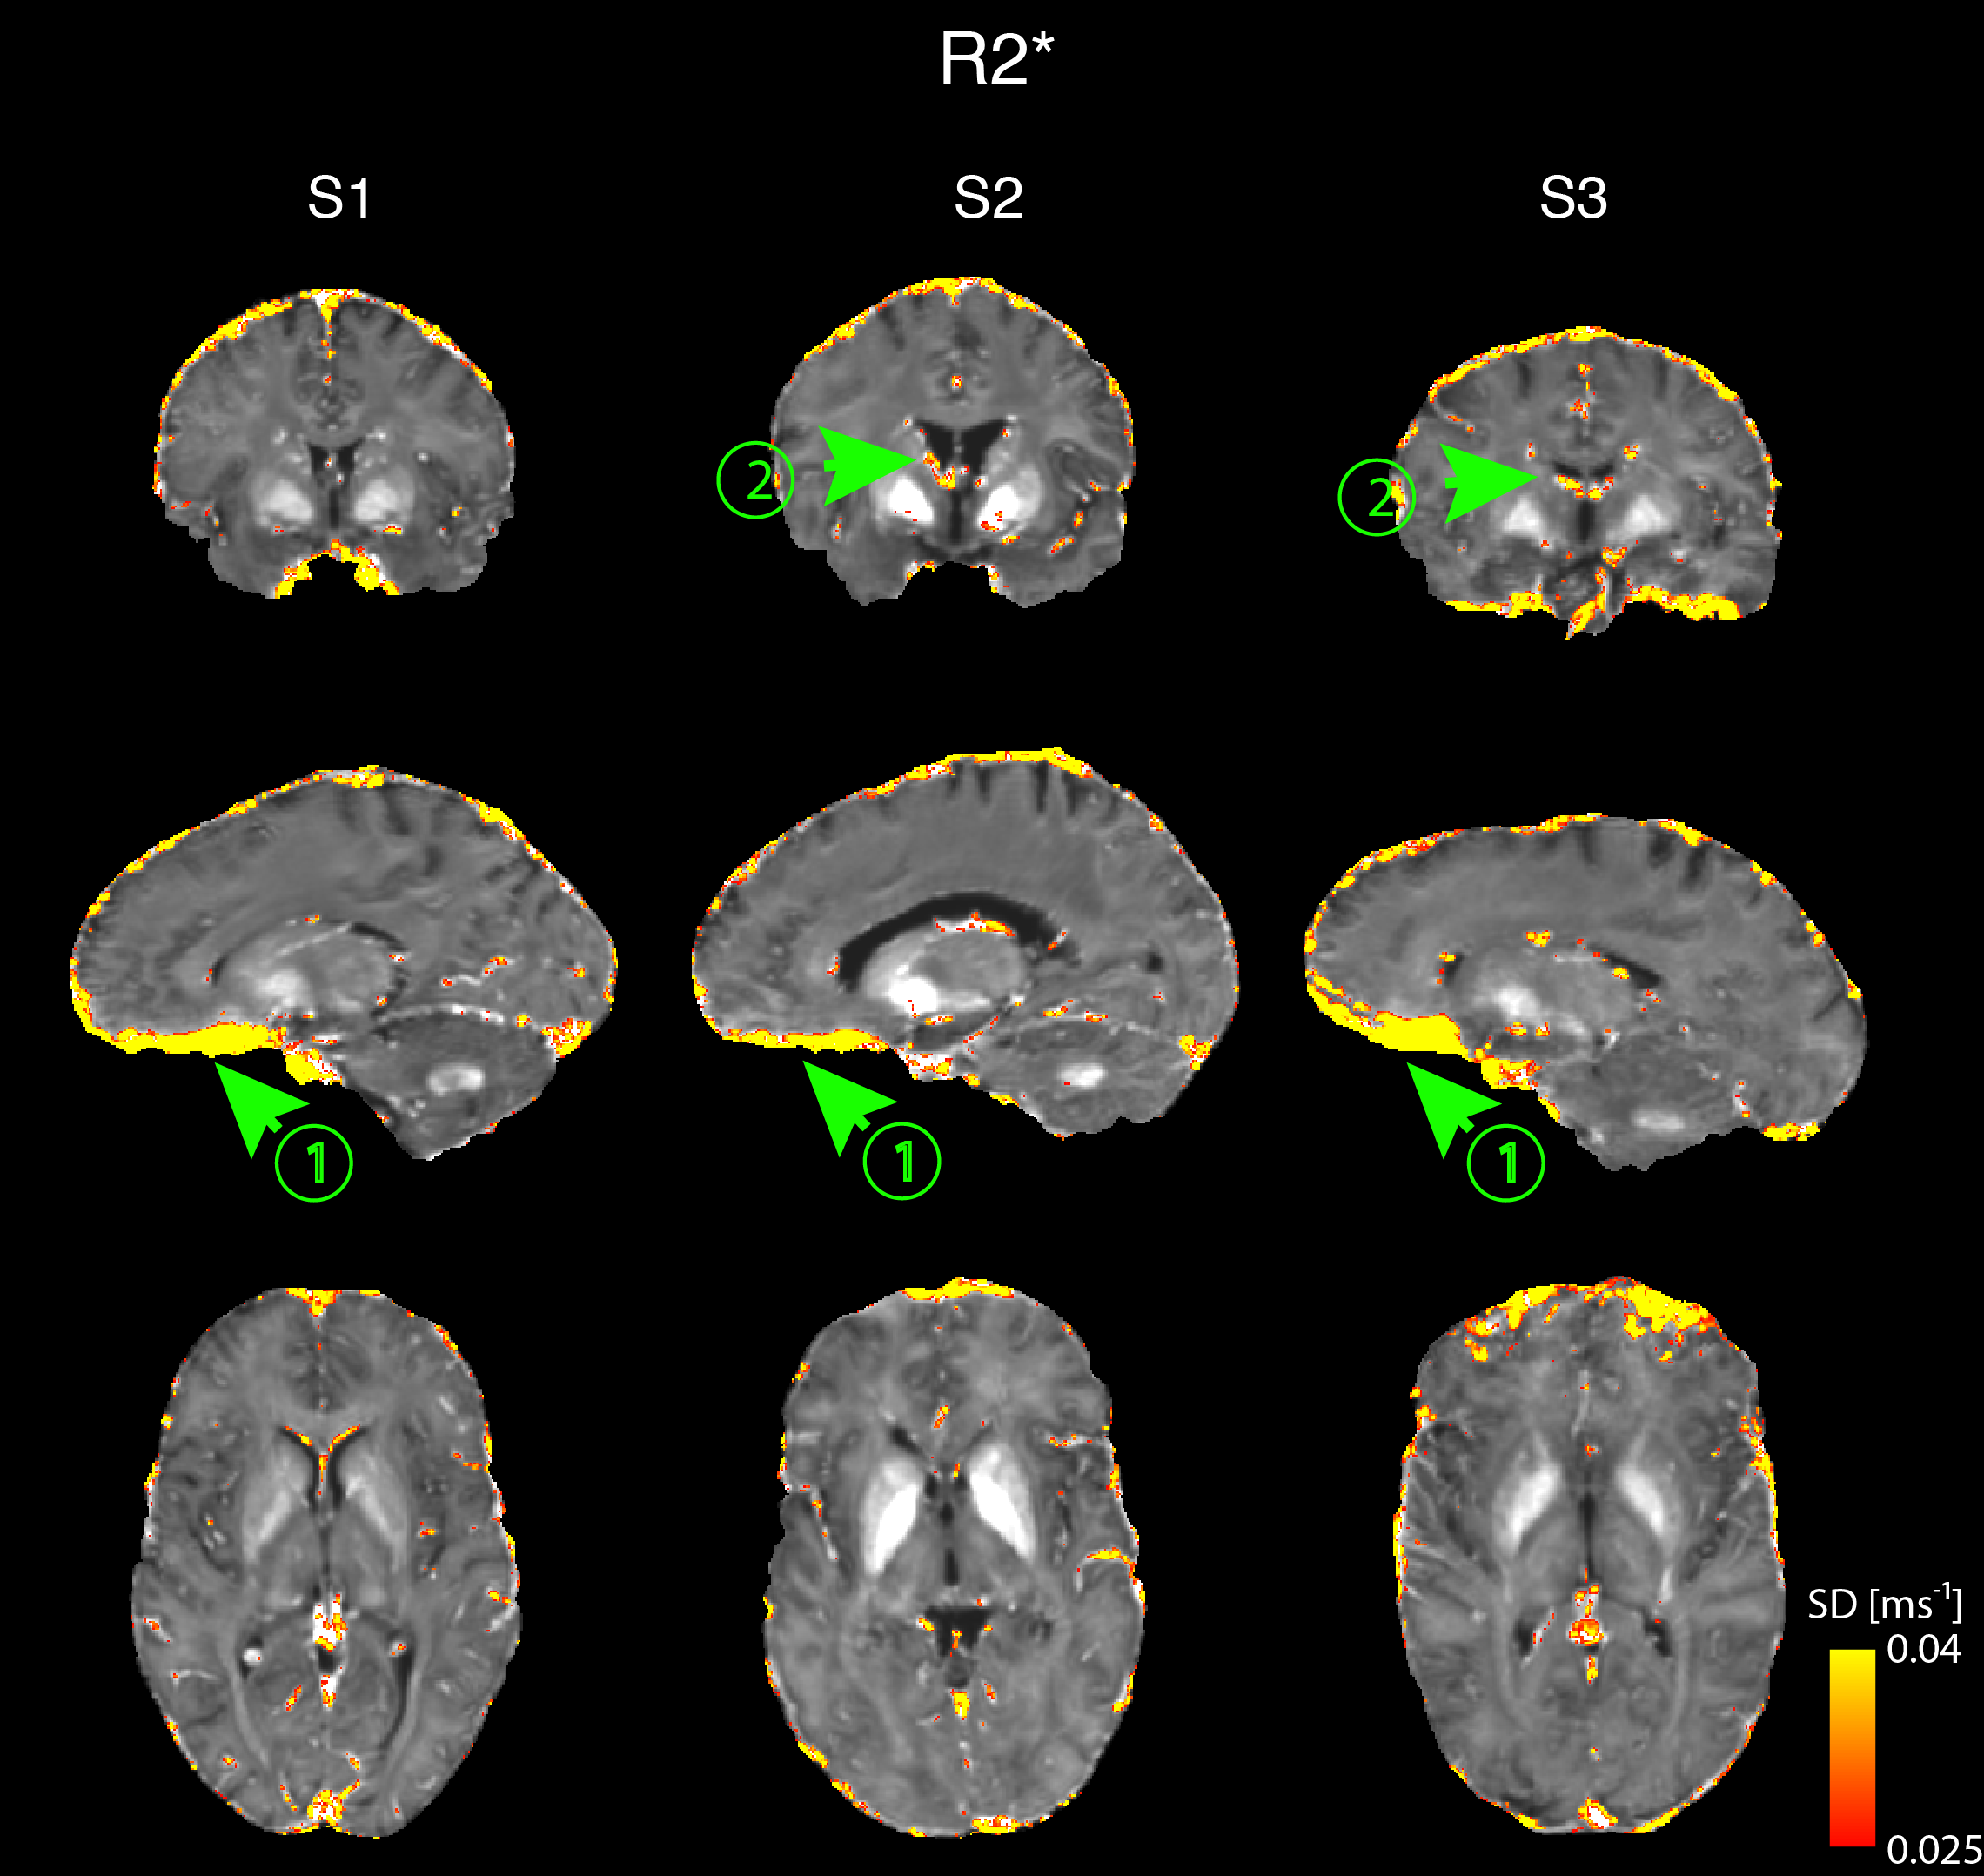
To assess the spatial variability of QSM and R2* across subjects, acquisitions of the same subject were registered to the same space (Site-A) with a 12-DOF affine registration using FLIRT. The cross-site SD of the QSM and R2* maps was computed voxel-wise.
Results
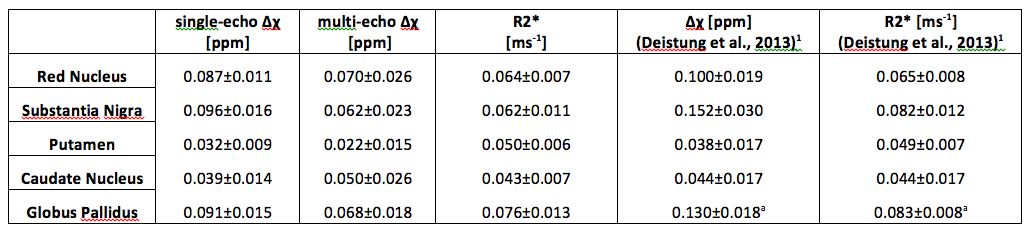
Figure 1 shows the mean and SD of $$$\Delta\chi$$$ calculated either from single-echo or the multi-echo T2*, and the R2*, on the subcortical VOIs. Overall, measurements of QSM and R2* fall within the range of literature values1. The subject-average cross-site variability levels from QSM and R2* measurements are displayed in the bar-plot of Figure 2. In all metrics we obtained similar SD values to those reported by Lin et al. (2015) for a 3T multi-site study6. PDiff plots are displayed in Figure 3. Overall, all Sites show an average deviation from the global mean of approx. 6% in all metrics. A positive bias was found for Sites-C/D while a negative bias for Sites-A/B in the single-echo QSM.
Cross-site variability maps are shown for each subject in Figures 4&5. Larger SDs were found in areas with large B0 inhomogeneity (arrowheads (1)), veins (arrowheads (2)), and near the borders of cortical structures.
Discussion and Conclusions
In this study, reference QSM and R2* measurements were obtained from multi-centre, multi-vendor scanning sessions at 7T. The average values are within an acceptable range, as previously reported in the literature, and exhibit high precision when comparing measurements across scanners. The R2* showed less cross-site variability compared to QSM data obtained from either multi-echo or single-echo datasets. A site-specific trend was found on the single-echo QSM data but the study lacks within-site repeated measurements of the same subject to validate the effect.
Although head positioning and shimming may have a local regional effect, we can conclude that all protocols implemented in this study translated into robust results that can be reproduced across three different scanner platforms.
Acknowledgements
This work was supported by the UK7T Network funded by the MRC Grant MR/N008537/1.References
1. Deistung A, Schäfer A, Schweser F, Biedermann U, Turner R, Reichenbach JR. Toward in vivo histology: a comparison of quantitative susceptibility mapping (QSM) with magnitude-, phase-, and R2*-imaging at ultra-high magnetic field strength. Neuroimage. 2013 Jan 15;65:299-314.
2. Roemer PB, Edelstein WA, Hayes CE, Souza SP, Mueller OM. The NMR Phased Array. Magn Reson Med 1990;16:192–225.
3. Li W, Avram AV, Wu B, Xiao X, Liu C. Integrated Laplacian-based phase unwrapping and background phase removal for quantitative susceptibility mapping. NMR in Biomedicine. 2014 Feb 1;27(2):219-27.
4. Li W, Wu B, Liu C. Quantitative susceptibility mapping of human brain reflects spatial variation in tissue composition. Neuroimage. 2011;55:1645-1656.
5. Jenkinson M, Smith S. A global optimisation method for robust affine registration of brain images. Med Image Anal. 2001;5:143-156.
6. Lin PY, Chao TC, Wu ML. Quantitative susceptibility mapping of human brain at 3T: a multisite reproducibility study. American Journal of Neuroradiology. 2015 Mar 1;36(3):467-74.
Figures