2218
Are all susceptibility maps created equal? – An investigation of the impact of the field-to-source inversion step on the study outcome in patient-control group studies.1Department of Medical Physics, University at Buffalo, The State University of New York, Buffalo, NY, United States, 2Buffalo Neuroimaging Analysis Center, Department of Neurology, Jacobs School of Medicine and Biomedical Sciences, University at Buffalo, The State University of New York, Buffalo, NY, United States, Buffalo, NY, United States, 3MR Research Laboratory, IRCCS, Don Gnocchi Foundation ONLUS, Milan, Italy, 4BairdMS Center, Department of Neurology, Jacobs School of Medicine and Biomedical Sciences, University at Buffalo, The State University of New York, Buffalo, NY, United States, 5Center for Biomedical Imaging, Clinical and Translational Science Institute, University at Buffalo, The State University of New York, Buffalo, NY, United States
Synopsis
Quantitative Susceptibility Mapping (QSM) is a relatively new post-processing technique for susceptibility-weighted gradient-recalled echo (GRE) phase images. The technique numerically solves an ill-posed inverse mathematical problem to reveal the tissue magnetic susceptibility distribution. Due to its uniquely high sensitivity on the tissue concentrations of myelin, calcium and iron, QSM is increasingly being applied in clinical studies of neurological diseases that are affected by demyelination and a disturbed iron homeostasis, such as multiple sclerosis (MS) and Parkinson’s disease. In the present work, to better understand the comparability and reproducibility of QSM studies, we evaluated several widely-used inversion algorithms concerning their ability to detect differences in susceptibility between two different groups of subjects, a typical scenario in clinical research.
Introduction
Quantitative Susceptibility Mapping (QSM) is a relatively new post-processing technique for susceptibility-weighted gradient-recalled echo (GRE) phase images.1-5 The technique numerically solves an ill-posed inverse mathematical problem to reveal the tissue magnetic susceptibility distribution. Due to its uniquely high sensitivity on the tissue concentrations of myelin, calcium and iron, QSM is increasingly being applied in clinical studies of neurological diseases that are affected by demyelination and a disturbed iron homeostasis, such as multiple sclerosis (MS) and Parkinson’s disease.8 Despite its increasing availability, it is yet unclear which of the many algorithmic approaches works best in vivo and if study outcomes obtained with different algorithmic approaches and parameter settings may be compared with one another. In particular, a recent multi-center study compared the majority of published field-to-source inversion algorithms against a putative in vivo gold standard obtained with Susceptibility Tensor Imaging (STI).9 The study demonstrated that the different techniques yield substantially different brain susceptibility distributions.9 In the present work, to better understand the comparability and reproducibility of QSM studies, we evaluated several widely used inversion algorithms concerning their ability to detect differences in susceptibility between two different groups of subjects, a typical scenario in clinical research.Methods
The study was approved by the local Ethical Standards Committee, and a written informed consent form was obtained from all participants. In this retrospective study, we used the same 40 patients with secondary progressive MS (SPMS; 52.0±7.0yrs; 29:11 f:m; Expanded Disability Status Scale (EDSS) median 6.5, range 4-9; disease duration 24.0±10.2yrs) and 40 age- and sex-matched normal controls (NC; 52.6±11.9yrs; 29:11 f:m) as in a recently published study.19 MRI was performed at 3T (GE Signa Excite HD 12.0) using single-echo GRE (matrix 512x192x64; 0.5x1x2mm3; 12° flip, TE/TR=22ms/40ms, bandwidth=13.89kHz). Phase images were unwrapped10 and background-field corrected.11,12 Then, we successively applied the following widely-used inversion algorithms: TKD,13 SDI,14 HEIDI,15 and non-linear MEDI (from MEDI toolbox).16 For TKD, we used the threshold parameters 0.1, 0.2, and 0.3. For MEDI, we used λ=100, 1000, and 10000. Resulting susceptibility maps were normalized (ANTs) to a custom isotropic 1mm3 susceptibility brain template18 and smoothed with a 1mm Gaussian kernel. We assessed group differences at the level of p<0.05 via voxel-wise statistical analysis using non-parametric permutation tests (FSL randomise17, 5000 permutations) and threshold-free cluster enhancement (TFCE). Differences between algorithms were quantified by counting the number of significant voxels after TFCE.Results
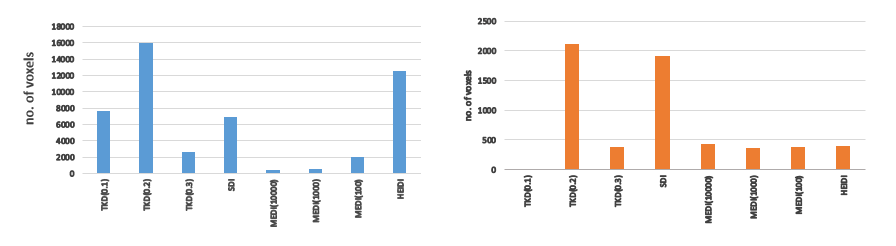
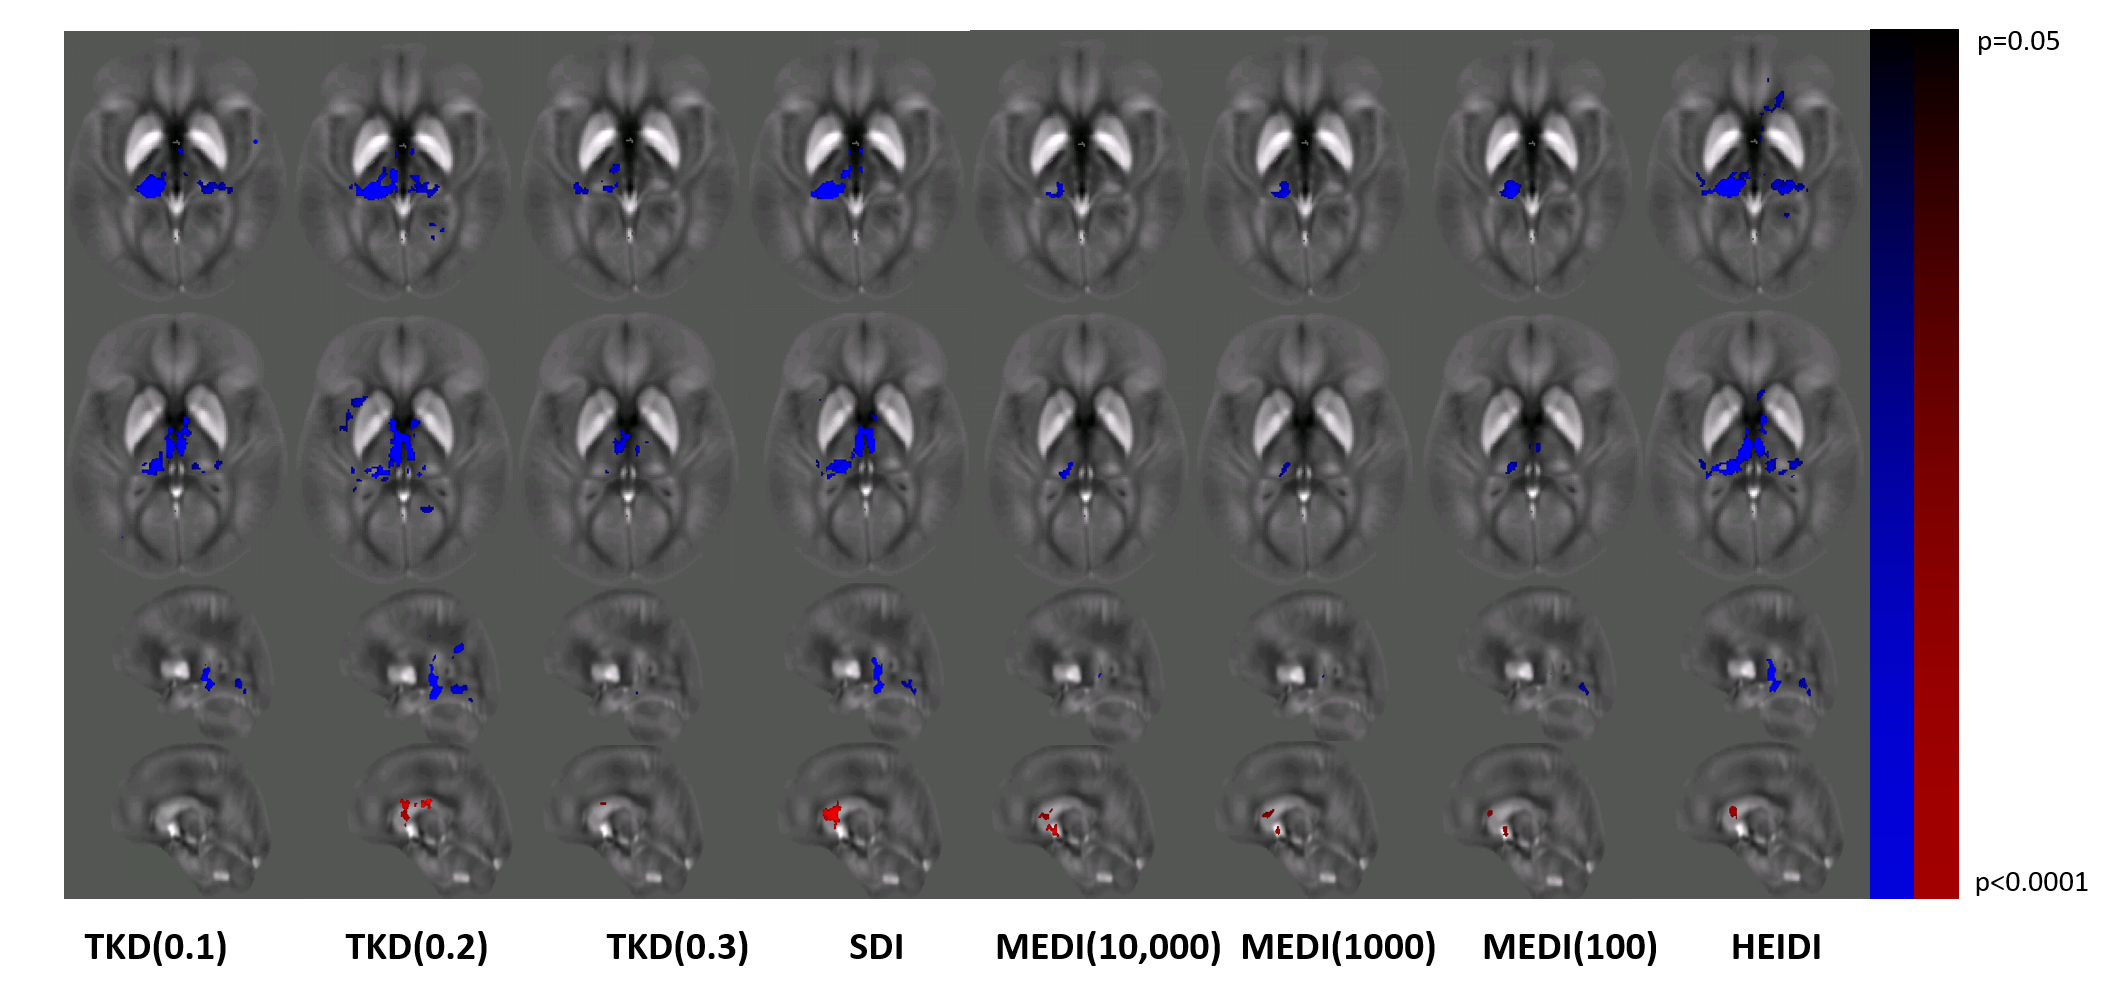
Figure 1 provides an overview of representative susceptibility maps obtained with the different algorithms and corresponding normalized images. Figure 2 quantifies the results of the statistical analysis of the different algorithms. TKD with a threshold 0.2 [TKD(0.2)] demonstrated the highest sensitivity toward MS-related disease pathology that resulted in reduced magnetic susceptibility in patients, followed by HEIDI and SDI. Independent of the parameters, MEDI detected only a few voxels with reduced susceptibility in patients. TKD(0.2) also showed the highest sensitivity for the detection of increased susceptibility in patients, followed by SDI. All other algorithms detected similar but lower numbers of voxels than TKD(0.2) and SDI, with TKD(0.1) not detecting any significant differences between the groups. Figure 3 visualizes the differences between the algorithms in exemplary slices. Overall, detected regions with significant differences were similar between most algorithms and in-line with previously published work based on the same cohort.19Discussion
This study compared different QSM algorithms concerning their sensitivity in the detection of disease-related susceptibility alterations. Among the algorithms compared, TKD(0.2) most sensitively detected group differences and MEDI had the lowest sensitivity, independent of the regularization parameter choice. The reason for this finding remains unclear but may be related to difficulties in modeling subtle susceptibility alterations with the magnitude-informed penalty term of MEDI. Compared to previous efforts, which mostly assessed the quantitative accuracy of susceptibility maps, our approach focused on the practical value in the clinical setting. The study showed that both the choice of the inversion algorithm and the algorithmic parameters could have a substantial impact on the study outcome. The evaluated algorithms massively differed in both the number of voxels with statistically significant differences between the groups and, more importantly, the anatomical locations in which differences were observed. Interestingly, the most straightforward algorithms TKD(0.2) and SDI produced the best group separations.Conclusion
The ability to detect pathological susceptibility alterations substantially differs between inversion algorithms. The framework used in our work may be a promising candidate for the evaluation of algorithms in future multi-center QSM Reconstruction Challenges9 to reveal insights into most promising reconstruction strategies and the comparability of study outcomes obtained at different centers.Acknowledgements
Research reported in this publication was funded by the National Center for Advanced Center for Advancing Translational Sciences of the National Institutes of Health under Award Number UL1TR001412. The content is solely the responsibility of the authors and does not necessarily represent the official views of the NIH.
We thank Drs. Berkin Bilgic (Martinos Center for Biomedical Imaging),Christian Langkammer (Medical University of Graz), Jose Marques(Donders Institute), Jakob Meinke (Philips), Karin Shmueli (UniversityCollege London) for stimulating discussions that ultimately motivatedthe presented work.
References
[1] J. H. Duyn, “Studying brain microstructure with magnetic susceptibility contrast at high-field,” NeuroImage, S1053-8119(17):30157-X; 2017
[2] C. Liu, W. Li, K. A. Tong, K. W. Yeom, and S. Kuzminski, “Susceptibility-weighted imaging and quantitative susceptibility mapping in the brain,” J Magn Reson Imaging, 42(1):23–41; 2015.
[3] C. Liu, H. Wei, N.-j. Gong, M. J. Cronin, R. Dibb, and K. Decker, “Quantitative Susceptibility Mapping: Contrast Mechanisms and Clinical Applications,” Tomography, 1(1):3–17; 2015.
[4] F. Schweser, A. Deistung, and J. R. Reichenbach, “Foundations of MRI phase imaging and processing for Quantitative Susceptibility Mapping (QSM),” Z Med Phys, 26(1):6–34; 2016.
[5] Y. Wang and T. Liu, “Quantitative susceptibility mapping (QSM): Decoding MRI data for a tissue magnetic biomarker,” Magn Reson Med, 73(1):82–101; 2015.
[6] C. Stüber, D. Pitt, and Y. Wang, “Iron in Multiple Sclerosis and Its Noninvasive Imaging with Quantitative Susceptibility Mapping,” Int J Mol Sci, 17(1):100;2016.
[7] S. Ropele, C. Enzinger, and F. Fazekas, “Iron Mapping in Multiple Sclerosis,” Neuroimaging Clinics of North America, 27(2);335–342; 2017
[8] H. Sjöström, T. Granberg, E. Westman, and P. Svenningsson, “Quantitative susceptibility mapping differentiates between parkinsonian disorders,” Parkinsonism & Related Disorders, 1353-8020(17); 1353-8020; 2017
[9] C. Langkammer, F. Schweser, K. Shmueli, C. Kames, X. Li, L. Guo, C. Milovic, J. Kim, H. Wei, K. Bredies, S. Buch, Y. Guo, Z. Liu, J. Meineke, A. Rauscher, J. P. Marques, and B. Bilgic, “Quantitative susceptibility mapping: Report from the 2016 reconstruction challenge,” Magn Reson Med; 00:00–00; 2017.
[10] H. S. Abdul-Rahman, M. A. Gdeisat, D. R. Burton, M. J. Lalor, F. Lilley, and C. J. Moore, “Fast and robust three-dimensional best path phase unwrapping algorithm.” Appl Opt, 46(2):6623–35; 2007.
[11] W. Li, B. Wu, and C. Liu, “Quantitative susceptibility mapping of human brain reflects spatial variation in tissue composition.” NeuroImage, 55(4):645–56; 2011.
[12] F. Schweser, A. Deistung, B. W. Lehr, and J. R. Reichenbach, “Quantitative imaging of intrinsic magnetic tissue properties using MRI signal phase: An approach to in vivo brain iron metabolism?” NeuroImage, 54(4):2789–2807; 2011.
[13] K. Shmueli, J. A. de Zwart, P. van Gelderen, T.-Q. Li, S. J. Dodd, and J. H. Duyn, “Magnetic susceptibility mapping of brain tissue in vivo using MRI phase data.” Magn Reson Med, 62(6):1510–1522; 2009.
[14] F. Schweser, A. Deistung, K. Sommer, and J. R. Reichenbach, “Toward online reconstruction of quantitative susceptibility maps: Superfast dipole inversion.” Magn Reson Med, 69(6):1581–93; 2013.
[15] F. Schweser, K. Sommer, A. Deistung, and J. R. Reichenbach, “Quantitative susceptibility mapping for investigating subtle susceptibility variations in the human brain.” NeuroImage, 62(3):2083–2100; 2012.
[16] T. Liu, C. Wisnieff, M. Lou, W. Chen, P. Spincemaille, and Y. Wang, “Nonlinear formulation of the magnetic field to source relationship for robust quantitative susceptibility mapping.” Magn Reson Med, 69(2):467–76; 2013.
[17] Winkler A.M., Ridgway G.R., Webster M.A., Smith S.M., Nichols T.E, “Permutation inference for the general linear model.” NeuroImage, 92:381-97; 2014.
[18] Jannis Hanspach, Michael G. Dwyer, Niels P. Bergsland, Xiang Feng, Jesper Hagemeier, Nicola Bertolino, Paul Polak, Jurgen R. Reichenbach, Robert Zivadinov, and Ferdinand Schweser, “Methods for the Computation of Templates From Quantitative Magnetic Susceptibility Maps (QSM): Toward Improved Atlas- and Voxel-Based Analyses (VBA)” J Magn Reson Imaging, 46(5):1474-1484; 2017.
[19] Ferdinand Schweser, Ana Luiza Raffaini Duarte Martins, Jesper Hagemeier, Fuchun Lin, Jannis Hanspach, Bianca WeinstockGuttman, Simon Hametner, Niels P Bergsland, Michael G Dwyer, Robert Zivadinov, “Mapping of Thalamic Magnetic Susceptibility in Multiple Sclerosis Indicates Decreasing Iron with Disease Duration: A Proposed Mechanistic Relationship between Inflammation and Oligodendrocyte Vitality” NeuroImage (In press)
Figures