2215
Investigating the Effect of Prior Stroke on Regional Brain Iron Concentrations in Children with Sickle Cell Anaemia using MRI Susceptibility Mapping.1Medical Physics and Biomedical Engineering, University College London, London, United Kingdom, 2Imaging & Biophysics Unit, UCL Institute of Child Health, London, United Kingdom, 3Neurosciences Unit, UCL Institute of Child Health, London, United Kingdom
Synopsis
Regional iron concentrations in the brains of children with Sickle Cell Anaemia (SCA) were examined using susceptibility mapping (SM), in the first study to apply SM to an African cohort in Tanzania. Mean susceptibility values in three deep-brain regions were compared to age, blood ferritin levels and history of clinical stroke. Mean susceptibility values increased linearly with age, but there was no significant correlation between susceptibility values and blood ferritin levels. SCA patients who had suffered stroke prior to MRI had significantly lower susceptibility values than stroke-free patients. This may suggest a role for iron deficiency in stroke in SCA.
Introduction
Sickle Cell Anaemia (SCA) is a genetic condition that affects the development of red blood cells (RBC). Compared to healthy RBCs, the modified sickle-shaped cells break down more prematurely, causing haemolytic anaemia(1). Furthermore, the rigid, sickled RBCs cause blockages within blood vessels, increasing the risk of stroke.
The effect of SCA upon iron levels in the brain is not understood. This information is clinically relevant as iron concentration plays a crucial role in cognitive function(2). Susceptibility Mapping (SM) can be used to investigate the iron concentrations in deep iron-rich regions of the brain, as tissue susceptibility values (χ) are directly proportional to tissue iron content, stored in the form of ferritin macromolecules(3).Iron Deficiency (ID), which is assessed by measuring blood ferritin levels, may have a confounding effect upon brain iron concentration(4), and it is suggested that ID may play a role in causing clinical stroke(5).
This work aims to assess the following hypotheses: 1) regional χ values are lower in SCA patients with lower blood ferritin values. 2) regional χ values are lower in patients who had suffered a clinical stroke prior to the MRI exam.
This study is the first to apply SM techniques to an African population, where three quarters of the global SCA population resides, and iron deficiency is highly prevalent. Patients in the cohort have not received chronic blood transfusions, which are known to cause iron overloading in the liver(6), allowing a natural history of SCA to be examined.
Methods
48 children with SCA (age: 9.8 ± 2.2 years) were recruited from the Muhimbili Sickle Cohort, Dar es Salaam Tanzania. SCA was confirmed using haemoglobin electrophoresis.
3D Gradient-recalled-echo images were acquired on a 1.5T Phillips Achieva system (Best, NL) at the Muhimbili National Hospital (MNH), Dar es Salaam, Tanzania, using an 8-channel head coil and Resolution = 0.89 x 0.89 x0.8 mm, Matrix Size = 256x256x80, TE/TR = 40/50ms, 1 Echo and Flip Angle = 12˚. Alongside the MRI examination, blood tests were taken and a survey of clinical event history was completed.
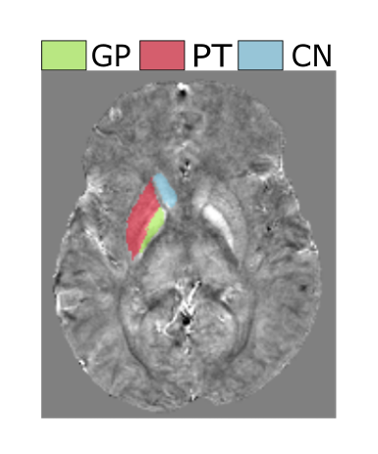
For each patient a χ map was calculated using the following pipeline. Phase images were unwrapped using a Laplacian-based method(7) and an FSL BET brain mask(8). Background fields were removed using the Projection onto Dipole Fields method(9). Field-to-susceptibility inversion was performed using the Thresholded K-Space Division technique(3) (δ = 2/3) with correction for χ underestimation(7). The Caudate Nucleus (CN), Putamen (PT) and Globus Pallidus (GP) were segmented based on the Eve atlas(10), which was co-registered to each patient’s magnitude image using NiftyReg(11).
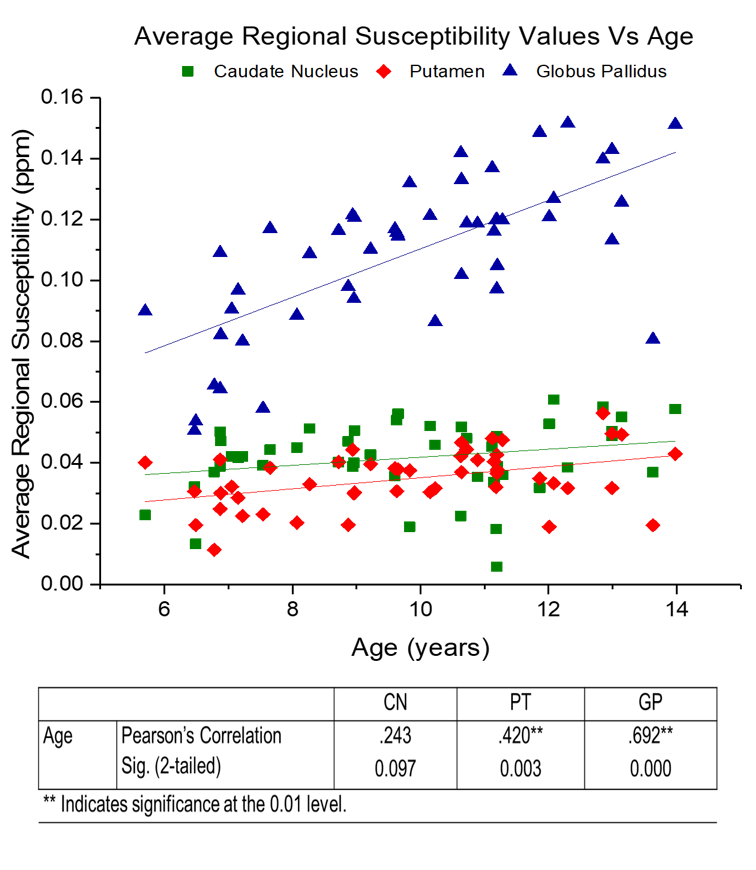
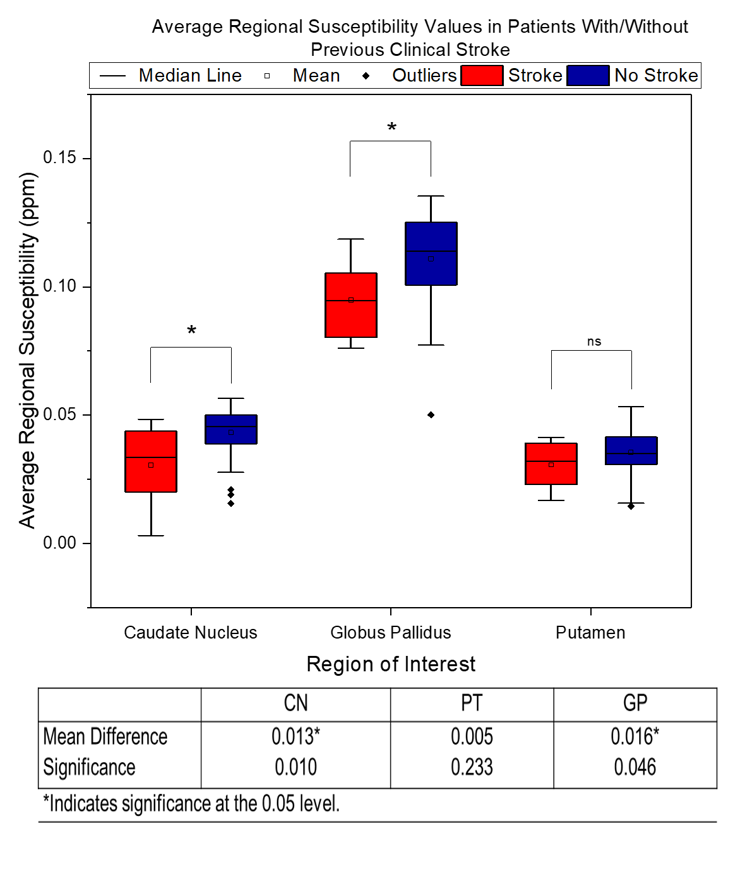
Regression analysis was performed to investigate whether χ values increased with age(12). To investigate our first hypothesis, multiple regression analysis was carried out on the blood ferritin and regional χ values, controlling for age. Our second hypothesis was examined by performing ANCOVA analysis on the age-corrected χ values of patients with and without a history of clinical stroke prior to the MRI.
Results
Figure 1 shows an example χ map calculated for a representative patient, with the segmented GP, PT and CN regions overlaid. Figure 2 displays the mean χ values plotted against age: a significant correlation between χ and age was found in the PT and GP (p-value = 0.003 and 0.000). No significant correlation was found between the χ values and blood ferritin levels. Figure 3 displays susceptibility values for the populations of SCA patients with and without clinical stroke prior to the MRI. Significantly lower χ values were observed in the CN and GP (p-value = 0.010 and 0.046) in patients who had suffered from clinical stroke prior to the MRI exam, compared to the rest of the cohort.
Discussion, Conclusions and Future Work
Our age regression analysis shows that for the age range present in this cohort (5-14 years), χ values are significantly correlated with age in the GP and PT. We show the absence of a significant correlation between blood ferritin levels and regional χ values. This may be due to the regulatory role of the blood brain barrier maintaining iron homeostasis in the brain(13). The lower susceptibility values in patients with clinical stroke supports previous work which suggests that ID plays a role in the causes of clinical stroke(5). The low number of transfusions within this Tanzanian cohort, likely highlighted the difference in susceptibility values between the populations with/without history of stroke. The acquisition of data from healthy controls, which will allow the effect of SCA on brain tissue iron levels to be considered, is currently ongoing at the MNH.Acknowledgements
This study was supported by the EPSRC-funded UCL Centre for Doctoral Training in Medical Imaging (EP/L016478/1) and the Department of Health’s NIHR-funded Biomedical Research Centre at Great Ormond Street Hospitals.
References
1. McCurdy PR, Sherman AS. Irreversibly sickled cells and red cell survival in sickle cell anemia. A Study with Both DF32P and 51CR. Am J Med. 1978;64(2):253–8.
2. Carpenter KLH, Li W, Wei H, et al. Magnetic susceptibility of brain iron is associated with childhood spatial IQ. Neuroimage. 2016;132:167–74.
3. Shmueli K, de Zwart JA, van Gelderen P, et al. Magnetic susceptibility mapping of brain tissue in vivo using MRI phase data. Magn Reson Med. 2009;62(6):1510–22.
4. Beard J. Iron deficiency alters brain development and functioning. J Nutr. 2003;133:1468S–72S.
5. Ganesan V, Prengler M, McShane MA, et al.. Investigation of risk factors in children with arterial ischemic stroke. Ann Neurol. 2003;53(2):167–73.
6. Ballas SK. Iron overload is a determinant of morbidity and mortality in adult patients with sickle cell disease. Semin Hematol. 2001;38:30–6.
7. Schweser F, Deistung A, Sommer K, Reichenbach JR. Toward online reconstruction of quantitative susceptibility maps: Superfast dipole inversion. Magn Reson Med. 2013;69(6):1582–94.
8. Smith SM. Fast robust automated brain extraction. Hum Brain Mapp. 2002;17(3):143–55.
9. Liu T, Khalidov I, de Rochefort L, et al. A novel background field removal method for MRI using projection onto dipole fields (PDF). NMR Biomed. 2011;24(9):1129–36.
10. Lim IAL, Faria A V., Li X, et al. Human brain atlas for automated region of interest selection in quantitative susceptibility mapping: Application to determine iron content in deep gray matter structures. Neuroimage. 2013;82:449–69.
11. Modat M, Ridgway GR, Taylor ZA, et al. Fast free-form deformation using graphics processing units. Comput Methods Programs Biomed. 2010;98(3):278–84.
12. Li W, Wu B, Batrachenko A, et al. Differential developmental trajectories of magnetic susceptibility in human brain gray and white matter over the lifespan. Hum Brain Mapp. 2014;35(6):2698–713.
13. Bradbury MW. Transport of iron in the blood-brain-cerebrospinal fluid system. J Neurochem. 1997;69(2):443–54.
Figures