2213
Magnetic susceptibility characterization of human habenula at 3T: comparison of QSM and R2*1Department of Biomedical Engineering, Sungkyunkwan University, Suwon, Republic of Korea, 2IBS Center for Neuroscience Imaging Research, Suwon, Republic of Korea
Synopsis
To investigate the potential of magnetic susceptibility as a biomarker for habenula studies, we have obtained quantitative susceptibility maps (QSM) and R2* maps from 21 normal volunteers at high spatial resolution. Compared to R2* maps, QSM showed more conspicuous and localized contrast in habenula in about 75% of the volunteers. Measured susceptibility and R2* values exhibited clear positive correlation, indicating iron-dominance (as opposed to myelin) of the susceptibility contrast in habenula. Significant heterogeneity of the susceptibility contrast across the subjects and within the tissue appear to be a challenge for using QSM as a biomarker for human habenula research.
Introduction
The habenula is a small deep brain structure which is located next to the thalamus protruding into the third ventricle slightly superior to the posterior commissure.1 It is known to play an important role in brain reward circuitry and psychiatric conditions such as depression.2 High density of white matter fibers, which manifest themselves as hyperintense voxels in T1-weighted images, are believed to support such functions.3 Despite much interest in habenula from the neuroscience community, MR-based noninvasive studies of habenula have been limited due to the small size and lack of clear biomarkers. Recent studies4,5 on a small number of volunteers have suggested that quantitative susceptibility mapping (QSM) could provide a useful biomarker based on high level of iron concentration in habenula.6 Presence of both myelinated fibers and iron in the habenula could make susceptibility-based habenula studies complicated, potentially explaining significant heterogeneity in the QSM of habenula across the volunteers.5 In this work, we obtained high-resolution QSM in the habenula from 21 volunteers and compared the results with R2* in the same region in order to further investigate the potential of QSM as a biomarker for habenula studies.Methods
Twenty one healthy volunteers (11 males, age=34.5±15.3; 10 females, age=40.6±17.3) were scanned in the brain with a 3D multi-echo gradient echo sequence using a 20-channel head-and-neck array at 3T (Magnetom Prisma, Siemens Healthineers, Germany). All scans were performed following a protocol approved by the local ethics committee. The scan parameters followed ref 5, including number of slices=120, number of echoes=8, voxel size=0.53x0.53x0.8mm3. Each scan took 18m 50s. Three volunteers (1 male, 2 female) were scanned 10 times for scan-rescan reproducibility test. All image processing was performed in Matlab (R2015b, Mathworks, USA). After manual coil combination based on TE=0 phase subtraction, the R2* maps and QSM were reconstructed by the following procedure. R2* was calculated by pixel-by-pixel monoexponential fit of magnitude data from all TEs after removing Rician noise.7, 8 QSM was reconstructed from magnitude and phase data by using STI Suite (version 3.0.), which removed background phase by V-SHARP and employed STAR-QSM9 for streaking artifact-reduced dipolar inversion. Three dimensional ROI masks for habenula were manually drawn based on the axial slices where habenula was visible. The reference region was chosen to be the thalamus excluding pulvinar on one of the slices. The susceptibility and the R2* values used for statistical analysis were taken from the average of the top 5 pixel values (corresponding to 1.21mm3) in the 3D ROI masks. For R2*, pixel values above 80 were excluded as outliers due to partial volume and fitting errors.
Results
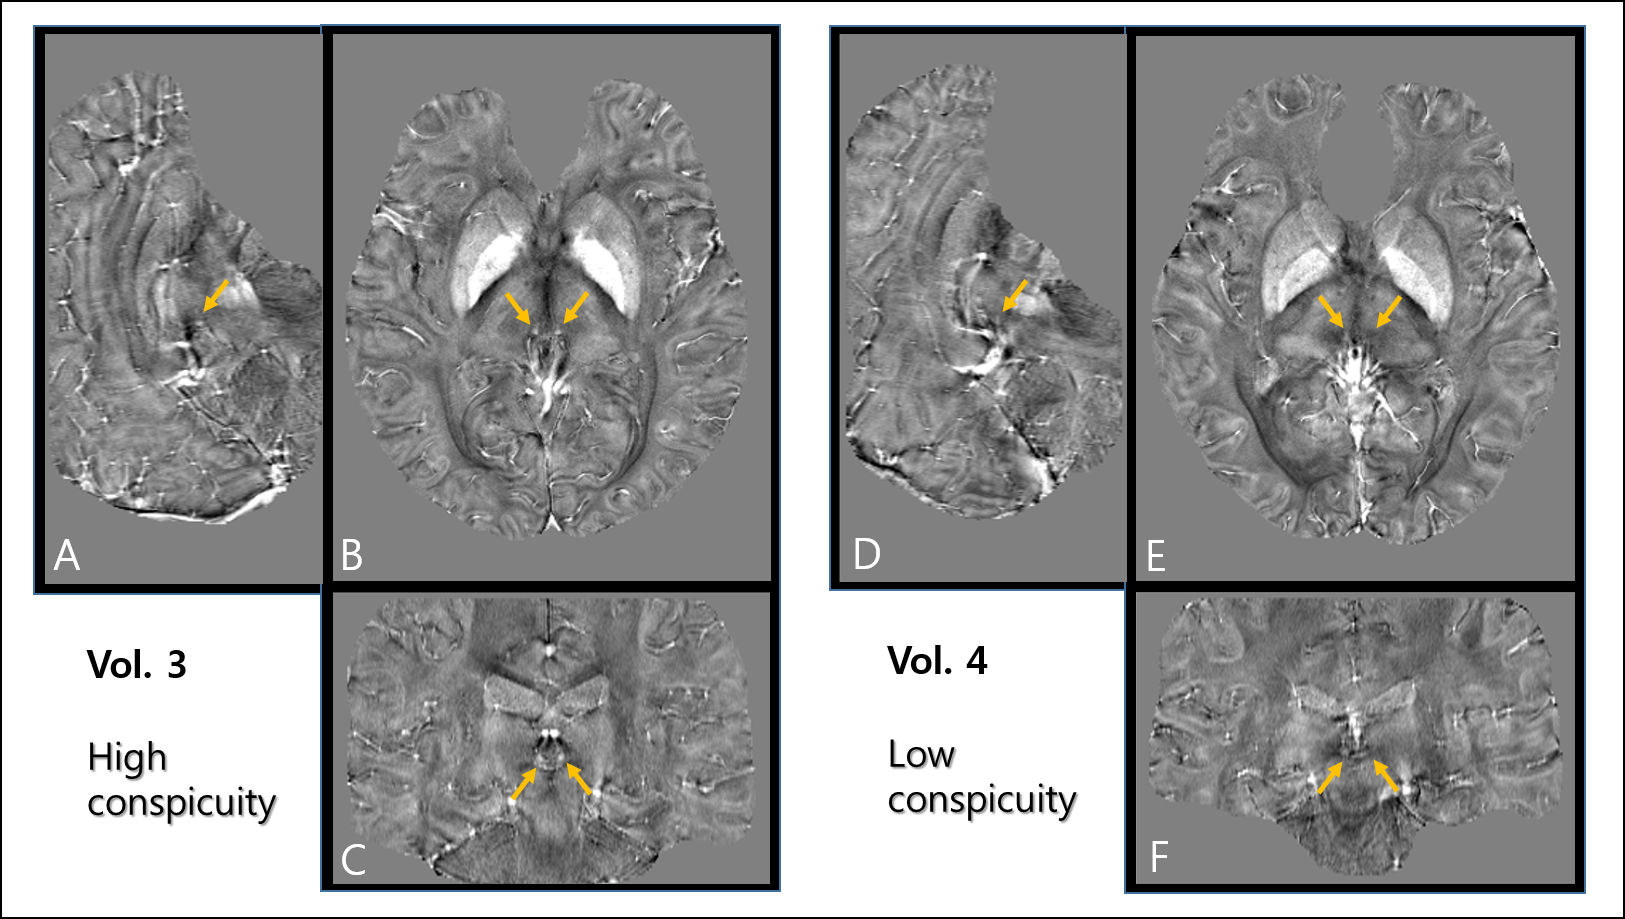
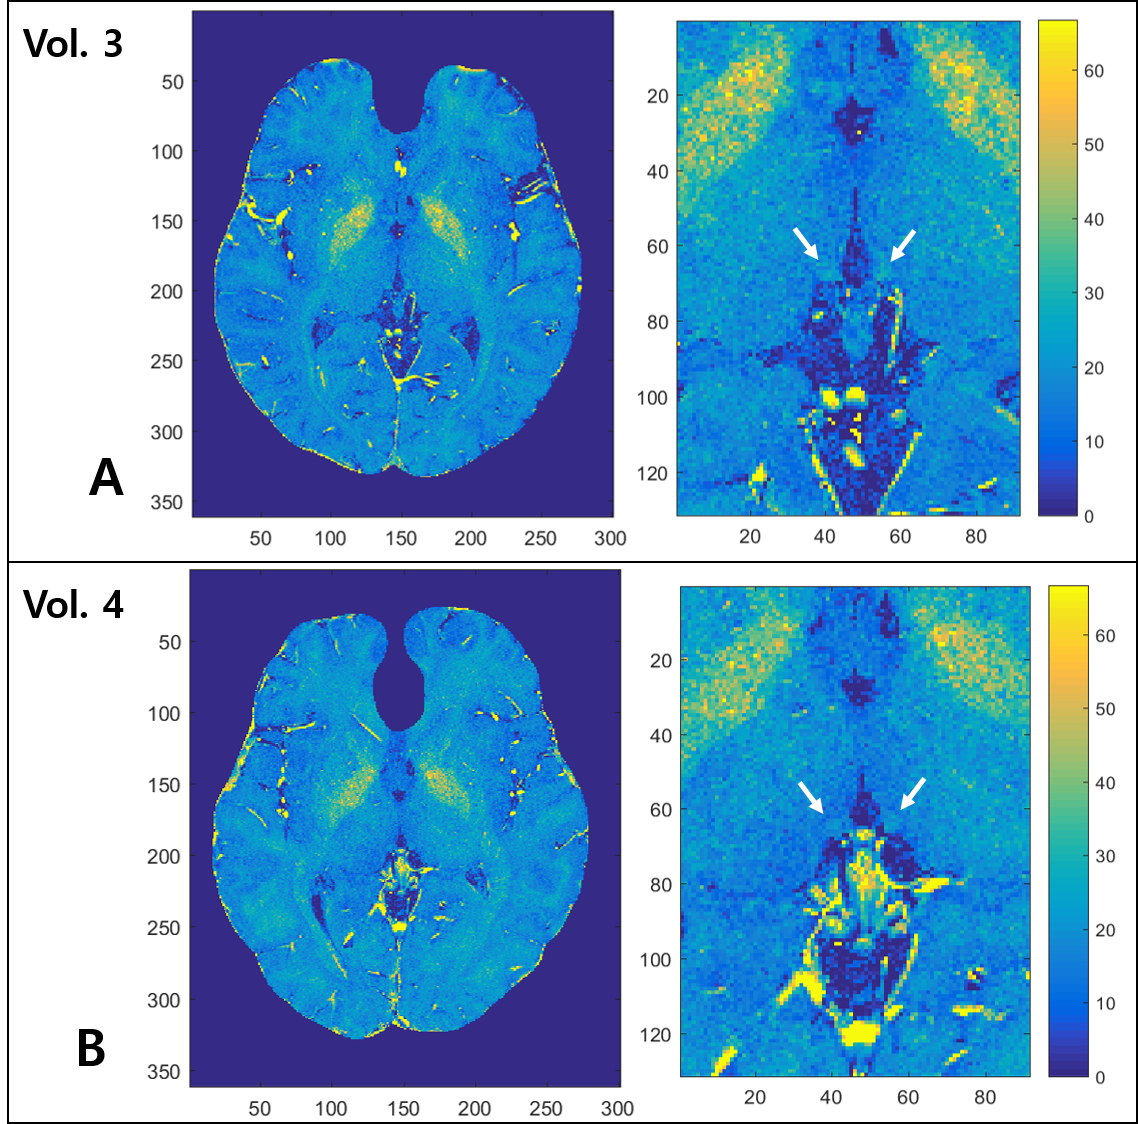
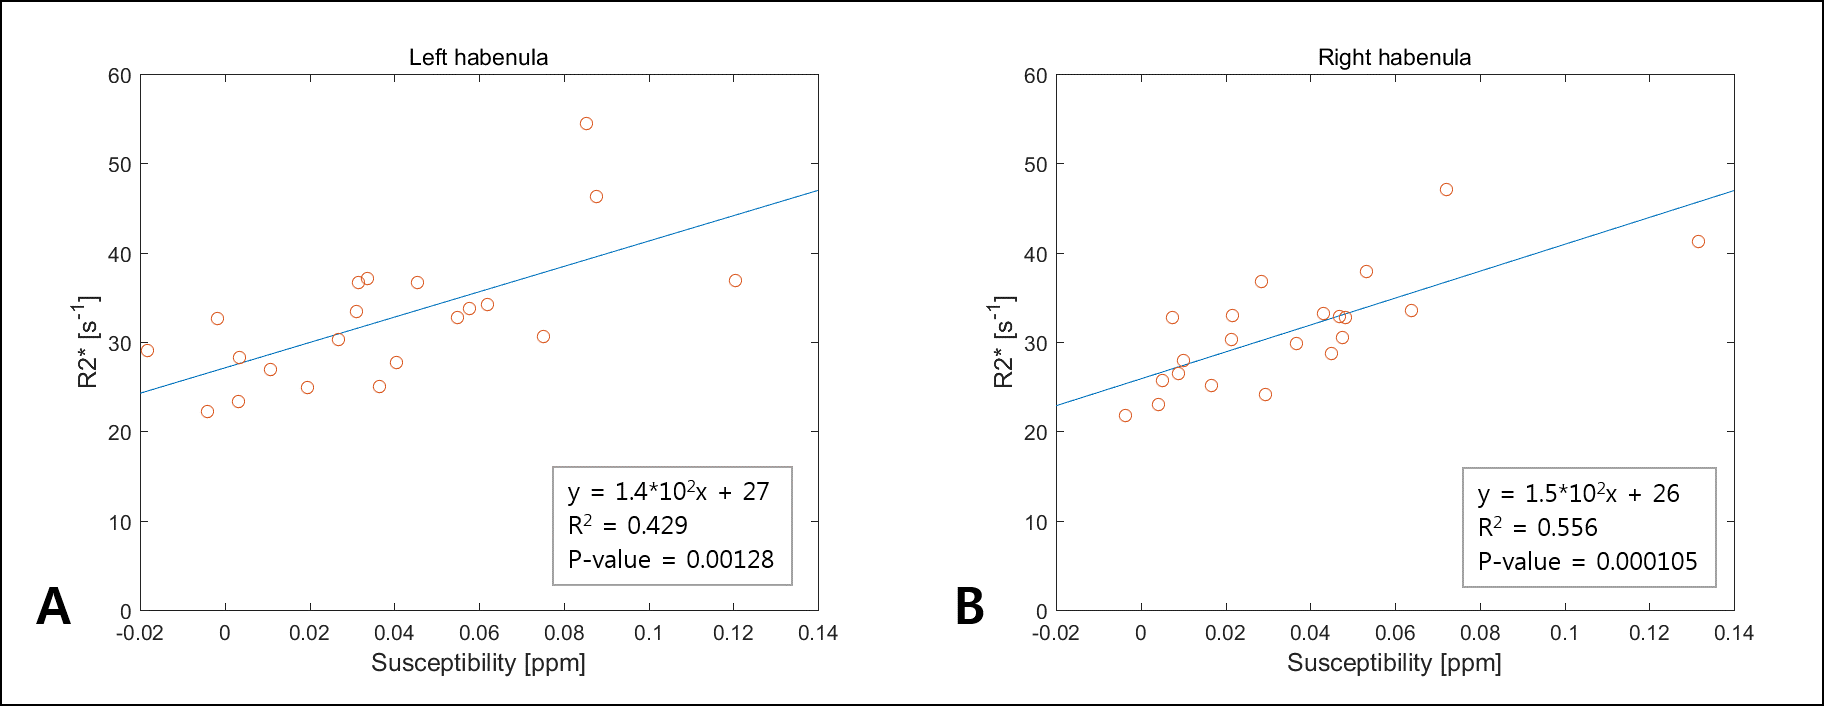
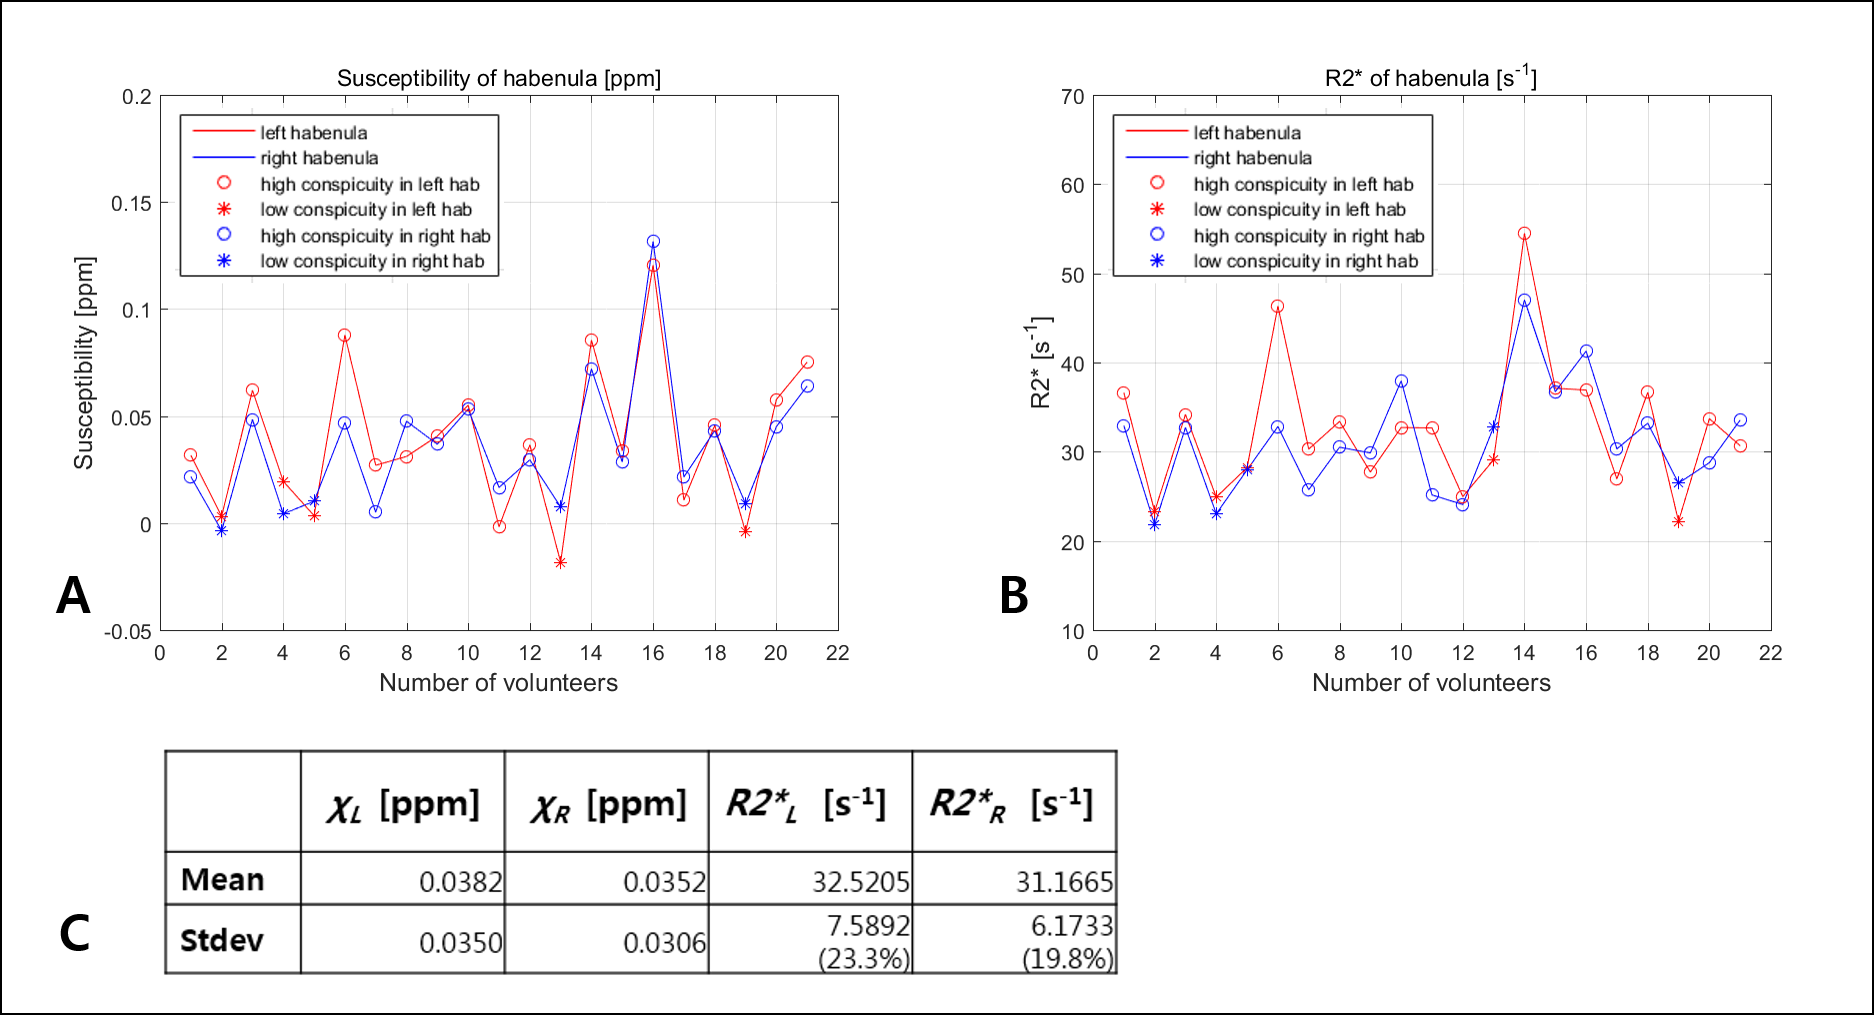
For the three volunteers who were scanned 10 times, the standard deviation of habenula susceptibility ranged from 0.007~0.013ppm. We found that 16 out of 21 volunteers exhibited relatively high and localized positive susceptibility contrast in the habenula region (Fig 1A-C). For most of these cases, the number of enhanced susceptibility voxels was no more than 15 (corresponding to 3.4mm3). The rest (5) of the subjects showed little QSM contrast in the habenula (Fig 1.D-F); such inter-subject heterogeneity is consistent with the earlier report.5 Figure 2 shows the R2* maps of the same volunteers in Fig.1. Compared to QSM, R2* maps showed much less localized susceptibility enhancement in the habenula, as well as relatively low subject-to-subject variability. Figure 3 shows clear positive correlation between susceptibility and R2* values inside both left (Fig 3.A) and right (Fig 3.B) habenula. Because myelin and iron contribute to susceptibility and R2* with different signs10,11 (namely, iron increases both susceptibility and R2* while myelin contributes negative susceptibility and positive R2*), the observed positive correlation implies that subject-to-subject susceptibility variation is likely dominated by the iron content, not myelin. Figure 4 presents the R2* and susceptibility values for all subjects, along with subject statistics. The subject-to-subject susceptibility variation (standard deviation) was about 3 times the scan-to-scan variability.Discussion & Conclusion
We have compared two quantitative susceptibility-based contrasts (QSM and R2*) in human habenula at 3T. Compared to the previous studies4,5 the present work was based on high-resolution scans on an expanded pool of volunteers (N=21 vs 5) and full 3D ROI analysis to overcome challenges associated with the small size and inter-subject variability of the appearance of habenula. Both highly localized hyperintensity in habenula QSM and positive correlation between QSM and R2* indicate that inter-subject susceptibility variation in the habenula region is largely driven by the concentration of iron rather than myelinated fibers. This hypothesis should be further examined through more quantitative methods to disentangle positive and negative susceptibility sources published recently.10,11 Such investigation could potentially help establish magnetic susceptibility as a useful biomarker for neuroscience and neurodisease studies of human habenula.Acknowledgements
This work was funded by IBS-R015-D1. We thank Dr. Hongjiang Wei for helpful discussions and providing us with STISuite 3.0.
References
1. Strotmann, Barbara, et al. High‐resolution MRI and diffusion‐weighted imaging of the human habenula at 7 tesla. Journal of Magnetic Resonance Imaging. 2014;39(4):1018-1026.
2. Li, Bo, et al. Synaptic potentiation onto habenula neurons in the learned helplessness model of depression. Nature. 2011;470(7335):535-539
3. Kim, Joo-won, et al. Human habenula segmentation using myelin content. NeuroImage. 2016;130:145-156
4. Schenck JF et al., Proc ISMRM 23 (2015), p.285.
5. S-K Lee et al., Proc ISMRM 25 (2017), p.4683.
6. Morris, C. M., et al. Histochemical distribution of non-haem iron in the human brain. Cells Tissues Organs. 1992;144(3):235-257
7. Gudbjartsson, Hákon, and Samuel Patz. The Rician distribution of noisy MRI data. Magnetic resonance in medicine. 1995:34(6):910-914
8. Miller, Aaron J., and Peter M. Joseph. The use of power images to perform quantitative analysis on low SNR MR images. Magnetic resonance imaging. 1993;11(7):1051-1056
9. Wei, Hongjiang, et al. Streaking artifact reduction for quantitative susceptibility mapping of sources with large dynamic range. NMR in Biomedicine. 2015;28(10):1294-1303
10. Jingu Lee et al., Proc ISMRM 25 (2017), p.751
11. Schweser, F et al., Proc ISMRM 20 (2012), p.409
Figures